. 2023 Feb 17;24(4):4092.
doi: 10.3390/ijms24044092.

Genome-Wide Characterization of the PIFs Family in Sweet Potato and Functional Identification of IbPIF3.1 under Drought and Fusarium Wilt Stresses

Affiliations

Genome-Wide Characterization of the PIFs Family in Sweet Potato and Functional Identification of IbPIF3.1 under Drought and Fusarium Wilt Stresses

Nan Nie et al. Int J Mol Sci. .

Abstract

Phytochrome-interacting factors (PIFs) are essential for plant growth, development, and defense responses. However, research on the PIFs in sweet potato has been insufficient to date. In this study, we identified PIF genes in the cultivated hexaploid sweet potato (Ipomoea batatas) and its two wild relatives, Ipomoea triloba, and Ipomoea trifida. Phylogenetic analysis revealed that IbPIFs could be divided into four groups, showing the closest relationship with tomato and potato. Subsequently, the PIFs protein properties, chromosome location, gene structure, and protein interaction network were systematically analyzed. RNA-Seq and qRT-PCR analyses showed that IbPIFs were mainly expressed in stem, as well as had different gene expression patterns in response to various stresses. Among them, the expression of IbPIF3.1 was strongly induced by salt, drought, H2O2, cold, heat, Fusarium oxysporum f. sp. batatas (Fob), and stem nematodes, indicating that IbPIF3.1 might play an important role in response to abiotic and biotic stresses in sweet potato. Further research revealed that overexpression of IbPIF3.1 significantly enhanced drought and Fusarium wilt tolerance in transgenic tobacco plants. This study provides new insights for understanding PIF-mediated stress responses and lays a foundation for future investigation of sweet potato PIFs.

Keywords: Ipomoea batatas; Ipomoea trifida; Ipomoea triloba; PIFs; expression analysis; function analysis.


Conflict of interest statement

The authors declare no conflict of interest.

Figures

Figure 1
Figure 1
Chromosomal location and distribution of PIF genes in (A) I. batatas; (B) I. triloba; and (C) I. trifida. The bars represent chromosomes, the chromosome numbers are displayed on the left side, and the gene names are displayed on the right side. The relative chromosomal location of each PIF gene is marked with the black line at the right side.
Figure 2
Figure 2
Phylogenetic analysis of the PIF families in A. thaliana, C. sinensis, D. carota, I. batatas, I. triloba, I. trifida, M. domestica, O. sativa, S. lycopersicum, S. tuberosum, and V. vinifera. A total of 70 PIFs were divided into four groups (groups I–IV), according to the evolutionary distance. The blue circles represent the eight AtPIFs in A. thaliana. The pink squares represent the seven CsPIFs in C. sinensis. The blue stars represent the five DcPIFs in D. carota. The red rhombus represents the six IbPIFs in I. batatas. The purple circles represent the six ItbPIFs in I. triloba. The indigotin squares represent the six ItfPIFs in I. trifida. The dark green stars represent the seven MdPIFs in M. domestica. The yellow rhombus represents the six OsPIFs in O. sativa. The orange circles represent the eight SlPIFs in S. lycopersicum. The brown squares represent the seven StPIFs in S. tuberosum. The light green stars represent the four VvPIFs in V. vinifera.
Figure 3
Figure 3
The phylogenetic tree showing that PIFs are distributed into four groups on the left. The red circle represents the IbPIFs. (A) Conserved domain structure of PIFs in A. thaliana, I. batatas, I. triloba, and I. trifida. The yellow, green, and pink boxes represent the APB domain, APA domain, and bHLH domain, respectively; and (B) exon–intron structure of PIFs in A. thaliana, I. batatas, I. triloba, and I. trifida. The yellow boxes, green boxes, and grey lines represent the UTR, exons, and introns, respectively.
Figure 4
Figure 4
Analysis of cis-elements of IbPIFs in I. batatas, I. triloba, and I. trifida. The degree of red color represents the number of cis-elements upstream of the PIFs.
Figure 5
Figure 5
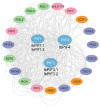
Functional interaction networks of IbPIFs in I. batatas according to orthologues in A. thaliana. Network nodes represent proteins, and lines represent protein–protein associations.
Figure 6
Figure 6
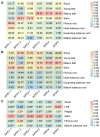
Gene expression patterns of IbPIFs in different tissues (shoot, young leaf, mature leaf, stem, fibrous root, initial tuberous root, expanding tuberous root, and mature tuberous root) of (A) Yan252 and (B) Xuzi3, as determined by RNA-seq. Log2(FPKM + 1) is shown in the boxes. (C) Gene expression patterns of IbPIFs in shoot, petiole, leaf, stem, fibrous root, and mature tuberous root of I. batatas. The values were determined by qRT-PCR from three biological replicates consisting of pools of three plants, and the results were analyzed using the comparative CT method. The expression at 0 h in each treatment was considered “1”. The fold change is shown in the boxes. Different lowercase letters indicate a significant difference of each IbPIFs at p < 0.05 based on Student’s t-test.
Figure 7
Figure 7
Gene expression patterns of IbPIFs in response to different phytohormones in I. batatas: (A) ABA; (B) GA; (C) IAA; (D) MeJA; and (E) SA. The values were determined by qRT-PCR from three biological replicates consisting of pools of three plants, and the results were analyzed using the comparative CT method. The expression at 0 h in each treatment was considered “1”. The fold change is shown in the boxes. Different lowercase letters indicate a significant difference of each IbPIFs at p < 0.05 based on Student’s t-test.
Figure 8
Figure 8
Gene expression patterns of IbPIFs of I. batatas in response to abiotic stresses: (A) NaCl; (B) PEG; (C) H2O2; (D) cold; and (E) heat. The values were determined by qRT-PCR from three biological replicates consisting of pools of three plants, and the results were analyzed using the comparative CT method. The expression at 0 h in each treatment was considered “1”. The fold change is shown in the boxes. Different lowercase letters indicate a significant difference of each IbPIFs at p < 0.05 based on Student’s t-test.
Figure 9
Figure 9
Gene expression patterns of IbPIFs of I. batatas in response to biotic stresses: (A) Fob infection; and (B) stem nematode infection. The values were determined by qRT-PCR from three biological replicates consisting of pools of three plants, and the results were analyzed using the comparative CT method. The expression at 0 h in each treatment was considered “1”. The fold change is shown in the boxes. Different lowercase letters indicate a significant difference of each IbPIFs at p < 0.05 based on Student’s t–test.
Figure 10
Figure 10
Drought tolerance identification of WT and IbPIF3.1-OE transgenic tobacco plants cultured on MS medium without (control) or with 20% PEG6000 for 4 weeks: (A) phenotypes; (B) root length; (C) fresh weight (scale bar = 2.5 cm); (D) MDA content; and (E) proline content in the leaves of plants after 4 weeks of treatment. Transcript levels of (F) NtPOD; (G) NtDREB1A; (H) NtDREB1B; and (I) NtDREB1D in the leaves of plants after 4 weeks of treatment. The transcript levels of the genes in WT without treatment control were set to 1. The values were determined by qRT-PCR from three biological replicates consisting of pools of three leaves. The error bars indicate ± SD (n = 3). *, p < 0.05; **, p < 0.01; Student’s t–test.
Figure 11
Figure 11
Development of plant disease symptoms in WT and IbPIF3.2-OE transgenic tobacco plants after Fob inoculation. W38 and IbPIF3.1-OE transgenic plants were inoculated with Fob spores at a density of 1.5 × 10⁷ mL−1 for 11 d: (A,B) phenotypes; (C) development of disease symptoms in leaves of WT and IbPIF3.1-OE transgenic tobacco lines after Fob inoculation (scale bar = 2.5 cm); (D) the number of diseased leaves in WT and IbPIF3.1-OE transgenic tobacco lines at 11 d; and transcript levels of (E) NtPR1a; (F) NtHSR201; and (G) NtHSR515 in WT and IbPIF3.1-OE transgenic tobacco lines. The transcript levels of genes in WT before inoculation were set to 1. The values were determined by qRT-PCR from three biological replicates consisting of pools of three leaves. The error bars indicate ± SD (n = 3). **, p < 0.01; Student’s t–test.

Similar articles

Cited by

References

    1. Bae G., Choi G. Decoding of light signals by plant phytochromes and their interacting proteins. Annu. Rev. Plant Biol. 2008;59:281–311. doi: 10.1146/annurev.arplant.59.032607.092859. - DOI - PubMed
    1. Roeber V.M., Bajaj I., Rohde M., Schmulling T., Cortleven A. Light acts as a stressor and influences abiotic and biotic stress responses in plants. Plant Cell Environ. 2021;44:645–664. doi: 10.1111/pce.13948. - DOI - PubMed
    1. Hoang Q.T.N., Han Y.J., Kim J.I. Plant Phytochromes and their Phosphorylation. Int. J. Mol. Sci. 2019;20:3450. doi: 10.3390/ijms20143450. - DOI - PMC - PubMed
    1. Li F.W., Mathews S. Evolutionary aspects of plant photoreceptors. J. Plant Res. 2016;129:115–122. doi: 10.1007/s10265-016-0785-4. - DOI - PubMed
    1. Quail P.H. Phytochrome photosensory signalling networks. Nat. Rev. Mol. Cell Biol. 2002;3:85–93. doi: 10.1038/nrm728. - DOI - PubMed

LinkOut - more resources