. 2023 Feb 18;24(4):4119.
doi: 10.3390/ijms24044119.

Interaction of Amphipathic Peptide from Influenza Virus M1 Protein with Mitochondrial Cytochrome Oxidase

Affiliations

Interaction of Amphipathic Peptide from Influenza Virus M1 Protein with Mitochondrial Cytochrome Oxidase

Ilya P Oleynikov et al. Int J Mol Sci. .

Abstract

The Bile Acid Binding Site (BABS) of cytochrome oxidase (CcO) binds numerous amphipathic ligands. To determine which of the BABS-lining residues are critical for interaction, we used the peptide P4 and its derivatives A1-A4. P4 is composed of two flexibly bound modified α-helices from the M1 protein of the influenza virus, each containing a cholesterol-recognizing CRAC motif. The effect of the peptides on the activity of CcO was studied in solution and in membranes. The secondary structure of the peptides was examined by molecular dynamics, circular dichroism spectroscopy, and testing the ability to form membrane pores. P4 was found to suppress the oxidase but not the peroxidase activity of solubilized CcO. The Ki(app) is linearly dependent on the dodecyl-maltoside (DM) concentration, indicating that DM and P4 compete in a 1:1 ratio. The true Ki is 3 μM. The deoxycholate-induced increase in Ki(app) points to a competition between P4 and deoxycholate. A1 and A4 inhibit solubilized CcO with Ki(app)~20 μM at 1 mM DM. A2 and A3 hardly inhibit CcO either in solution or in membranes. The mitochondrial membrane-bound CcO retains sensitivity to P4 and A4 but acquires resistance to A1. We associate the inhibitory effect of P4 with its binding to BABS and dysfunction of the proton channel K. Trp residue is critical for inhibition. The resistance of the membrane-bound enzyme to inhibition may be due to the disordered secondary structure of the inhibitory peptide.

Keywords: Bile Acids Binding Site; amphipathic ligands; cell penetrating peptides; cytochrome oxidase; regulation; secondary structure; α-helix.


Conflict of interest statement

The authors declare no conflict of interest. The sponsors had no role in the design, execution, interpretation, or writing of the study.

Figures
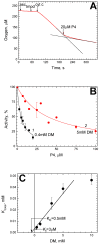
Figure 1
Figure 1
Inhibition of solubilized CcO by P4. The oxidase reaction was carried out in Basic Medium (BM) containing 20 nM mitochondrial CcO. (A) A typical trace of oxygen consumption. The additions of oxidation substrate (ascorbate, N,N,N′,N′-Tetramethyl-p-phenylenediamine (TMPD) and cytochrome c) and the P4 peptide are shown by the arrows. To highlight the inhibitory effect, the trace in the absence of P4 is shown, as well as the straight line corresponding to the final rate of the reaction (black lines). (B) The dependence of the oxidase reaction rate on the P4 concentration in the presence of 0.4 mM dodecyl-maltoside (DM, black symbols) and 5 mM DM (red symbols). The experimental points are approximated by Equation (1) with different Ki(app) parameters (see the text). (C) Dependence of Ki(app) for P4 on DM concentration. The segment being cut off on the Y axis by the approximating straight line indicates the true Ki value in the absence of DM. The segment being cut off on the X axis in its negative area indicates the value of dissociation constant for DM in the absence of P4, Kc. Both intersections are pointed by the arrows.
Figure 2
Figure 2
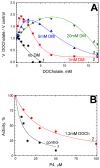
The interaction of P4 with solubilized CcO is affected by deoxycholate. (A) The DM-dependent biphasic action of deoxycholate on the CcO activity. The rate of the oxidase reaction (given in the relative units, the ordinate axis) was measured mostly as in Figure 1, but in the presence of different concentrations of deoxycholate (the abscissa axis) and DM. To guide the eye, empirical curves 1–5 are drawn through the experimental points, which correspond to 0, 1 mM, 5 mM and 20 mM DM, respectively. (B) The dependence of the oxidase activity on [P4]. Black squares—control, red circles—in the presence of 1.2 mM deoxycholate (DOCh). Other conditions are as in Figure 1.
Figure 3
Figure 3
The peroxidase activity of CcO is not affected by P4. Peroxidation of 0.2 mM ferrocyanide (against the background of equimolar ferricyanide) was monitored at 0.6 μM solubilized CcO. The reaction was triggered by the addition of 4 mM H2O2 (shown by the arrow). The addition of 50 μM P4 in the course of the experiment is indicated. The initial jump upon H2O2 addition reflects spectral response in the γ-band of heme a3 upon oxoferryl intermediate formation.
Figure 4
Figure 4
P4 inhibits CcO incorporated into the mitochondrial membrane. Rat liver mitochondria (closed symbols) or Keilin–Hartri particles from bovine hearts (SMP, open symbols) were suspended in the medium containing 0.3 M sucrose, 50 mM Hepes/Tris pH 7.6, 0.5 mM EDTA and 0.5 μM CCCP up to 0.8 mg of protein/mL. Otherwise, the oxidase reaction was carried out and registered as in Figure 1. An approximating hyperbolic function (1) is drawn through the experimental points in the range of 14–45 μM.
Figure 5
Figure 5
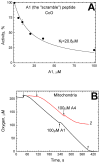
Susceptibility of the CcO activity to A1. (A) The dependence of the oxidase reaction rate on the A1 concentration in solution. All conditions are as in Figure 1. The approximating hyperbolic function (1) is drawn. (B) Effect of peptides A1 and A4 on mitochondrial respiration. See Figure 4 for the conditions. The addition of respiratory substrate is shown by the arrows. Additions of the peptides in the course of respiration are indicated.
Figure 6
Figure 6
Secondary structure of the peptides as predicted by molecular dynamics modeling. Preset parameters: 50 mM NaCl, T = 300 K, p = 1 bar, temperature control according to Berendsen [53]. The shown dynamic structure corresponds to the 100th ns of the molecular dynamic simulation. The residues belonging to the CRAC motif and Gly are marked in color as in Table 1. (AC) The peptides P4, A1, and A4, respectively.
Figure 7
Figure 7
The circular dichroism spectra of the peptides. The peptides P4, A1 and A4 (spectra 1–3, respectively) were diluted in BM medium up to 0.5 mg of protein/mL (c.a. 170 µM of a peptide). The local minima at 208 and 222 nm characteristic of the α-helical structure are indicated.
Figure 8
Figure 8
Permeabilization of calcein-loaded liposomes by the peptides. Calcein-loaded asolectin liposomes were diluted in the experimental medium (20 mM MOPS/Tris pH 7.3, 0.2 mM EDTA) to 0.1 mg of lipid/mL. After recording the initial fluorescence trace, the peptide P4 (trace 1), A1 (trace 2) or A4 (trace 3) was injected up to 5 µM, as indicated. The resulting increase in fluorescence reflects the kinetics of calcein release. The second addition of Triton X-100 (up to 0.1%) is shown by the arrows.
Figure 9
Figure 9
Structural view on the possibility of K-channel inhibition by BABS ligands. (A) Superposition of the P4 peptide secondary structure on the 3D structure of BABS. The structure of the dimeric mitochondrial enzyme in the region of BABS is shown (based on [63]). Side view. The inner (matrix) surface of the membrane is at the bottom. Subunits I (green), II (cyan) and Vb (grey) are indicated, as well as subunits III (brown) and VIa (wheat) from the neighboring monomer (marked with an asterisk, ∗). The peptide P4 molecule is depicted in the same conformation as in Figure 6A and inscribed in a hydrophobic gap between subunits I, II, and VIa, which opens onto the viewer. The residues belonging to the CRAC motif and Gly are marked in color as in Table 1 and Figure 6. (B) The location of BABS relative to the proton channel K. Compared to panel A, the view is zoomed in and slightly rotated. A bound cholate molecule is shown in the hydrophobic cavity. The most important residues are designated, and their structure is shown by sticks. Cyan color represents protonatable residues of subunit II near the entrance to the K-channel. The oxygen and nitrogen atoms are colored red and blue, respectively. The distances between some groups are given (double-sided arrows).

Similar articles

Cited by

References

    1. Lindgren M., Hällbrink M., Prochiantz A., Langel Ü. Cell-penetrating peptides. Trends Pharm. Sci. 2000;21:99–103. doi: 10.1016/S0165-6147(00)01447-4. - DOI - PubMed
    1. Derakhshankhah H., Jafari S. Cell penetrating peptides: A concise review with emphasis on biomedical applications. Biomed. Pharmacother. 2018;108:1090–1096. doi: 10.1016/j.biopha.2018.09.097. - DOI - PubMed
    1. Gautam A., Singh H., Tyagi A., Chaudhary K., Kumar R., Kapoor P., Raghava G.P.S. CPP site: A curated database of cell penetrating peptides. Database. 2012;2012 doi: 10.1093/database/bas015. - DOI - PMC - PubMed
    1. Frankel A.D., Pabo C.O. Cellular uptake of the tat protein from human immunodeficiency virus. Cell. 1988;55:1189–1193. doi: 10.1016/0092-8674(88)90263-2. - DOI - PubMed
    1. Green M., Loewenstein P.M. Autonomous functional domains of chemically synthesized human immunodefi ciency virus tat trans-activator protein. Cell. 1988;55:1179–1188. doi: 10.1016/0092-8674(88)90262-0. - DOI - PubMed

MeSH terms

LinkOut - more resources