. 2023 Feb 19;24(4):4149.
doi: 10.3390/ijms24044149.

Overexpression of TgERF1, a Transcription Factor from Tectona grandis, Increases Tolerance to Drought and Salt Stress in Tobacco

Affiliations

Overexpression of TgERF1, a Transcription Factor from Tectona grandis, Increases Tolerance to Drought and Salt Stress in Tobacco

Perla Novais de Oliveira et al. Int J Mol Sci. .

Abstract

Teak (Tectona grandis) is one of the most important wood sources, and it is cultivated in tropical regions with a significant market around the world. Abiotic stresses are an increasingly common and worrying environmental phenomenon because it causes production losses in both agriculture and forestry. Plants adapt to these stress conditions by activation or repression of specific genes, and they synthesize numerous stress proteins to maintain their cellular function. For example, APETALA2/ethylene response factor (AP2/ERF) was found to be involved in stress signal transduction. A search in the teak transcriptome database identified an AP2/ERF gene named TgERF1 with a key AP2/ERF domain. We then verified that the TgERF1 expression is rapidly induced by Polyethylene Glycol (PEG), NaCl, and exogenous phytohormone treatments, suggesting a potential role in drought and salt stress tolerance in teak. The full-length coding sequence of TgERF1 gene was isolated from teak young stems, characterized, cloned, and constitutively overexpressed in tobacco plants. In transgenic tobacco plants, the overexpressed TgERF1 protein was localized exclusively in the cell nucleus, as expected for a transcription factor. Furthermore, functional characterization of TgERF1 provided evidence that TgERF1 is a promising candidate gene to be used as selective marker on plant breeding intending to improve plant stress tolerance.

Keywords: AP2/ERF family; Tectona grandis; drought stress; salt stress; tropical tree.


Conflict of interest statement

The authors declare no conflict of interest.

Figures

Figure 1
Figure 1
Phylogenetic tree for the AP2/ERF family transcription factors of teak, Arabidopsis, and rice. The transcription factors of teak are shown in blue, Arabidopsis in green, and rice in red. A consensus tree is shown. Subgroups’ names were classified according to Wang (2019) [32]. The scale bar indicates the substitution rate per residue.
Figure 2
Figure 2
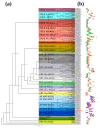
Phylogenetic tree and conserved protein motif for the teak AP2/ERF family of transcription factors. (a) The AWW87324, AWW87394, and AWW87396 proteins were aligned for construction of the phylogenetic tree. The consensus tree (after 1000 bootstrap samplings) with teak subgroup names is shown. The branch of AP2/ERF classification for teak is shown in blue, Arabidopsis in green, and rice in red. The scale bar indicates the substitution rate per residue. The motif composition of teak AP2/ERF proteins and the ten motifs are displayed in different colored boxes (b).
Figure 3
Figure 3
Multiple sequence alignment and phylogenetic tree of AP AP2-AOG1 and -AOG2 subgroups of AP2/ERF family transcription factors. (a) AP AP2-AOG1 and -AOG2 subgroups including AWW87394 (TgERF1) orthologous protein is shown in black, Arabidopsis in green, and rice in red, (b) TgERF1 multiple alignment to AP AP2-AOG1 and -AOG2 subgroups orthologous protein.
Figure 4
Figure 4
Expression profiles of TgEREF1 in response to ionic saline (NaCl) and non-ionic osmotic (PEG) stresses, and phytohormones in teak (Tectona grandis), as detected by RT-qPCR. Total RNA was isolated from leaves of two-month-old teak seedlings that were sampled after exposure to 150 mM NaCl, 20% PEG, 100 μM MeJA, 100 μM ACC, and 100 μM ABA. Controls consisted of teak seedlings incubated on MS culture medium. Values correspond to the means ± standard error of the mean of three biological replicates. * p < 0.05 and ** p < 0.01.
Figure 5
Figure 5
Subcellular localization of TgERF1::GFP protein in roots of transgenic tobacco seedlings. Cells from the root elongation zone of 7-day-old seedlings of a tobacco line were analyzed under Fluorescence Excitation (GFP), Bright Field, and Merge contrasting in a confocal microscope. WT root tissues without fluorescence; Transgenic line 35S::TgERF1- EGFP showing GFP fluorescence in the nucleus; Control line 35S::EGFP showing GFP fluorescence in the nucleus and cytoplasm. Bar: 30 μm.
Figure 6
Figure 6
Molecular and phenotypic characterization of transgenic tobacco plants overexpressing the TgERF1 gene. (a) Representative electrophoresis analysis of PCR amplification of the 35S::TgERF1 (520 bp fragment). Lane M: molecular weight marker (1-kb DNA ladder); Lane WT: wild-type genomic DNA. Lane C-: reaction mixture without DNA template as a negative control. Lane C+: plasmid DNA as a positive control. Lane L1, L2, L3, L4, and L5: kanamycin-resistant plants from putative transgenic events; (b) Expression of TgERF1 in WT and transgenic lines. Leaf tissues were examined by semiquantitative RT-PCR. The constitutive NtEF1α (Elongation Factor-1 alpha) housekeeping gene was used as an internal control; (c) Picture of 7-day-old WT and transgenic seedlings (E-L1, E-L2, E-L4) grown on MS culture medium. Bar: 1 cm; (d) Roots’ elongation rates. Bars represent a mean value of 20 seedlings/line ± SEM. Significant differences were determined by ANOVA followed by Dunnett’s test. * Significant at p < 0.05.
Figure 7
Figure 7
Root growth of transgenic tobacco lines overexpressing the TgERF1 gene and WT seedlings under various stress treatments, which consisted of (a) 20% PEG, (b) 300 mM mannitol, and (c) 150 mM NaCl. Bar: 1 cm. In these experiments, three-day-old seedlings were transferred to the osmotic and saline treatments and grown for seven days. The primary root length and lateral root numbers were recorded at seven days after the transfer. Each experiment consisted of 16 seedlings/line and three repetitions. Bars represent the mean value ± SEM of three independent assays. Significant differences were determined by ANOVA followed by Dunnett’s test. ** Significant at p < 0.01 and * at p < 0.05.
Figure 8
Figure 8
Representative phenotypes in transgenic tobacco lines and WT leaf tissues after salt treatments. (a) Leaf discs detached from transgenic plants overexpressing the TgERF1 and WT plants were floated on MS liquid medium supplied with 0, 400, and 800 mM NaCl for 3 days. Bar: 0.5 cm. (b) Chlorophyll index (SPAD-value) in leaf tissues after salt treatment. In each experiment, 15 leaf discs/line were used. Bars represent mean value ± SEM. Significant differences were determined by ANOVA followed by Dunnett’s test. ** Significant at p < 0.01.
Figure 9
Figure 9
Phenotypic differences among TgERF1 transgenic tobacco and WT under drought stress. (a) Phenotype of transgenic and WT plants initially grown for three weeks under usual conditions, which was followed by 12 days under drought stress and then by rewatering for three days. Bar: 2 cm (b) Survival rates and (c) shoot water content was measured after 4 days of drought stress recovery. Bars show mean value ± SEM. Significant differences were determined by ANOVA followed by Dunnett’s test. ** Significant at p < 0.01.
Figure 10
Figure 10
Chlorophyll index (SPAD-value) and photosynthetic parameters of TgERF1 transgenic tobacco and WT in response to drought stress. Plants were grown in individual pots and were watered with one-fifth-strength Hoagland solution and weighed daily during the experiment. Well-watered control plants were grown in 100% field capacity (0% of water loss). The time-course drought stress assay started by withholding the nutrient solution until reaching 70% water loss. The (a) chlorophyll index, (b) transpiration rate, (c) stomatal conductance, and (d) photosynthetic rates were measured in leaves of transgenic plants and WT plants under well-watered and water-deficit conditions. Data are presented as the means ± SEM of four biological replicates. Significant differences were determined by ANOVA followed by Dunnett’s test. ** Significant at p < 0.01 and * at p < 0.01.
Figure 11
Figure 11
Chlorophyll fluorescence parameters in TgERF1 transgenic and WT plants under water-deficit treatment (Drought) and under well-watered conditions (Control). Plants were grown in individual pots, watered with one-fifth-strength Hoagland solution, and weighed daily during the experiment. Well-watered control plants were grown in 100% field capacity (0% of water loss). The time course drought stress assay started by withholding the nutrient solution until reaching 70% water loss. (a) Chlorophyll fluorescence images of Y(II), Y(NO), and Y(NPQ) are shown. The color scale at the top represents absolute values ratio ranging from 0 (black) to 1.0 (pink). Bar: 1.5 cm (b) Quantum yield of PSII, including Y(II) (actual photosynthetic efficiency of PS II), Y(NO) (quantum yield of non-regulated energy dissipation), and Y(NPQ) (effective quantum yield of PS II). (c) Changes in qL (photochemical quenching coefficient). Physiological parameters were registered in leaves of transgenic and WT plants under normal and water-deficit conditions. Data are presented as the means ± SEM of four biological replicates. Significant differences were determined by ANOVA followed by Dunnett’s test. ** Significant at p < 0.01.
Figure 12
Figure 12
TgERF1 transgenic and WT tobacco plants in response to drought stress. (a) Relative water content. (b) Proline. (c) Endogenous ABA concentration. Plants were grown in individual pots, watered with one-fifth-strength Hoagland solution and weighed daily during the experiment. Well-watered control plants were grown in 100% field capacity (0% of water loss). The time course drought stress assay started by withholding the nutrient solution until reaching 70% water loss. Leaf contents of proline, relative water, and endogenous ABA were measured in transgenic and WT plants under drought and control conditions. Proline was quantified spectrophotometrically. Data are presented as means ± SEM of four biological replicates. Significant differences were determined by ANOVA followed by Dunnett’s test. ** Significant at p < 0.01 and * at p < 0.01.
Figure 13
Figure 13
Relative expression of stress responsive genes at ten days of drought treatment. (a) Characterization of expression levels of the TgERF1 transgene. (bf) Stress responsive genes NtAPX, NtCAT, NtSOD, NtLEA5, NtERD10C. Total RNA was isolated from plant leaf tissues at ten days of drought stress. Measured parameters were performed at 40 days after sowing (DAS). The constitutive NtEF1α housekeeping gene was used as internal control. Data are presented as means ± SEM of three biological replicates. Significant differences were determined by ANOVA followed by Dunnett’s test. ** Significant at p < 0.01 and * at p < 0.01.

Similar articles

Cited by

References

    1. Zhang B., Su L., Hu B., Li L. Expression of AhDREB1, an AP2/ERF Transcription Factor Gene from Peanut, Is Affected by Histone Acetylation and Increases Abscisic Acid Sensitivity and Tolerance to Osmotic Stress in Arabidopsis. Int. J. Mol. Sci. 2018;19:1441. doi: 10.3390/ijms19051441. - DOI - PMC - PubMed
    1. Rasheed S., Bashir K., Matsui A., Tanaka M., Seki M. Transcriptomic analysis of soil-grown Arabidopsis thaliana roots and shoots in response to a drought stress. Front. Plant Sci. 2016;7:180. doi: 10.3389/fpls.2016.00180. - DOI - PMC - PubMed
    1. Demekamp M., Smeekens S.C. Integration of wounding and osmotic stress signals determines the expression of the AtMYB102 transcription factor gene. Plant Physiol. 2003;132:1415–1423. doi: 10.1104/pp.102.019273. - DOI - PMC - PubMed
    1. Fujita M., Fujita Y., Noutoshi Y., Takahashi F., Narusaka Y., Yamaguchi-Shinozaki K. Crosstalk between abiotic and biotic stress responses: A current view from the points of convergence in the stress signaling networks. Curr. Opin. Plant Biol. 2006;9:436–442. doi: 10.1016/j.pbi.2006.05.014. - DOI - PubMed
    1. Cheng M.C., Liao P.M., Kuo W.W., Lin T.P. The Arabidopsis ETHYLENE RESPONSE FACTOR1 Regulates abiotic stress-responsive gene expression by binding to different cis-acting elements in response to different stress signals. Plant Physiol. 2013;162:1566–1582. doi: 10.1104/pp.113.221911. - DOI - PMC - PubMed