. 2023 Feb 19;24(4):4151.
doi: 10.3390/ijms24044151.

Caspase Inhibition Modulates Monocyte-Derived Macrophage Polarization in Damaged Tissues

Affiliations

Caspase Inhibition Modulates Monocyte-Derived Macrophage Polarization in Damaged Tissues

Stéphanie Solier et al. Int J Mol Sci. .

Abstract

Circulating monocytes are recruited in damaged tissues to generate macrophages that modulate disease progression. Colony-stimulating factor-1 (CSF-1) promotes the generation of monocyte-derived macrophages, which involves caspase activation. Here, we demonstrate that activated caspase-3 and caspase-7 are located to the vicinity of the mitochondria in CSF1-treated human monocytes. Active caspase-7 cleaves p47PHOX at aspartate 34, which promotes the formation of the NADPH (nicotinamide adenine dinucleotide phosphate) oxidase complex NOX2 and the production of cytosolic superoxide anions. Monocyte response to CSF-1 is altered in patients with a chronic granulomatous disease, which are constitutively defective in NOX2. Both caspase-7 down-regulation and radical oxygen species scavenging decrease the migration of CSF-1-induced macrophages. Inhibition or deletion of caspases prevents the development of lung fibrosis in mice exposed to bleomycin. Altogether, a non-conventional pathway that involves caspases and activates NOX2 is involved in CSF1-driven monocyte differentiation and could be therapeutically targeted to modulate macrophage polarization in damaged tissues.

Keywords: CSF1; NOX2; caspase; differentiation; lung fibrosis; macrophage.


Conflict of interest statement

The authors declare that they have no conflict of interest.

Figures
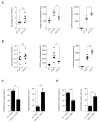
Figure 1
Figure 1
Macrophage alterations in monocyte-restricted caspase knockout mice. (A,B) Interstitial macrophages were sorted from the lung of monocyte-restricted caspase-3/7 double knockout (LysM-Cre/Casp3/7fl/fl) or caspase-8 knockout (LysM-Cre; Casp8fl/fl) mice or wild-type (wt) animals. Interstitial macrophages were selected according to their larger size (FSC) and granularity (SSC) as CD45+, GR1, CD11bhigh, SiglecF, IA-IE+, CD24 cells. (A) Left panel, number of interstitial macrophages, expressed as percent of CD45+ cells, in wild-type and LysM-Cre/Casp3/7fl/fl mice (c3/7 ko). Flow cytometry analysis of cell surface markers CD206 (middle panel) and CD54 (right panel) expressed as mean fluorescence intensity (*, p < 0.05; ns, non-significant; Mann–Whitney test, n = 5 per group). Mean ± SE. (B) Left panel, number of interstitial macrophages, expressed as percent of CD45+ cells, in wild-type and LysM-Cre; Casp8fl/fl mice (c8 ko). Flow cytometry analysis of cell surface markers CD206 (middle panel) and CD54 (right panel) expressed as mean fluorescence intensity (*, p < 0.05; **, p < 0.01; ns, non-significant; Mann–Whitney test, n = 6 per group). Mean ± SE. (C,D) Bone marrow cells were flushed from mouse femurs and tibias of LysM-Cre/Casp3/7fl/fl (C) or LysM-Cre; Casp8fl/fl mice (D) or wild-type (wt) animals before sorting CD115+/CD11c/NK monocytes. These cells were cultured in the presence of 100 ng/mL CSF1 for 5 days before multiparameter flow cytometry analysis. Left panels show the percentage of CD206+/CD71+ macrophages. Right panels indicate the percentage of CD40+/CD54+ macrophages (*, p < 0.05; **, p < 0.01; Mann–Whitney test, n = 4). Mean ± SE.
Figure 2
Figure 2
Active caspase-3 and caspase-7 are located to the mitochondria in CSF-1 treated human monocytes (A) Active caspase-3 (green), γ-H2AX (red) and DAPI (blue) staining of peripheral blood human monocytes treated with GM-CSF (100 ng/mL, 4 days) or CSF-1 (100 ng/mL, 4 days) or staurosporine (STS, 1 µM, 3 h). Scale bar, 5 µm. (B) 3D single-cell analysis of active caspase-3 (green) in CSF-1-treated monocyte (nucleus in red, DAPI staining). Scale bar, 5 µm. (C) Active caspase-3 (green), mitochondria (mitotracker, red) and nucleus (DAPI, blue) staining in CSF-1-treated monocytes. Scale bar, 10 µm. Threshold set to 300 (green) and 800 (red) for co-localization analyses with ImageJ-JACoP; Manders coefficient: 0.812 (fraction of active caspase-3 co-localized with mitochondria). (D) Immunogold staining of active caspase-3 in CSF-1- and GM-CSF-treated monocytes showing the co-localization of mitochondria and active caspase-3 in CSF-1-treated monocytes. Scale bar, 0.5 µm. (E) Confocal microscopy image (left panel) and intensity tracing (right panel) of FAM-DEVD-FMK (green) and mitotracker (red) distribution in a CSF-1-treated monocyte (DAPI staining of the nucleus in blue). Scale bar, 5 µm. (F) FAM-DEVD-FMK intensity measured by flow cytometry in tetramethylrhodamine (TMRM) positive mitochondria isolated from CSF-1 and GM-CSF-treated human monocytes (***, p < 0.001; Fisher Exact Test). Mean ± SE.
Figure 3
Figure 3
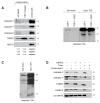
Active forms of caspase-3 and caspase-7 and their localization to the outer mitochondrial membrane. Sorted human monocytes were analyzed before any treatment or after a 4-day exposure to 100 ng/mL CSF-1, with or without 50 µM Q-VD-OPh (A) Immunoblot analysis of indicated proteins in lysates of mitochondria sorted from untreated and CSF1-treated monocytes, and in total cell lysates of CSF1-treated cells. (B,C) In situ caspase trapping assays performed in CSF-1-treated monocytes in the absence or presence of Q-VD-OPh. Inputs (10%) shown for comparison. Immunoblot detection of active caspase-3 (B) and active caspase-7 (C) in whole cell lysates and in mitochondrial lysates respectively, using anti-caspase-3 and an anti-caspase-7 antibodies. (D) Immunoblot analysis of indicated proteins in mitochondria isolated from CSF-1-treated monocytes and exposed to proteinase K or HEPES or Triton X100. Protein ladder (kDa) is indicated.
Figure 4
Figure 4
NOX2-dependent cytosolic ROS production, downstream of caspase activation. (A) Monocytes were untreated or treated with CSF-1 (100 ng/mL, 4 days) in the absence or presence of 50 µM Q-VD-OPh before measuring mitochondrial mass with MTG (MitoTracker Green), mitochondrial membrane potential with TMRM (tetramethylrhodamine), mitochondrial superoxides with MitoSOX, intracellular calcium with Fluo-3 AM and cytosolic ROS with DCF (2’,7’-dichlorofluorescein). The negative control (neg ctrl) corresponded to the absence of cell incubation with MTG, TMRM, MitoSOX, Fluo-3 AM or DCF. (*, p < 0.05; ns, non-significant; Kruskal–Wallis test with Dunn’s post test). (BD) Monocytes from healthy donors were treated with CSF-1 (100 ng/mL, 4 days) in the absence or presence of Tiron (500 µM), or Mito-TEMPO (50 nM), and monocytes from patients with a chronic granulomatous disease (CGD, n = 3) were treated with CSF-1 (100 ng/mL, 4 days). (B) The fraction of cells with an elongated shape (elongation factor > 2.5) was measured. (***, p < 0.001/6; ns, non-significant; Fisher test with Bonferroni correction). Mean ± SE. (C,D) Variation in the Mean fluorescence index of cell surface CD163 and CD16 expression in healthy donor monocytes treated with CSF-1 (100 ng/mL, 4 days) and Tiron (n = 7) or Mito-TEMPO (n = 7) and in CGD monocytes treated with CSF1 alone (n = 3), all compared to CSF1-treated healthy monocytes (Mean ± SE). (E) DEVD activity in CSF-1-treated healthy donor and CGD monocytes (Mean ± SE of three measurements; Mann–Whitney test; ns, non-significant).
Figure 5
Figure 5
Detection of caspase dependent-active NOX2 complex in mitochondria of CSF1-treated monocytes. (A) Assembly of the NOX2 complex: inactive state (upper panel), active state (lower panel). (B) Immunogold labeling of NOX2 and p47PHOX analyzed by electron microscopy in CSF1-treated monocytes. Scale bar, 1 µm. ER, endoplasmic reticulum; M, mitochondrion. (C) In situ proximity ligation assay (PLA) of p47PHOX and NOX2 in CSF-1 treated monocytes (100 ng/mL, 4 days) in the absence or presence of Q-VD-OPh (50 µM). Left panel, specific signal in green; right panel, overlay with nuclear staining with DAPI in blue; Scale bar, 10 µm. (D) Fraction of cells harbouring a signal in PLA (***, p < 0.001; Fisher Exact Test). Mean ± SE. (E) Measurement of the distance from PLA signal to the nucleus, the membrane or the mitochondria. Circles were drawn, centered on forty-two PLA signals. The Distance_nuclei, Distance_membrane, and Distance_mitochondria correspond to the shorter radius to encounter the nucleus, the plasma membrane or the mitochondria.
Figure 6
Figure 6
Caspase-mediated cleavage of p47PHOX generates an active NOX2 complex. (A) Immunoblot analysis of p47PHOX in monocytes exposed to CSF-1 for indicated times (days). HSC70, loading control; star, ≈36 kDa band. (B) Monocytes transfected with a pool of scrambled or p47PHOX targeting siRNAs were treated with CSF-1 (100 ng/mL) for 4 days before analysis of p47PHOX expression by immunoblotting. HSC70, loading control; star, cleavage fragment. (C) Immunoblot analysis of p47PHOX in cells treated for 4 days with CSF-1, with or without 50 µM Q-VD-Oph (QVD); HSC70, loading control; star, cleavage fragment. (D) p47PHOX protein was incubated or not with lysate (80 µg) of CSF-1 or CSF-1 + QVD-treated monocytes before immunoblot analysis with an anti-GST antibody; star, cleavage fragment. (E) Wild-type (wt) and D34A mutant of GST-p47PHOX protein were incubated with 80 µg of CSF-1-treated monocyte lysate before immunoblotting with an anti-GST antibody. (F) Full length and truncated p47PHOX were incubated with GST-p22PHOX, precipitated with glutathione-sepharose beads, and eluted with glutathione before immunoblotting with an anti-p47PHOX antibody. GST, loading control. (G) Monocytes transfected with a pool of scrambled or caspase targeting siRNAs were treated with CSF-1 (100 ng/mL, 4 days) before immunoblot analysis of p47PHOX, caspase-3 and caspase-7 expression. HSC70, loading control; star, cleavage fragment. Protein ladder (kDa) is indicated. Pink star: cleaved fragment from endogenous p47PHOX; black star: cleaved fragment from recombinant p47PHOX.
Figure 7
Figure 7
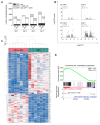
Impact of Q-VD-OPh on gene expression (mRNA) in CSF1-treated monocytes. Monocytes sorted from the peripheral blood of 7 healthy donors were treated by 100 ng/mL CSF1 in the absence or presence of 50 µM Q-VD-Oph (QVD) for 1, 2, 3 or 4 days. (A) Time dependent changes in the number of up- and down-regulated genes in CSF1-treated monocytes only (in black), in monocytes treated with CSF1 + QVD only (in gray), and in both situation (in white). (B) Volcano plots of differentially expressed genes in CSF1 + QVD compared to CSF1-treated monocytes (dark gray, qvalue < 0.05, fold change > 1.3). (C) Heatmap of the expression of the top-100 deregulated genes in monocytes treated with CSF1 alone (right) and CSF1 + QVD (left). (D) Gene Set Enrichment Analysis (GSEA) of CSF1 + QVD-treated monocytes compared to CSF1-treated monocytes. NES, normalized enrichment score; FDR, false discovery rate.
Figure 8
Figure 8
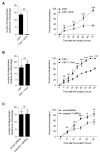
Caspase inhibition alters the migration of CSF1-induced macrophages. Bacterial uptake was measured by the gentamicin protection assay (left panels) and cell migration was studied using a wound-healing assay (right panels) in monocytes treated for 4 days with CSF-1, with or without 50 µM Q-VD-OPh (A), 500 µM Tiron (B), or a pool of scrambled or caspase-7 targeting siRNAs (C). Mann–Whitney test was used to compare the number of phagocytosed bacteria, and two-way ANOVA with Bonferroni post-test was used for the wound-healing assay (*, p < 0.05; **, p < 0.01; ***, p < 0.001; ns, non-significant). Mean ± SE.
Figure 9
Figure 9
Emricasan prevents bleomycin-induced lung fibrosis. (A) Representative histological pictures of Sirius Red-stained lung tissue sections from untreated mice (control) and mice injected intraperitoneally with bleomycin sulphate (0.1 mg/g body weight) once a week for 3 weeks, without (bleomycin) or with Z-VAD-FMK (bleomycin + ZVAD, 1 µg/g body weight intra-peritoneally every day for three weeks) or Emricasan (bleomycin + IDN, 18 µg/g body weight subcutaneously twice a day during three weeks) and mice treated with Z-VAD-FMK (ZVAD) or Emricasan (IDN) alone. Lungs were fixed in FineFix and paraffin embedded before staining collagen fibers with Sirius Red. Scale bar, 100 µm. (B) Quantification of Sirius Red labeling intensity. Results are expressed as fold change in Sirius Red staining in treated compared to control mice (bleomycin was compared to untreated, bleomycin + ZVAD to ZVAD alone, bleomycin + IDN to IDN alone). Each dot or square is an individual mouse. ***, p < 0.001; *, p < 0.05; Mann–Whitney test. Mean ± SE. (C) Quantification of airspace number/mm2 of parenchymal tissue. Results expressed as fold change in treated compared to control mice as in B. ***, p < 0.001; *, p < 0.05; Mann–Whitney test. Mean ± SE. (D) Flow cytometry analysis of CD54, CD71, CD206 and CD40 at the surface of interstitial macrophages from bleomycin- and bleomycin + ZVAD-treated mice. Representative scatter plots are shown. (E) CD54 mean fluorescence intensity at the surface of lung interstitial macrophages expressed in fold change (**, p < 0.01; Mann–Whitney test). Mean ± SE.
Figure 10
Figure 10
Caspase-8 deletion in granulo-monocytes prevents bleomycin-induced lung fibrosis. (A) Representative histological pictures of Sirius Red-stained lung tissue sections from wild-type (wt) and LysM-Cre; Caspase-8flox/flox (c8 ko) mice either left untreated (left panels) or injected intraperitoneally with bleomycin sulphate (0.1 mg/g body weight) once a week for 3 weeks (right panels). As in Figure 9A, lungs were fixed in FineFix and paraffin embedded before staining collagen fibers with Sirius Red. Scale bar, 100 µm. (B) Quantification of Sirius Red labeling intensity. Results are expressed as fold change in Sirius Red staining in treated compared to untreated control mice (wt + bleomycin was compared to wt, c8 ko + bleomycin was compared to c8 ko) *, p < 0.05; Mann–Whitney test. Mean ± SE. (C) Quantification of airspace number/mm2 of parenchymal tissue. Results are expressed as fold change in treated compared to untreated wild-type mice, as in panel B; *, p < 0.05; Mann–Whitney test. Mean ± SE. (D) Flow cytometry analysis of CD54 mean fluorescence intensity at the surface of lung interstitial macrophages expressed in fold change (*, p < 0.05; ns, non-significant; Mann–Whitney test). Mean ± SE. (E) Cytokines were measured in broncho-alveolar lavage fluid collected from bleomycin-treated wild-type (wt) and LysM-Cre/Casp8fl/fl (c8 ko) mice treated with bleomycin. Results are expressed as fold-changes compared to untreated mice (**, p < 0.01; ns, non-significant; Mann–Whitney test). Mean ± SE.

References

    1. Ginhoux F., Greter M., Leboeuf M., Nandi S., See P., Gokhan S., Mehler M.F., Conway S.J., Ng L.G., Stanley E.R., et al. Fate mapping analysis reveals that adult microglia derive from primitive macrophages. Science. 2010;330:841–845. doi: 10.1126/science.1194637. - DOI - PMC - PubMed
    1. Hoeffel G., Wang Y., Greter M., See P., Teo P., Malleret B., Leboeuf M., Low D., Oller G., Almeida F., et al. Adult Langerhans cells derive predominantly from embryonic fetal liver monocytes with a minor contribution of yolk sac-derived macrophages. J. Exp. Med. 2012;209:1167–1181. doi: 10.1084/jem.20120340. - DOI - PMC - PubMed
    1. Geissmann F., Manz M.G., Jung S., Sieweke M.H., Merad M., Ley K. Development of monocytes, macrophages, and dendritic cells. Science. 2010;327:656–661. doi: 10.1126/science.1178331. - DOI - PMC - PubMed
    1. Murray P.J., Wynn T.A. Protective and pathogenic functions of macrophage subsets. Nat. Rev. Immunol. 2011;11:723–737. doi: 10.1038/nri3073. - DOI - PMC - PubMed
    1. Qian B.Z., Pollard J.W. Macrophage diversity enhances tumor progression and metastasis. Cell. 2010;141:39–51. doi: 10.1016/j.cell.2010.03.014. - DOI - PMC - PubMed

LinkOut - more resources