. 2023 Feb 19;24(4):4163.
doi: 10.3390/ijms24044163.

Evidence for Existence of Multiple Functional Human Small RNAs Derived from Transcripts of Protein-Coding Genes

Affiliations

Evidence for Existence of Multiple Functional Human Small RNAs Derived from Transcripts of Protein-Coding Genes

Fan Gao et al. Int J Mol Sci. .

Abstract

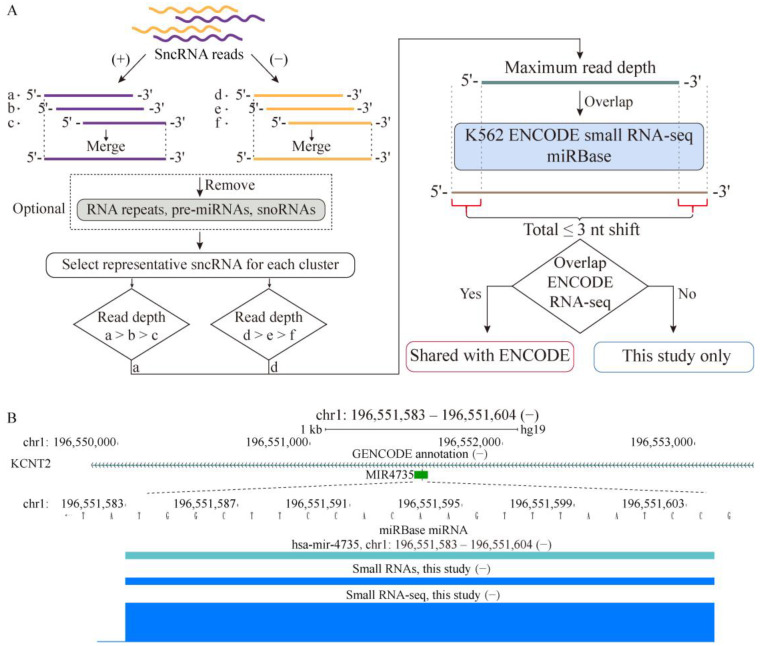
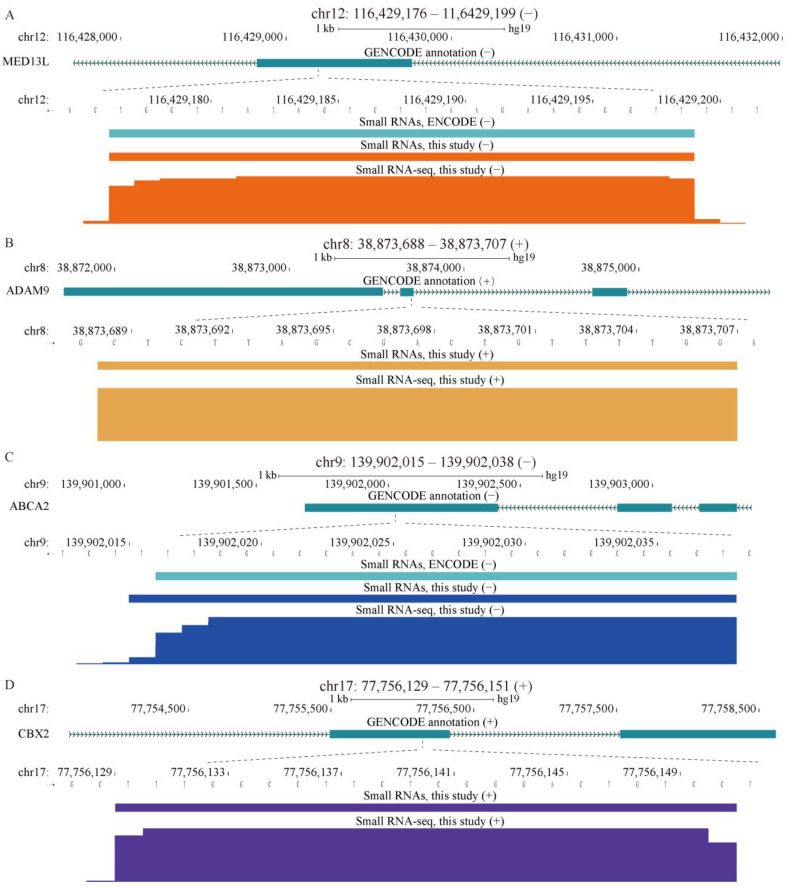
The human genome encodes a multitude of different noncoding transcripts that have been traditionally separated on the basis of their lengths into long (>200 nt) or small (<200 nt) noncoding RNAs. The functions, mechanisms of action, and biological relevance of the vast majority of both long and short noncoding transcripts remain unknown. However, according to the functional understanding of the known classes of long and small noncoding RNAs (sncRNAs) that have been shown to play crucial roles in multiple biological processes, it is generally assumed that many unannotated long and small transcripts participate in important cellular functions as well. Nevertheless, direct evidence of functionality is lacking for most noncoding transcripts, especially for sncRNAs that are often dismissed as stable degradation products of longer RNAs. Here, we developed a high-throughput assay to test the functionality of sncRNAs by overexpressing them in human cells. Surprisingly, we found that a significant fraction (>40%) of unannotated sncRNAs appear to have biological relevance. Furthermore, contrary to the expectation, the potentially functional transcripts are not highly abundant and can be derived from protein-coding mRNAs. These results strongly suggest that the small noncoding transcriptome can harbor multiple functional transcripts that warrant future studies.

Keywords: RNA dark matter; high-throughput phenotypic assay; noncoding RNA; short RNA; small RNA.


Conflict of interest statement

The authors declare no conflict of interest.

Figures

Figure 1
Figure 1
Profiling sncRNA transcriptome in a human cancer cell line. (A) Schematics illustrating the discovery and characterization of sncRNA transcriptome performed in this work. Small RNA-seq analyses from three independent batches of K562 cells were combined, and reads overlapping on the same strand were merged into clusters. For analysis of unannotated sncRNAs only, the clusters were filtered to remove those that overlap with the RNA family of repeats and annotated mi- and snoRNAs. Then, for each cluster, a representative sncRNA with unique 5′/3′ coordinates and maximum read depth was selected. The same procedure was also applied to the ENCODE small RNA-seq data without the optional filtering step. An sncRNA whose 5′ or 3′ coordinates mapped within 3 bp of an miRBase miRNA was considered as having precise overlap with that miRNA. An unannotated sncRNA detected in this study that overlapped an ENCODE sncRNA using the same overlap criterion was considered as shared with the ENCODE dataset. (B) Example of precise detection of a mature miRNA in our small RNA-seq pipeline. Shown are the locations and genomic coordinates of the mature hsa-mir-4735 (based on miRBase) and sncRNAs generated by our pipeline from the K562 small RNA-seq data produced in this study. In addition, the normalized RNA-seq signal from this study is shown. Genomic coordinates of the sncRNA detected in this study are shown above the panel.
Figure 2
Figure 2
Properties of unannotated sncRNA transcriptome in a human cancer cell line. Top: The middle pie chart shows the fractions of the sncRNAs shared with ENCODE and those found only in this study. The left and right pie charts show the numbers and fractions of unannotated sncRNAs mapping to the various indicated genomic features for respectively this-study-only and shared K562 sncRNAs, respectively. Bottom left: Box plots of expression levels (log10 RPKM, Y-axis) of shared (left) and this-study-only (right) K562 sncRNAs. Bottom right: Odds ratios (Y-axes) of enrichment of this-study-only and shared K562 sncRNAs in the different types of genomic elements (X-axes). The red dashed horizontal lines represent odds ratios of 1, corresponding to no enrichment.
Figure 3
Figure 3
Examples of sncRNAs mapping to exons of protein-coding genes. SncRNAs mapping to the CDS (A,B) and 3′ UTR (C,D) regions are shown for the sncRNAs that are either shared with ENCODE (A,C) or unique to this study (B,D). Locations of the sncRNAs generated by our pipeline from the K562 small RNA-seq data produced in this study (AD) and by ENCODE (A,C) are shown. (AD) The normalized RNA-seq signal from this study is shown. Genomic coordinates of the sncRNAs detected in this study are shown above the panels.
Figure 4
Figure 4
Examples of sncRNAs mapping to introns of protein-coding genes. Locations of the sncRNAs generated by our pipeline from the K562 small RNA-seq data produced in this study (A,B) and by ENCODE (A) are shown for the shared (A) or this-study-only (B) sncRNAs mapping to introns. (A,B) The normalized RNA-seq signal from this study is also shown. Genomic coordinates of the sncRNAs detected in this study are shown above the panels.
Figure 5
Figure 5
Design and validation of the sncRNA overexpression strategy. (A) Strategy of sncRNA overexpression in a lentiviral vector. A genomic region containing the target sncRNA plus ~200 bp of flanking DNA on each site is cloned in place of the suicide ccdB cassette downstream from a strong Dox-inducible RNA Pol2 promoter. (B) Validation of the strategy by transient overexpression of selected unannotated sncRNAs in HEK293 cells. For each biological replicate (R1 and R2), box plots of adjusted fold changes (Y-axis) of the sncRNAs are shown for subsequent comparisons. Left and center: Cells transfected with the pool of overexpressing vectors vs. cells transfected with the empty vector (the blank control). The cells were either treated (middle) or not treated (left) with Dox, while the blank control cells were not treated with Dox. Right: +Dox vs. −Dox treatments of cells transfected with the pools of overexpressing vectors. The adjusted fold change can range from 0 to 1, with 0.5 marked by the red dashed line representing no change. Values shifted toward 1 in the left and middle plots indicate overexpression compared to the blank controls. The number of sncRNAs which had RPKM >0 in the corresponding sample and used to generate each box plot is shown above.
Figure 6
Figure 6
High-throughput phenotypic screen of selected sncRNAs. (A) Composition of the selected 404 sncRNAs chosen for the phenotypic screen. (B) Schematics of the library preparation for the high-throughput phenotypic screen. A pool of the 404 lentiviral sncRNA inducible overexpression plasmids was used to generate lentiviral particles, which were then used to transduce K562 cells under the conditions that favor single viral integration event per cell. Two million stably transduced cells were selected by flow cytometry (FCM) and expanded to generate the starting cell library for the phenotypic screen. (C) Schematics of the growth survival assay. The starting cell library was subjected to culture in presence or absence of Dox for 60 days. Genomic DNA was isolated at days 16, 32, and 60 and used to quantify the sequences corresponding to each of the 404 sncRNA overexpression regions by NGS. (D) Results of the phenotypic screens. The functional sncRNAs were identified on the basis of depletion of the corresponding overexpression regions and could be subdivided into two categories. The “lost” sncRNAs were lost in both +Dox and −Dox samples after 16, 32, or 60 days of culture compared to the day 0 library. The “Dox-dependent” sncRNAs exhibited statistically significant loss in the +Dox samples compared to –Dox ones the after 16, 32, or 60 days of culture as estimated by the adjusted fold change, adjusted p-value, and average levels compared to the day 0 cultures (see Section 4 for details). (E) Odds ratios (Y-axes) of enrichment of the four groups of the original 404 sncRNAs—the positive control miRNAs and the unannotated sncRNAs that overlapped with introns, CDSs, or 3′ UTRs—among the functional sncRNAs in the “lost” and “Dox-dependent” categories at the different timepoints (X-axes). The red dashed horizontal line represents the odds ratio of 1 corresponding to no enrichment.
Figure 7
Figure 7
Comparison of expression levels of different groups of sncRNAs used in the phenotypic screen. Box plots of expression (log10 of RPKM, Y-axes) of the 404 sncRNAs chosen for the functional assay and stratified by representing the miRNAs positive controls vs. the unannotated sncRNAs and functional vs. nonfunctional status in the assay. The number of sncRNAs used to generate each box plot is shown above. Grey dots represent individual data points. The dashed line represents the boundary of low sncRNA abundance — RPKM of 1 (0 on the log-scale).

Similar articles

Cited by

References

    1. Kapranov P., Cawley S.E., Drenkow J., Bekiranov S., Strausberg R.L., Fodor S.P., Gingeras T.R. Large-scale transcriptional activity in chromosomes 21 and 22. Science. 2002;296:916–919. doi: 10.1126/science.1068597. - DOI - PubMed
    1. Okazaki Y., Furuno M., Kasukawa T., Adachi J., Bono H., Kondo S., Nikaido I., Osato N., Saito R., Suzuki H., et al. Analysis of the mouse transcriptome based on functional annotation of 60,770 full-length cDNAs. Nature. 2002;420:563–573. doi: 10.1038/nature01266. - DOI - PubMed
    1. Rinn J.L., Euskirchen G., Bertone P., Martone R., Luscombe N.M., Hartman S., Harrison P.M., Nelson F.K., Miller P., Gerstein M., et al. The transcriptional activity of human Chromosome 22. Genes Dev. 2003;17:529–540. doi: 10.1101/gad.1055203. - DOI - PMC - PubMed
    1. Bertone P., Stolc V., Royce T.E., Rozowsky J.S., Urban A.E., Zhu X., Rinn J.L., Tongprasit W., Samanta M., Weissman S., et al. Global identification of human transcribed sequences with genome tiling arrays. Science. 2004;306:2242–2246. doi: 10.1126/science.1103388. - DOI - PubMed
    1. Cheng J., Kapranov P., Drenkow J., Dike S., Brubaker S., Patel S., Long J., Stern D., Tammana H., Helt G., et al. Transcriptional maps of 10 human chromosomes at 5-nucleotide resolution. Science. 2005;308:1149–1154. doi: 10.1126/science.1108625. - DOI - PubMed