. 2023 Feb 20;24(4):4190.
doi: 10.3390/ijms24044190.

Genomic Survey of Flavin Monooxygenases in Wild and Cultivated Rice Provides Insight into Evolution and Functional Diversities

Affiliations

Genomic Survey of Flavin Monooxygenases in Wild and Cultivated Rice Provides Insight into Evolution and Functional Diversities

Yashika Gaba et al. Int J Mol Sci. .

Abstract

The flavin monooxygenase (FMO) enzyme was discovered in mammalian liver cells that convert a carcinogenic compound, N-N'-dimethylaniline, into a non-carcinogenic compound, N-oxide. Since then, many FMOs have been reported in animal systems for their primary role in the detoxification of xenobiotic compounds. In plants, this family has diverged to perform varied functions like pathogen defense, auxin biosynthesis, and S-oxygenation of compounds. Only a few members of this family, primarily those involved in auxin biosynthesis, have been functionally characterized in plant species. Thus, the present study aims to identify all the members of the FMO family in 10 different wild and cultivated Oryza species. Genome-wide analysis of the FMO family in different Oryza species reveals that each species has multiple FMO members in its genome and that this family is conserved throughout evolution. Taking clues from its role in pathogen defense and its possible function in ROS scavenging, we have also assessed the involvement of this family in abiotic stresses. A detailed in silico expression analysis of the FMO family in Oryza sativa subsp. japonica revealed that only a subset of genes responds to different abiotic stresses. This is supported by the experimental validation of a few selected genes using qRT-PCR in stress-sensitive Oryza sativa subsp. indica and stress-sensitive wild rice Oryza nivara. The identification and comprehensive in silico analysis of FMO genes from different Oryza species carried out in this study will serve as the foundation for further structural and functional studies of FMO genes in rice as well as other crop types.

Keywords: S-oxygenation; abiotic stress; auxin biosynthesis; flavin monooxygenase; pathogen defense; wild rice.


Conflict of interest statement

The authors declare no conflict of interest.

Figures

Figure 1
Figure 1
Chromosomal distribution of FMO genes in wild and cultivated rice. The distribution of the FMO genes on the twelve chromosomes of rice was determined using MapGene2Chromosome tool. The chromosome numbers are depicted on top of each chromosome. The position of each gene on the respective chromosome has been depicted in terms of megabase pairs by numbers beside each gene.
Figure 2
Figure 2
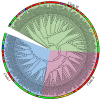
Evolutionary and sub-cellular localization analysis of FMO genes in wild and cultivated rice. A rooted circular phylogenetic tree, depicting evolutionary connection between the FMO encoding genes in wild and cultivated rice, was determined by maximum likelihood method with 1000 bootstrap replicates using MEGA 7.0 and visualised using iTOL. The subcellular localization of the genes has been indicated by a color strip around the tree. Red—cytoplasm, parrot green—chloroplast, dark green—endoplasmic reticulum, orange—plastid, blue—nucleus, cyan—vacuole, pink—golgi, peach—cytoskeleton, yellow—extracellular space. The branch lengths indicate the evolutionary time between the two nodes.
Figure 3
Figure 3
Schematic representation of the conserved FMO-identifying motifs in the FMO proteins in wild and cultivated rice. FMO-identifying motifs previously reported in literature were searched for in the FMO protein sequences of the cultivated Oryza sativa subsp. japonica and wild species, Oryza nivara. The motif sequences have been marked by colours representing each of the conserved motifs, bright green: FAD binding domain; red: GC motif, violet: FMO-identifying sequence; cyan: NADPH domain and light olive green: ATG-containing motif.
Figure 4
Figure 4
Protein motif analysis in FMO genes in wild and cultivated rice. Conserved motifs, in addition to the FMO-identifying motifs, were analyzed using the MEME suite. The sequences of all the analyzed motifs have been depicted in the box. The FMO protein motifs in the wild and cultivated rice have been represented in sets (A) 1–11 (B) 12–23 and (C) 24–30. Wild rice FMO orthologs have been grouped together in each set. Similar motif organization was observed in the different sets.
Figure 4
Figure 4
Protein motif analysis in FMO genes in wild and cultivated rice. Conserved motifs, in addition to the FMO-identifying motifs, were analyzed using the MEME suite. The sequences of all the analyzed motifs have been depicted in the box. The FMO protein motifs in the wild and cultivated rice have been represented in sets (A) 1–11 (B) 12–23 and (C) 24–30. Wild rice FMO orthologs have been grouped together in each set. Similar motif organization was observed in the different sets.
Figure 5
Figure 5
Gene architecture of the FMO gene family in cultivated and wild relatives of rice. The exon–intron arrangement of the FMO gene family from the different Oryza species, (A) 1–8, (B) 9–15, (C) 16–23 and (D) 24–30 was predicted using the Gene Structure Display Server 2.0. The length of UTR, exon, and intron has been depicted in proportion to the actual sizes, which is also indicated using a scale at the top, blue: 5′ UTR/3′ UTR region; red: CDS; solid line: intron. Different sets show conserved gene structures.
Figure 5
Figure 5
Gene architecture of the FMO gene family in cultivated and wild relatives of rice. The exon–intron arrangement of the FMO gene family from the different Oryza species, (A) 1–8, (B) 9–15, (C) 16–23 and (D) 24–30 was predicted using the Gene Structure Display Server 2.0. The length of UTR, exon, and intron has been depicted in proportion to the actual sizes, which is also indicated using a scale at the top, blue: 5′ UTR/3′ UTR region; red: CDS; solid line: intron. Different sets show conserved gene structures.
Figure 6
Figure 6
Schematic representation of the domain architecture of the FMO family of proteins in the cultivated and wild relatives of rice. The domain organization of the FMO members in different Oryza species was predicted by the SUPERFAMILY database. FAD; flavin adenine dinucleotide domain, NB; nucleotide-binding domain; retroviral domain. The length of the domains has been represented in proportion to their actual sizes and are not to scale. Domains connected by a red line mean they are split.
Figure 7
Figure 7
Spatial and stress-mediated expression profiling of different FMO genes cultivated variety O. sativa subsp. japonica. Expression data were retrieved from the publicly available Affymetrix as well as RNA-seq datasets from the Genevestigator for (A) different tissues during development and (B) under different abiotic stress conditions namely heat, salinity, cold, drought and submergence. All expression values with p value < 0.05 have been depicted in log2 fold change. The heatmaps have been generated using MeV software. The color scale below each heatmap shows the level of expression, with red color showing the highest expression and green showing the lowest expression.
Figure 8
Figure 8
Real-Time expression analysis of FMO genes in wild and cultivated rice. Expression profiling of selected FMO members from one month old leaves of (A) Oryza sativa subsp. indica (PB1 variety) and (B) Oryza nivara using qRT-PCR in response to heat stress (42 °C), salinity stress (200 mM NaCl) and drought stress (water withheld) for 24 h. Mean fold change (log2) is depicted, and the expression data is plotted against the untreated samples. The error bar represents the standard deviation where n = 6. *** signifies p value < 0.05 upto four or more decimal places and ** signifies p value < 0.05 for two decimal places.

Similar articles

Cited by

References

    1. Pettit F.H., Ziegler D.M. The catalytic demethylation of N, N-dimethylaniline-N-oxide by liver microsomes. Biochem. Biophys. Res. Commun. 1963;13:193–197. doi: 10.1016/0006-291X(63)90280-8. - DOI - PubMed
    1. Bickel M.H. The pharmacology and biochemistry of N-oxides. Pharmacol. Rev. 1969;21:325–355. - PubMed
    1. Jakoby W.B., Ziegler D.M. The enzymes of detoxication. J. Biol. Chem. 1990;265:20715–20718. doi: 10.1016/S0021-9258(17)45272-0. - DOI - PubMed
    1. Huijbers M.M.E., Montersino S., Westphal A.H., Tischler D., Van-Berkel W.J.H. Flavin dependent monooxygenases. Arch. Biochem. Biophys. 2014;544:2–17. doi: 10.1016/j.abb.2013.12.005. - DOI - PubMed
    1. Mascotti M.L., Lapadula W.J., Ayub M.J. The origin and evolution of Baeyer—Villiger Monooxygenases (BVMOs): An ancestral family of flavin monooxygenases. PLoS ONE. 2015;10:e0132689. doi: 10.1371/journal.pone.0132689. - DOI - PMC - PubMed

Substances

LinkOut - more resources