. 2023 Feb 20;24(4):4194.
doi: 10.3390/ijms24044194.

Transcriptomic and Proteomic Analyses of Celery Cytoplasmic Male Sterile Line and Its Maintainer Line

Affiliations

Transcriptomic and Proteomic Analyses of Celery Cytoplasmic Male Sterile Line and Its Maintainer Line

Haoran Wang et al. Int J Mol Sci. .

Abstract

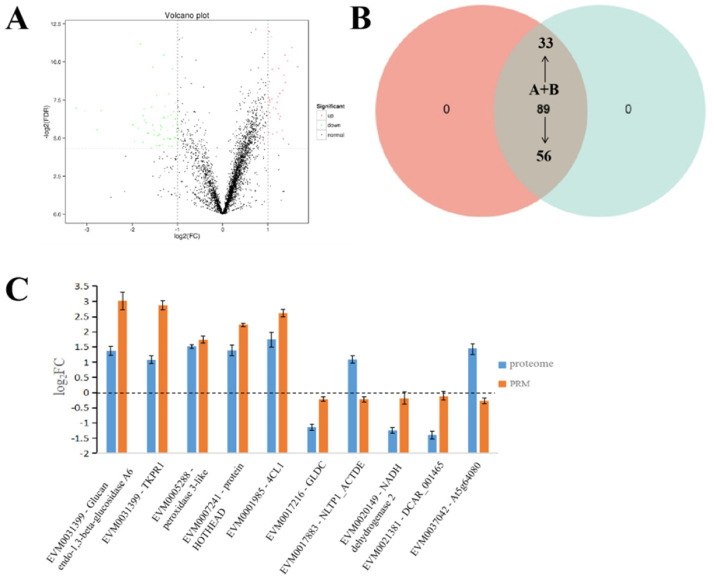
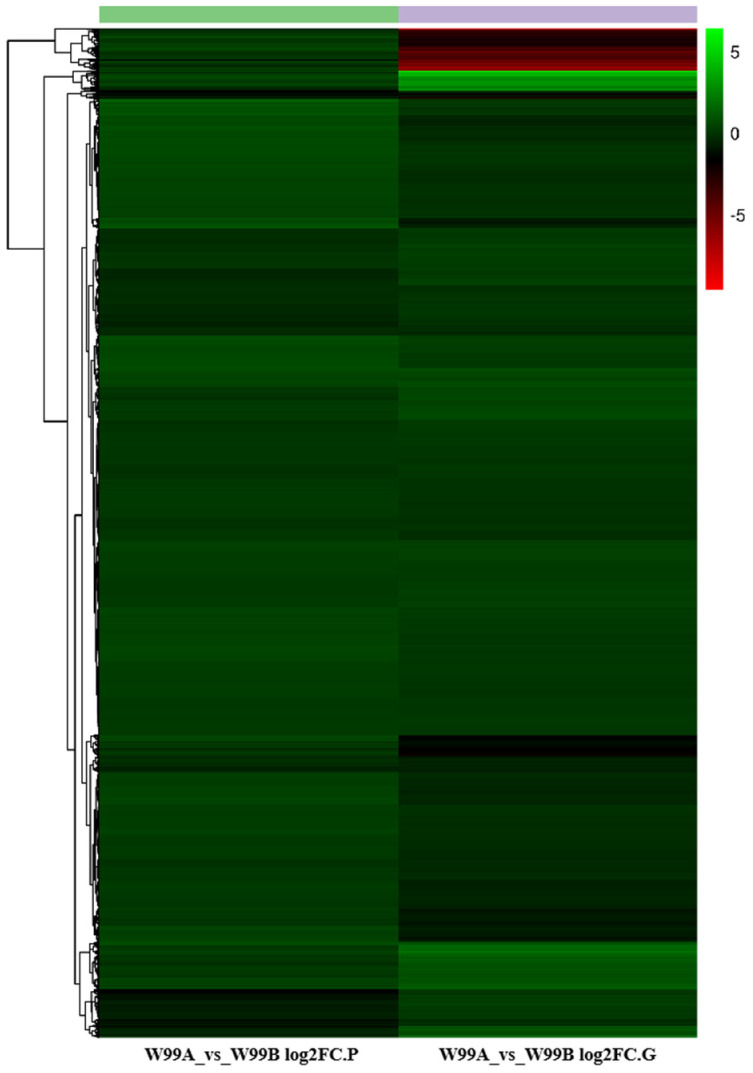
Male sterility is a common phenomenon in the plant kingdom and based on the organelles harboring the male-sterility genes, it can be classified into the genic male sterility (GMS) and the cytoplasmic male sterility (CMS). In every generation, CMS can generate 100% male-sterile population, which is very important for the breeders to take advantage of the heterosis and for the seed producers to guarantee the seed purity. Celery is a cross-pollinated plant with the compound umbel type of inflorescence which carries hundreds of small flowers. These characteristics make CMS the only option to produce the commercial hybrid celery seeds. In this study, transcriptomic and proteomic analyses were performed to identify genes and proteins that are associated with celery CMS. A total of 1255 differentially expressed genes (DEGs) and 89 differentially expressed proteins (DEPs) were identified between the CMS and its maintainer line, then 25 genes were found to differentially expressed at both the transcript and protein levels. Ten DEGs involved in the fleece layer and outer pollen wall development were identified by Gene Ontology (GO) and Kyoto Encyclopedia of Genes and Genomes (KEGG) analyses, most of which were down-regulated in the sterile line W99A. These DEGs and DEPs were mainly enriched in the pathways of "phenylpropanoid/sporopollenin synthesis/metabolism", "energy metabolism", "redox enzyme activity" and "redox processes". Results obtained in this study laid a foundation for the future investigation of mechanisms of pollen development as well as the reasons for the CMS in celery.

Keywords: celery; cytoplasmic male sterility; proteomic analysis; transcriptomic analysis.


Conflict of interest statement

The authors declare no conflict of interest.

Figures

Figure 1
Figure 1
Anthesis flowers and pollen staining of the CMS and maintainer lines. (A) Flower of maintainer line W99B, scale = 4 cm; (B) flowers of sterile line W99A, scale = 4 cm; (C,D) pollen staining using Alexander’s dye, scale = 100 µm.
Figure 2
Figure 2
Differentially expressed gene profiles obtained from the transcriptomic analyses. (A) Volcano map of up- and down-regulated genes between the male sterile W99A and the male fertile line W99B; (B) comparison of differentially expressed genes (DEGs) identified in the sterile W99A and the fertile line W99B; (C) DEGs selected from transcriptome was verified by RT-PCR, and the material was W99A. Buds in tetrad stage were selected, and each sample was repeated three times.
Figure 3
Figure 3
Differentially expressed protein profiles obtained from the proteomic analyses. (A) Volcano map of up- and down-regulated proteins between the male sterile W99A and the male fertile line W99B; (B) comparison of differentially expressed proteins (DEPs) identified in the sterile W99A and the fertile line W99B; (C) DEPs selected from proteomics was verified by PRM, and the material was W99B. Buds in tetrad stage were selected, and each sample was repeated three times.
Figure 4
Figure 4
Differentially expressed gene/protein profiles obtained from transcriptomic and proteomic analyses. (A) Scatterplots of the relationship between genes quantified in both transcriptome and proteome analysis; (B) Comparison of all the proteins and genes identified in the sterile W99A and the fertile line W99B; (C) Comparison of all the DEGs and DEPs identified in the sterile W99A and the fertile line W99B. Quadrants 1 and 9 indicate opposite protein and mRNA expression trends; quadrants 3 and 7 indicate the same protein and mRNA expression trends; quadrants 2 and 8 indicate no change in protein and differential mRNA expression; quadrants 4 and 6 indicate no change in mRNA and differential protein expression. Orange circle represents DEGs detected by transcriptomics, and green circle represents DEPs detected by protein omics.
Figure 5
Figure 5
Clustering maps of proteomic and transcriptomic expression patterns. The columns of the graph represent differential groupings of proteins or genes (proteins with .P suffix on the left and genes with .G suffix on the right), and the rows represent log2FC values of proteins or genes, where genes and proteins in the same row of the same differential grouping are correlated. See Table S12 for the expression of DEGs/DEPs in different omics in cluster analysis.
Figure 6
Figure 6
Gene ontology (GO) enrichment analysis of co-DEGs-DEPs genes. (A) GO annotation results for genes with opposite protein and mRNA expression trends; (B) GO annotation results for proteins with opposite protein and mRNA expression trends; (C) GO annotation results for genes with identical protein and mRNA expression trends; (D) GO annotation results for proteins with the same protein and mRNA expression trends. In the figure, each circle represents a GOTerm, the ordinate represents the name of GO, and the abscissa represents the Enrichment Factor. The greater the enrichment factor, the more significant the enrichment level of differentially expressed genes in this pathway. The color of the circle represents qvalue, and qvalue is Pvalue after multiple hypothesis testing and correction. The smaller the qvalue is, the more reliable the enrichment significance of differentially expressed genes or proteins in this pathway is. The size of the circle indicates the number of genes or proteins enriched in the pathway. The larger the circle, the more genes there are.
Figure 7
Figure 7
Kyoto Encyclopedia of Genes and Genomes (KEGG) enrichment analysis of co-DEGs-DEPs genes. (A) GO annotation results for genes with opposite protein and mRNA expression trends; (B) KEGG enrichment information for proteins with opposite trends in protein and mRNA expression; (C) KEGG enrichment information of genes with the same protein and mRNA expression trends; (D) KEGG enrichment information for proteins with the same trend of protein and mRNA expression.
Figure 8
Figure 8
Detection and analysis results of biochemical indexes of W99A and W99B. (AD) show proline content, MDA content, hydrogen peroxide content and the rate of superoxide anion production. (EG) show SOD activity, CAT activity, and POD activity, respectively. “*” and “**” represent significant levels of difference at p < 0.05 and p < 0.01, respectively. Mean ± standard deviation, repeated three times.
Figure 9
Figure 9
Genes involved in pollen development in DEGs and their expression analysis in protein omics. (A) shows the expression of selected related genes in W99A and W99B transcriptome data, followed by “-” and designation of homologous gene in Arabidopsis after sequence alignment; (B) shows the expression of these genes in protein group.

References

    1. Cheng Q., Wang P., Li T., Liu J., Zhang Y., Wang Y., Sun L., Shen H. Apium graveolensComplete Mitochondrial Genome Sequence and Identification of a Candidate Gene Responsible for Cytoplasmic Male Sterility in Celery (L.) Int. J. Mol. Sci. 2021;22:8584. doi: 10.3390/ijms22168584. - DOI - PMC - PubMed
    1. Chen L., Liu Y.G. Male Sterility and Fertility Restoration in Crops. Annu. Rev. Plant Biol. 2013;65:579–606. doi: 10.1146/annurev-arplant-050213-040119. - DOI - PubMed
    1. Afjani J.A., Najafabadi M.S., Mirfakhraei R.G. Gene-Based Marker to Differentiate Among B, A, and R Lines in Hybrid Production of Rapeseed Ogura System. Iran. J. Biotechnol. 2019;17:e1870. - PMC - PubMed
    1. Liu H., Cui P., Zhan K., Lin Q., Zhuo G., Guo X., Ding F., Yang W., Liu D., Hu S., et al. Comparative analysis of mitochondrial genomes between a wheat K-type cytoplasmic male sterility (CMS) line and its maintainer line. BMC Genom. 2011;12:163. doi: 10.1186/1471-2164-12-163. - DOI - PMC - PubMed
    1. Schnable P.S., Wise R.P. The molecular basis of cytoplasmic male sterility and fertility restoration. Trends Plant Sci. 1998;3:175–180. doi: 10.1016/S1360-1385(98)01235-7. - DOI