. 2023 Feb 20;24(4):4204.
doi: 10.3390/ijms24044204.

Nicotine-Mediated Recruitment of GABAergic Neurons to a Dopaminergic Phenotype Attenuates Motor Deficits in an Alpha-Synuclein Parkinson's Model

Affiliations

Nicotine-Mediated Recruitment of GABAergic Neurons to a Dopaminergic Phenotype Attenuates Motor Deficits in an Alpha-Synuclein Parkinson's Model

Jessica IChi Lai et al. Int J Mol Sci. .

Abstract

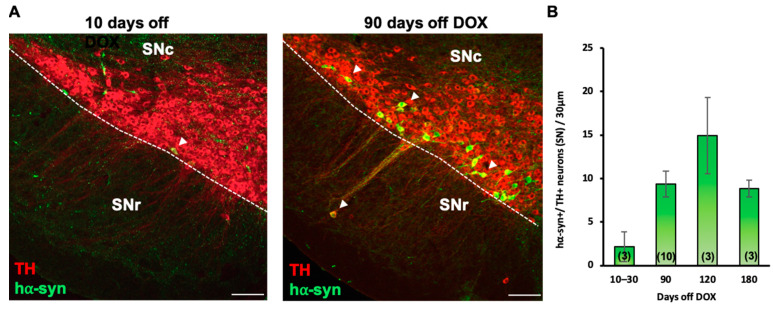
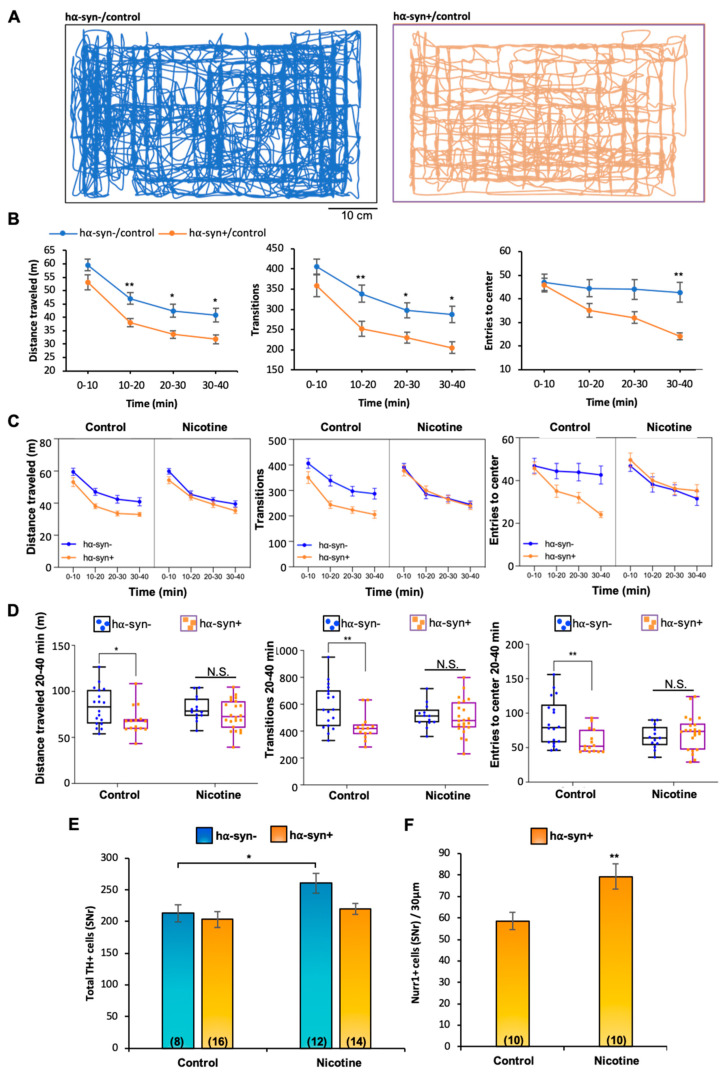
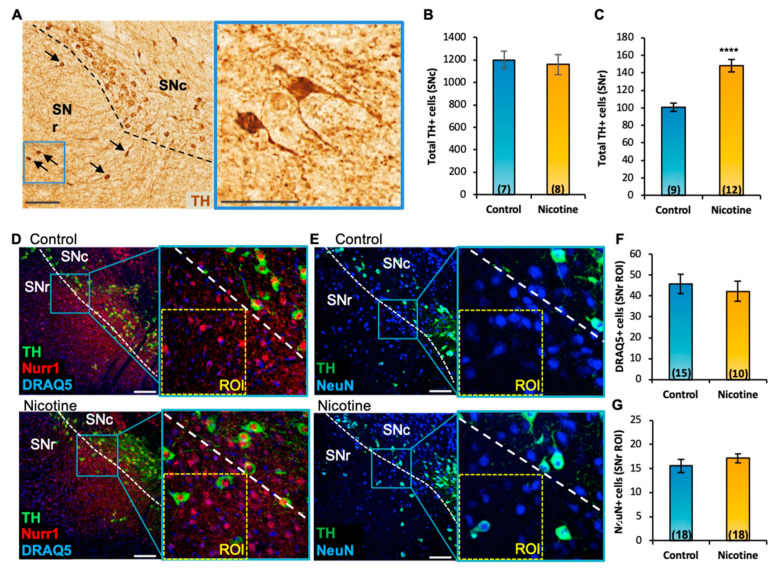
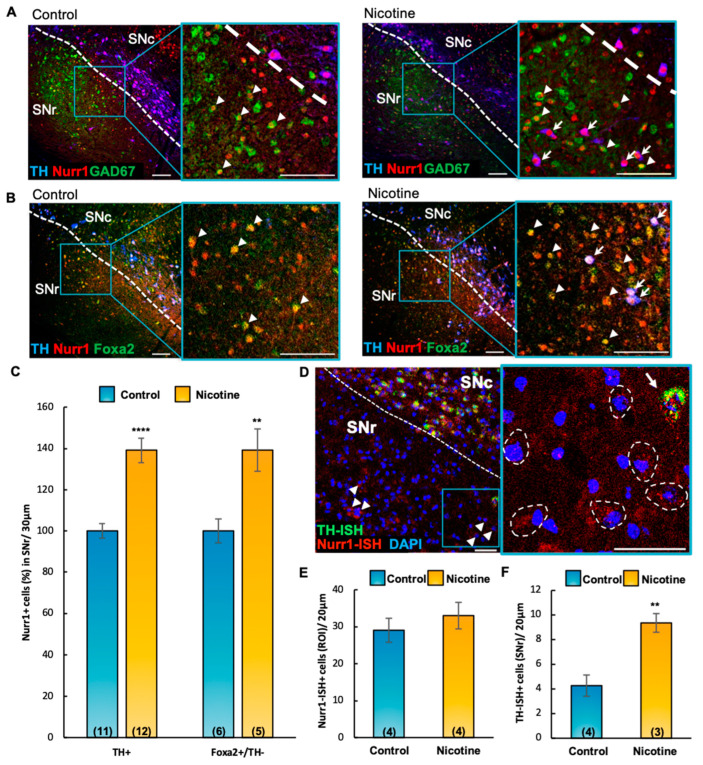
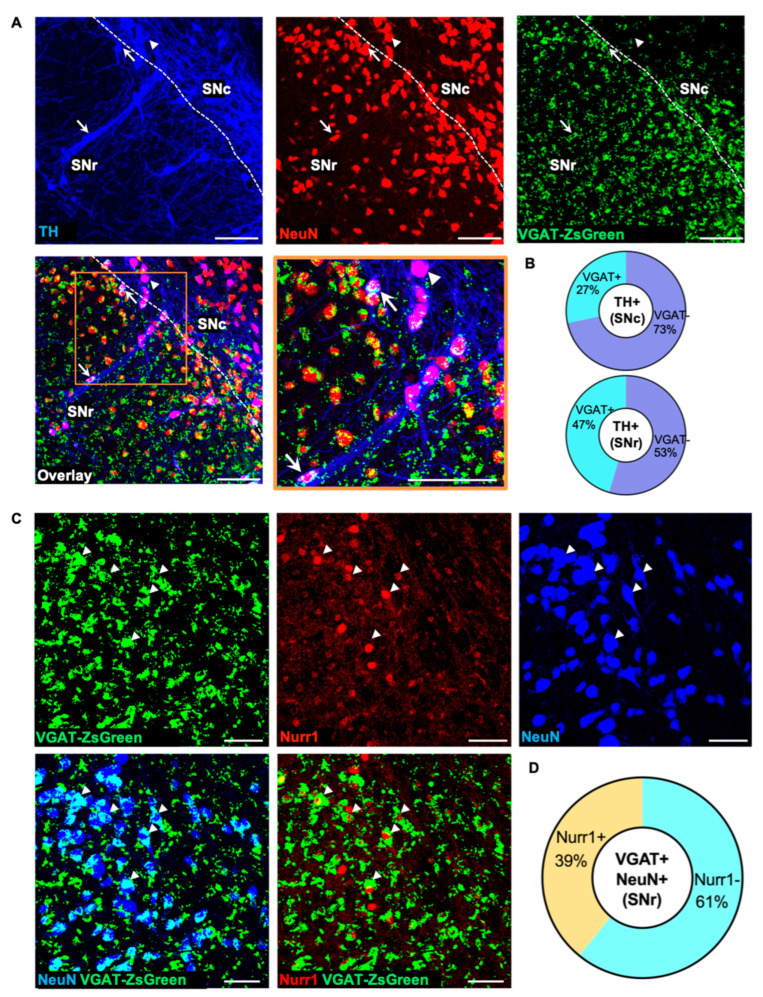
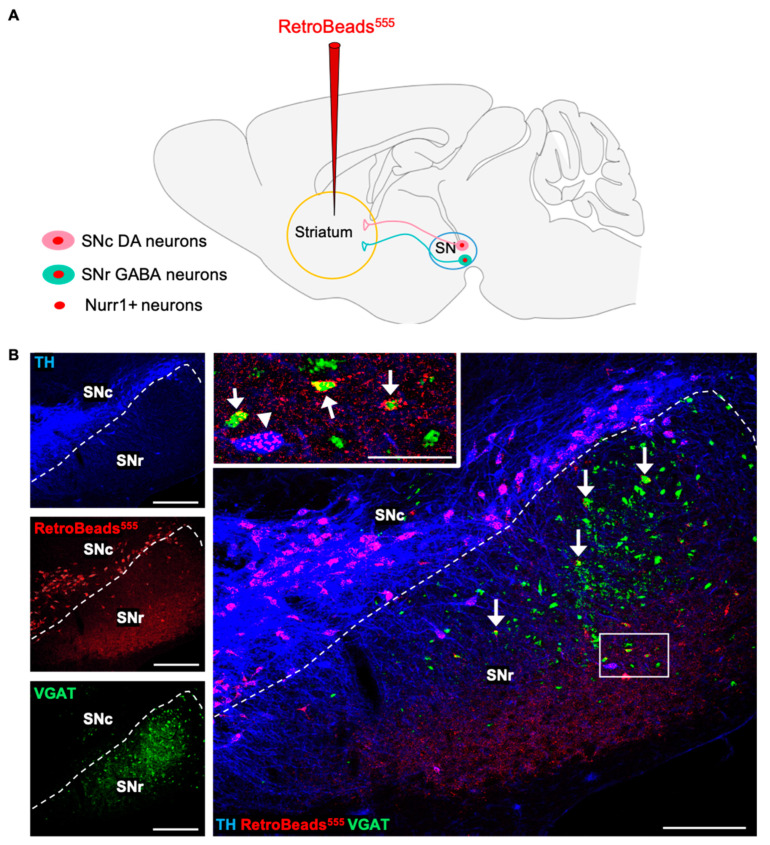
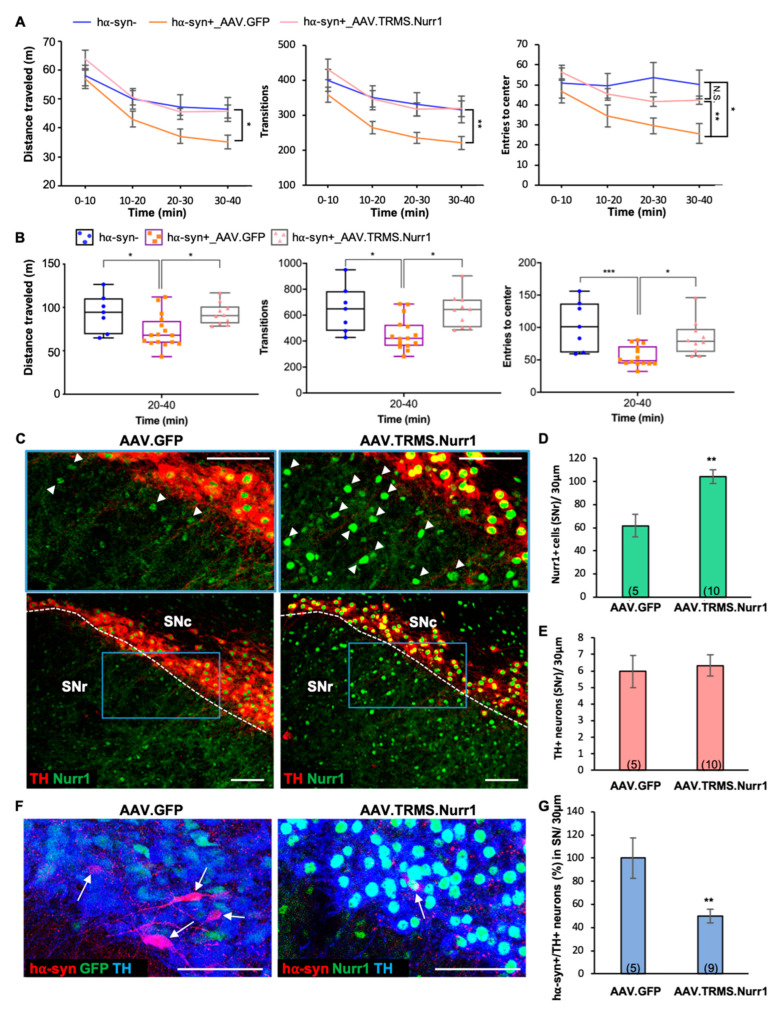
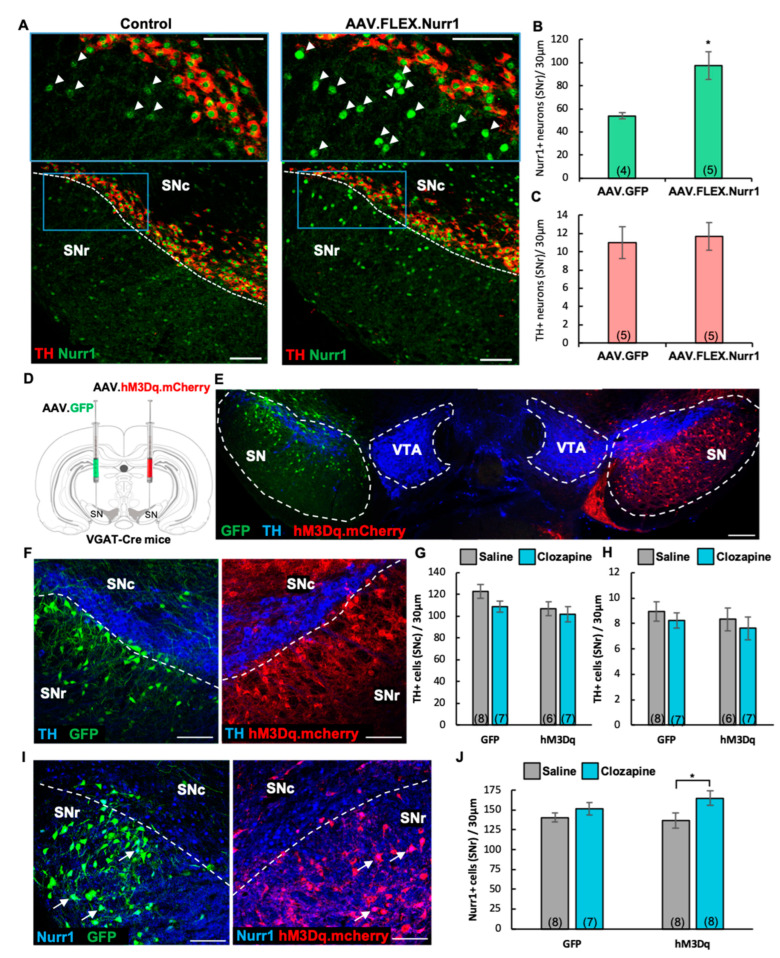
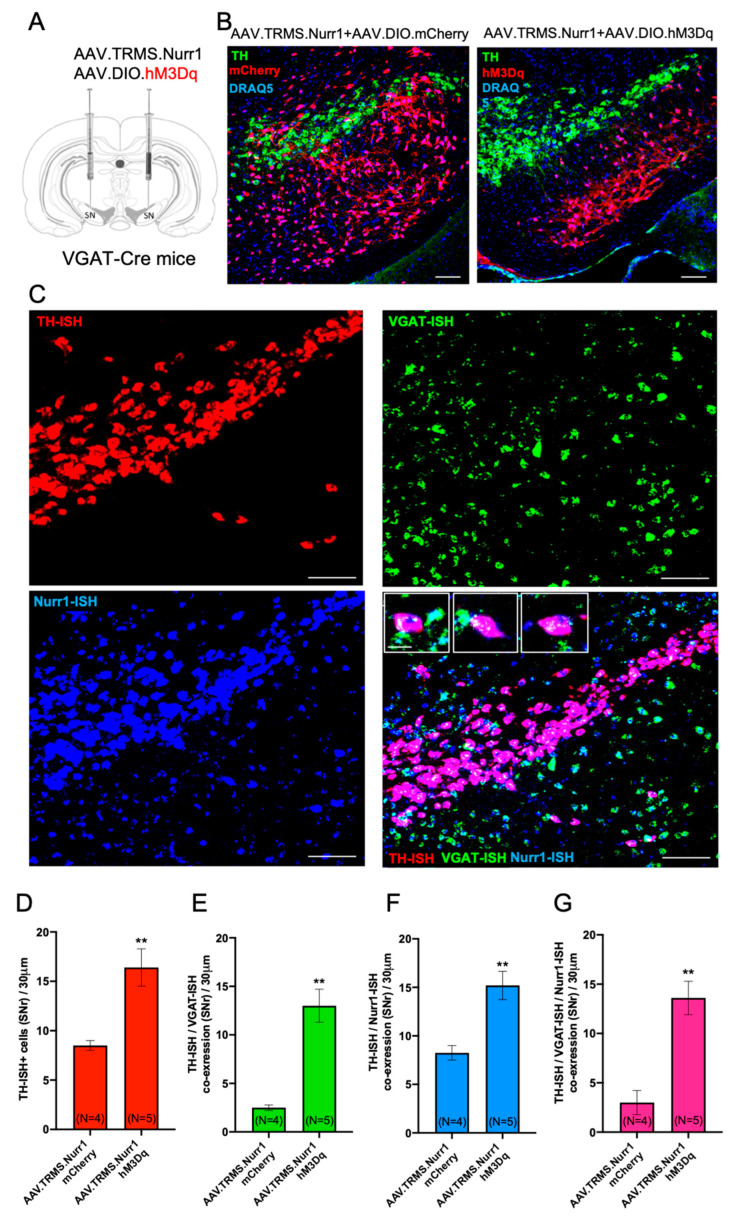
Previous work revealed an inverse correlation between tobacco smoking and Parkinson's disease (PD) that is associated with nicotine-induced neuroprotection of dopaminergic (DA) neurons against nigrostriatal damage in PD primates and rodent models. Nicotine, a neuroactive component of tobacco, can directly alter the activity of midbrain DA neurons and induce non-DA neurons in the substantia nigra (SN) to acquire a DA phenotype. Here, we investigated the recruitment mechanism of nigrostriatal GABAergic neurons to express DA phenotypes, such as transcription factor Nurr1 and DA-synthesizing enzyme tyrosine hydroxylase (TH), and the concomitant effects on motor function. Wild-type and α-syn-overexpressing (PD) mice treated with chronic nicotine were assessed by behavioral pattern monitor (BPM) and immunohistochemistry/in situ hybridization to measure behavior and the translational/transcriptional regulation of neurotransmitter phenotype following selective Nurr1 overexpression or DREADD-mediated chemogenetic activation. We found that nicotine treatment led to a transcriptional TH and translational Nurr1 upregulation within a pool of SN GABAergic neurons in wild-type animals. In PD mice, nicotine increased Nurr1 expression, reduced the number of α-syn-expressing neurons, and simultaneously rescued motor deficits. Hyperactivation of GABA neurons alone was sufficient to elicit de novo translational upregulation of Nurr1. Retrograde labeling revealed that a fraction of these GABAergic neurons projects to the dorsal striatum. Finally, concomitant depolarization and Nurr1 overexpression within GABA neurons were sufficient to mimic nicotine-mediated dopamine plasticity. Revealing the mechanism of nicotine-induced DA plasticity protecting SN neurons against nigrostriatal damage could contribute to developing new strategies for neurotransmitter replacement in PD.

Keywords: alpha-synuclein; dopamine; neurotransmitter-switching; nicotine; substantia nigra; tyrosine-hydroxylase.


Conflict of interest statement

All authors declare no conflict of interest.

Figures

Figure 1
Figure 1
Inducible human A53T alpha synuclein accumulates over time. (A) Confocal images of coronal section (30 μm) through the substantia nigra compacta (SNc) and reticulata (SNr) of the PITX3-IRES2-tTA/tetO-A53T double-transgenic mice showing a substantial increase of hα-syn expression after 90 days off doxycycline (DOX) when compared to 10 days off DOX. Colocalization shows that hα-syn was selectively expressed in the TH+ cells (arrowheads) in the SN. Scale bars = 100 μm. (B) Quantification of neurons displaying hα-syn /TH colocalization shows a 2-fold increase in hα-syn expression after 90 days off DOX and a 3-fold increase after 120 days. The expression after 180 days off DOX was comparable to 90 days off DOX. Graphs show mean ± SEM. The number of animals is annotated in parentheses for each condition.
Figure 2
Figure 2
Chronic nicotine exposure attenuates locomotor deficits and increases SNr Nurr1 expression in Pitx3-A53T transgenic mice. (A) Spatial patterns of locomotion analyzed with the Behavior Pattern Monitor (BPM) within 10 min duration of the testing session exhibited by nicotine-untreated (control) Pitx3-A53T transgenic (hα-syn+, right) and a hα-syn- (left) mice. (B) Locomotion measures from 0 to 40 min of the BPM testing session show that hα-syn+/control mice displayed significant locomotor deficits, including distance traveled (two-way ANOVA, main effect of hα-syn: F(1,30) = 8.463, p < 0.01, Bonferroni’s Multiple Comparisons: hα-syn-/control vs hα-syn+/control at 10–20 min: p < 0.01, 20–30 min: p < 0.05, 30–40: p < 0.05), number of transitions across different regions of the chamber (F, two-way ANOVA, main effect of hα-syn: F(1,31) = 8.143, p < 0.01, Bonferroni’s Multiple Comparisons: hα-syn-/control vs hα-syn+/control at 10–20 min: p < 0.01, 20–30 min: p < 0.05, 30–40 min: p < 0.05), and entries to the center of the chamber (two-way ANOVA, time x hα-syn interaction: F(3,91) = 3.266, p < 0.05, main effect of hα-syn: F(1,32) = 6.114, p < 0.05, Bonferroni’s Multiple Comparisons: hα-syn-/control vs hα-syn+/control at 30–40 min: p < 0.01). Every measure shows a main effect of time, p < 0.0001. Graphs show mean ± SEM: * p < 0.05, ** p < 0.01. (C,D) Chronic nicotine exposure attenuated locomotor deficits as no significant differences in these measures were observed between nicotine-exposed hα-syn- and hα-syn+ groups. (C) Mixed model ANOVA analyzing the effects of hα-syn, nicotine across the 40 min session on distance traveled: main effect of hα-syn, F(1,64) = 9.380, p < 0.01; transitions: hα-syn x nicotine interaction, F(1,63) = 5.287, p < 0.05, main effect of hα-syn: F(1,63) = 5.841, p < 0.05; entries to center: hα-syn x nicotine interaction, F(1,66) = 4.842, p < 0.05. Every measure shows a main effect of time, p < 0.0001. (D) Two-way ANOVA performed on the 20-to-40 min interval, distance traveled: main effect of hα-syn, F(1,65) = 6.930, p < 0.05, Bonferroni’s Multiple Comparisons: hα-syn-/control vs hα-syn+/control, p < 0.05; transitions: hα-syn x nicotine interaction, F(1,63) = 5.121, p < 0.05, main effect of hα-syn, F(1,63) = 6.593, p < 0.05, Bonferroni’s Multiple Comparisons: hα-syn-/control vs hα-syn+/control p < 0.01; entries to center: hα-syn x nicotine interaction, F(1,64) = 7.739, p < 0.01, Bonferroni’s Multiple Comparisons: hα-syn-/control vs. hα-syn+/control p < 0.01. Graphs show all data points with medians and interquartile range. * p < 0.05, ** p < 0.01, N.S., not significant. The number of animals (males and females) for each group is: hα-syn-/control (N = 18), hα-syn-/nicotine (N = 14), hα-syn+/control (N = 17), and hα-syn+/nicotine (N = 22). (E) Stereological quantification revealed that chronic nicotine exposure increased the number of TH+ neurons in hα-syn- but not hα-syn+ mice (t(18) = 2.18, p < 0.05). Graph shows mean ± SEM: * p < 0.05. (F) Chronic nicotine exposure increased the number of Nurr1+ cells in the SNr of hα-syn+ mice (t(18) = 2.91, p < 0.01). Graph shows mean ± SEM: ** p < 0.01. The number of animals is annotated in parentheses for each condition.
Figure 3
Figure 3
Chronic nicotine exposure increases the number of TH+ cells in the SNr without affecting the number of DRAQ5+ and NeuN+ cells. (A) Representative SN section of wild-type mice displaying DAB immunoreactivity for TH after chronic nicotine exposure. Arrows indicate TH+ neurons in the SNr. Scale bars = 150 μm; inset, 75 μm. (B,C) DAB stereological quantification showed that chronic nicotine exposure did not change the number of TH+ cells in the SNc (B) but increased the number of TH+ cells in the SNr ((C), t(19) = 5.01, p < 0.0001). Graphs show mean ± SEM: **** p < 0.0001. (D,E) Confocal images showing TH, Nurr1, DRAQ5 (D), and NeuN (E) immunofluorescence in the SN of control and nicotine-exposed mice. (F,G) Quantification (SNr ROI) of IHC preparations shown in (D,E) revealed no change in the numbers of DRAQ5+ (F) and NeuN+ (G) cells. Graph shows mean ± SEM. The number of animals is annotated in parentheses for each condition. Scale bars = 150 μm. ROI = 150 μm × 150 μm. ROI, Region of Interest; SNc and SNr, substantia nigra compacta and reticulata.
Figure 4
Figure 4
Chronic nicotine exposure increases Nurr1 expression via translational upregulation and induces de novo transcription of TH in non-DAergic cells. (A,B) Confocal images of coronal sections (30 μm) through the SN of control (left panels) and nicotine-exposed (right panels) mice, labeled with TH, Nurr1, GAD67-GFP, and Foxa2 markers. Insets display immunoreactive TH-/Nurr1+/GAD67+ ((A), arrowheads), TH-/Nurr1+/Foxa2+ ((B), arrowheads) cells in the SNr. Scale bars = 100 μm. (C) Quantification (%) of IHC preparations shown in (A,B) indicated that chronic nicotine exposure in adult (P60) mice increased the number of TH+/Nurr1+ (t(21) = 5.51, p < 0.0001) and TH-/Foxa2+/Nurr1+ (t(9) = 3.50, p < 0.01) cells in the SNr (arrows in A,B). Graph shows mean ± SEM: ** p < 0.01, **** p < 0.0001. (D) Confocal image of Nurr1/TH in situ hybridization (ISH) of a representative coronal section (20 μm) through the SN of nicotine-exposed adult (P150) mice. DAPI was used to label nuclei. Non-DAergic (TH-ISH negative) Nurr1-ISH+ cells (arrowheads, dashed contours in inset) and TH-ISH+/Nurr1-ISH+ cell (arrow) are observed in the SNr. Scale bars = 50 μm. (E,F) Quantification of ISH preparations shown in D (ROI, 200 μm × 200 μm) revealed no difference in the number of Nurr1-ISH+ cells between control and nicotine-exposed groups (E). Chronic nicotine exposure increased the number of TH-ISH+ cells ((F), t(5) = 4.06, p < 0.01). Graphs show mean ± SEM: ** p < 0.01. The number of animals is annotated in parentheses for each condition. ROI, Region of Interest; SNc and SNr, substantia nigra compacta and reticulata. Graphs show mean ± SEM: ** p < 0.01. The number of animals is annotated in parentheses for each condition.
Figure 5
Figure 5
GABAergic neurons expressing Nurr1 in the SNr revealed a reserve pool recruitable to acquire a DAergic phenotype. (A) Representative confocal images of the SN of adult (P60) vesicular GABA transporter (VGAT)-ZsGreen mice display the distribution of TH+/VGAT+ (arrow) and TH+/VGAT- (arrowhead) neurons. Scale bars = 100 μm. (B) Quantification of IHC preparations shown in A indicate that 26.7 ± 3.9 % of SNc TH+ neurons and 46.8 ± 4.3% of SNr TH+ neurons express VGAT. (C) Confocal images of representative SNr sections show VGAT+/Nurr1+/NeuN+ colocalization (arrowheads). Scale bars = 100 μm. (D) Quantification of IHC preparations shown in C indicate that 38.8 ± 2.2 % of SNr VGAT+ neurons express Nurr1.
Figure 6
Figure 6
Retrograde tracing revealed the pool of SNr GABAergic neurons projecting to the striatum. (A) Schematic diagram illustrating retrograde tracing with RetroBeads (555 nm) injected in the striatum and transported from the neuronal terminals in the striatum back to their somata in the SN. (B) Confocal images of representative coronal sections through the SN of adult (P60) VGAT-ZsGreen mice. Inset (white box) shows RetroBeads detected in the somata of both TH+ (arrowhead) and VGAT+ (arrows) neurons in the SNr, revealing the connectivity of GABAergic SNr-to-striatum projection neurons. Scale bars = 200 μm, 50 μm (inset).
Figure 7
Figure 7
Nurr1 overexpression is sufficient to ameliorate PD-related locomotor deficits and decreases the number of hα-syn+ neurons in the SNc. (A) Locomotor activity (BPM) measured from 0 to 40 min of the testing session showed that pan-neuronal Nurr1-overexpression ameliorated PD-related locomotor deficits exhibited by hα-syn+_AAV.GFP mice (mixed model ANOVA for distance traveled: time x group interaction, F(6,85) = 2.258, p < 0.05, main effect of group, F(2,30) = 3.848, p < 0.05, Bonferroni’s Multiple Comparisons: hα-syn+_AAV.GFP vs. hα-syn+_AAV.Nurr1 p < 0.05 at 20–30 min and 30–40 min; transitions: main effect of group: F(2,29) = 5.209, p < 0.05, Bonferroni’s Multiple Comparisons: hα-syn+_AAV.GFP vs hα-syn+_AAV.Nurr1 p < 0.05 at 10–20, 20–30 min, and p < 0.01 at 30–40 min; entries to center: time x group interaction, F(6,88) = 4.176, p < 0.001, Bonferroni’s Multiple Comparisons: hα-syn+_AAV.GFP vs hα-syn- p < 0.05, vs hα-syn+_AAV.Nurr1 p < 0.01 at 30–40 min). Every measure shows a main effect of time, p < 0.0001. Graphs show mean ± SEM: * p < 0.05, ** p < 0.01, N.S., not significant. The number of animals for each group is: hα-syn- (N = 7), hα-syn+_AAV.GFP (N = 17), hα-syn+_AAV.Nurr1 (N = 10). (B) Locomotor measures (distance traveled, transitions, and entries to center) plotted for 20-to-40 min interval of the BPM testing session shown in A revealed a significant AAV.Nurr1-mediated rescue of the behavioral deficits displayed by hα-syn+_AAV.GFP mice. One-way ANOVA for distance traveled: F(2,30) = 5.445, p < 0.01, Bonferroni’s Multiple Comparisons: hα-syn+_AAV.GFP vs hα-syn- p < 0.05, vs hα-syn+_AAV.Nurr1 p < 0.05; transitions: F(2,29) = 6.833, p < 0.01, Bonferroni’s Multiple Comparisons: hα-syn+_AAV.GFP vs hα-syn- p < 0.05, vs hα-syn+_AAV.Nurr1 p < 0.05; entries to center: F(2,28) = 9.293, p < 0.001, Bonferroni’s Multiple Comparisons: hα-syn+_AAV.GFP vs hα-syn- p < 0.001, vs hα-syn+_AAV.Nurr1 p < 0.05). Graphs show all data points with medians and interquartile range. * p < 0.05, *** p < 0.001. (C) Confocal images of representative SN sections indicating enhanced Nurr1-immunoreactive cell bodies (arrowheads) shown at higher magnification (insets, blue box) in mice injected with pan-neuronal Nurr1 viral vector (AAV5.TRMS.Nurr1) compared to mice injected with AAV.GFP (AAV5.TRMS.GFP). Scale bars = 100 μm. (D,E) Quantification of IHC preparations in (C) showed that AAV.TRMS.Nurr1 injection increased the number of Nurr1+ cells in the SNr ((D), t(13) = 3.86, p < 0.01) but was not sufficient to lead to an increase in TH expression in the SNr (E). Graphs show mean ± SEM: ** p < 0.01. The number of animals is annotated in parentheses for each condition. (F) Confocal images of representative SN sections showing hα-syn+/TH+ neurons (arrows) in AAV.GFP- and AAV.TRMS.Nurr1-injected mice. Scale bars = 50 μm. (G) Quantification (%) of IHC preparations shown in (F) indicates that AAV.TRMS.Nurr1 injection decreased the number of hα-syn+/TH+ neurons in the SN (t(12) = 3.33, p < 0.01). Graphs show mean ± SEM: ** p < 0.01. The number of animals is annotated in parentheses for each condition.
Figure 8
Figure 8
Selective Nurr1 overexpression does not elicit a TH phenotype while chronic activation of GABAergic cells is sufficient to induce Nurr1. (A) Confocal images of representative SN sections indicating enhanced Nurr1 immunoreactivity (arrowheads) shown at higher magnification (insets, blue box) on the side of the brain injected with Cre-dependent AAV Nurr1 miRNA (AAV.FLEX.Nurr1), when compared to the contralateral uninjected side (control). Scale bars = 200 μm. (B,C) Quantification of IHC preparations shown in A indicates that AAV.FLEX.Nurr1 injection increased the number of Nurr1+ cells in the SNr ((B), t(7) = 2.96, p < 0.05) but was not sufficient to lead to an increase in TH expression in the SNr (C). Graphs show mean ± SEM: * p < 0.05. The number of animals is annotated in parentheses for each condition. (D) Schematic representation of the viral strategy adopted to chemogenetically activate VGAT+ neurons of the SN of VGAT-Cre mice by unilaterally injecting a Cre-dependent DREADD (hM3Dq).mCherry AAV and transfecting the contralateral side with a Cre-dependent AAV.GFP reporter (control). (E) Composite image of a representative section (30 μm) through the SN and VTA showing selective expression of Cre-dependent mCherry-tagged excitatory DREADD (hM3Dq) virus within the SN GABAergic neurons on the right side and Cre-dependent GFP virus transfected on the left side of a VGAT-Cre mouse brain, along with TH immunofluorescent staining. Scale bars = 200 μm. (F,I) Confocal images of representative SN sections showing TH (F) and Nurr1 (I, arrows) immunoreactivity along with GFP and hM3Dq.mCherry labeling. Scale bars = 100 μm. (G,H) Quantification of TH+ neurons of IHC preparations shown in (F) (SNc, two-way ANOVA, main effect of hM3Dq, F(1,43) = 4.49, p < 0.05; SNr, unaffected by chemogenetic activation of VGAT+ neurons). Graphs show mean ± SEM. The number of animals is annotated in parentheses for each condition. (J) Quantification of IHC preparations shown in (I) revealed that DREADD (hM3Dq)-mediated activation of GABAergic cells induced an increase in Nurr1 expression (two-way ANOVA, main effect of clozapine, F(1,14) = 5.325, p < 0.05, Bonferroni’s Multiple Comparisons: hM3Dq/saline vs hM3Dq/clozapine, p < 0.05). Graph shows mean ± SEM: * p < 0.05. The number of animals is annotated in parentheses for each condition.
Figure 9
Figure 9
Effect of concomitant chemogenetic activation of SN GABAergic neurons and Nurr1 upregulation on TH phenotype. (A) Schematic representation of the viral strategy adopted to chemogenetically activate VGAT+ neurons and overexpress Nurr1 in the SN of VGAT-Cre mice by bilaterally injecting a Cre-dependent DREADD (hM3Dq).mCherry AAV and pan-neuronal Nurr1 viral vector (AAV5.TRMS.Nurr1). (B) Confocal images of representative SN sections (30 μm) showing selective expression of Cre-dependent mCherry (left) and excitatory DREADD (hM3Dq) (right) virus within the SN GABAergic neurons, along with TH immunofluorescent staining and nuclear staining DRAQ5. Scale bars = 100 μm. (C) Confocal image of TH (red), VGAT (green), Nurr1 (blue) and TH/VGAT/Nurr1 co-localization (magenta) in situ hybridization (ISH) of a representative coronal section (30 μm) through the SN of VGAT-Cre mouse injected in the SN with AAV.TRMS.Nurr1 and AAV.DIO.hM3Dq and receiving daily Clozapine i.p. injections for 2 weeks. Scale bars = 100 μm. Insets show representative SNr cells displaying TH-ISH+/VGAT-ISH+/Nurr1-ISH+/ co-expression. Scale bars = 20 μm. (DG) Quantification of ISH preparations revealed significant differences in the number of TH-ISH+ cells (D), TH-ISH+/VGAT-ISH+ (E), TH-ISH+/Nurr1-ISH+ (F), and TH-ISH+/VGAT-ISH+/Nurr1-ISH+ (G) co-expressing neurons displayed by VGAT-Cre mice injected with either AAV5.TRMS.Nurr1 + AAV.DIO.mCherry or AAV5.TRMS.Nurr1 + AAV.DIO.hM3Dq viral vectors. Graphs show mean ± SEM: ** p < 0.01, Student’s t-test. The number of animals is annotated in parentheses for each condition.

Similar articles

Cited by

References

    1. Dauer W., Przedborski S. Parkinson’s disease: Mechanisms and models. Neuron. 2003;39:889–909. doi: 10.1016/S0896-6273(03)00568-3. - DOI - PubMed
    1. Jankovic J. Parkinson’s disease: Clinical features and diagnosis. J. Neurol. Neurosurg. Psychiatry. 2008;79:368–376. doi: 10.1136/jnnp.2007.131045. - DOI - PubMed
    1. Latif S., Jahangeer M., Maknoon Razia D., Ashiq M., Ghaffar A., Akram M., El Allam A., Bouyahya A., Garipova L., Ali Shariati M., et al. Dopamine in Parkinson’s disease. Clin. Chim. Acta. 2021;522:114–126. doi: 10.1016/j.cca.2021.08.009. - DOI - PubMed
    1. Atik A., Stewart T., Zhang J. Alpha-Synuclein as a Biomarker for Parkinson’s Disease. Brain Pathol. 2016;26:410–418. doi: 10.1111/bpa.12370. - DOI - PMC - PubMed
    1. Vila M., Vukosavic S., Jackson-Lewis V., Neystat M., Jakowec M., Przedborski S. Alpha-synuclein up-regulation in substantia nigra dopaminergic neurons following administration of the parkinsonian toxin MPTP. J. Neurochem. 2000;74:721–729. doi: 10.1046/j.1471-4159.2000.740721.x. - DOI - PubMed