. 2023 Jan 22;13(2):199.
doi: 10.3390/jpm13020199.

Quantification of Extracellular Volume in CT in Neoadjuvant Chemotherapy in Breast Cancer: New Frontiers in Assessing the Cardiotoxicity of Anthracyclines and Trastuzumab

Affiliations

Quantification of Extracellular Volume in CT in Neoadjuvant Chemotherapy in Breast Cancer: New Frontiers in Assessing the Cardiotoxicity of Anthracyclines and Trastuzumab

Marcello Chiocchi et al. J Pers Med. .

Abstract

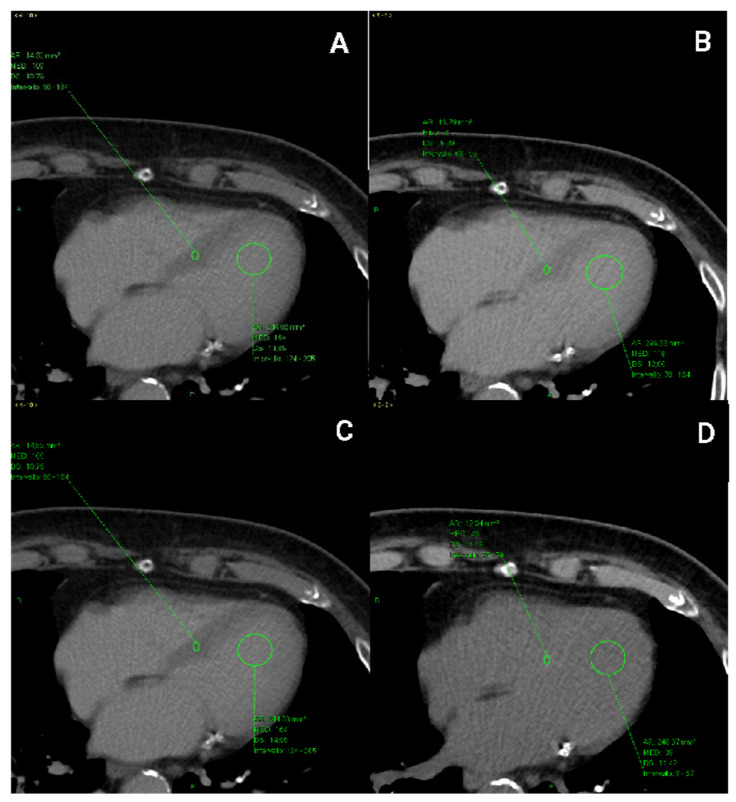
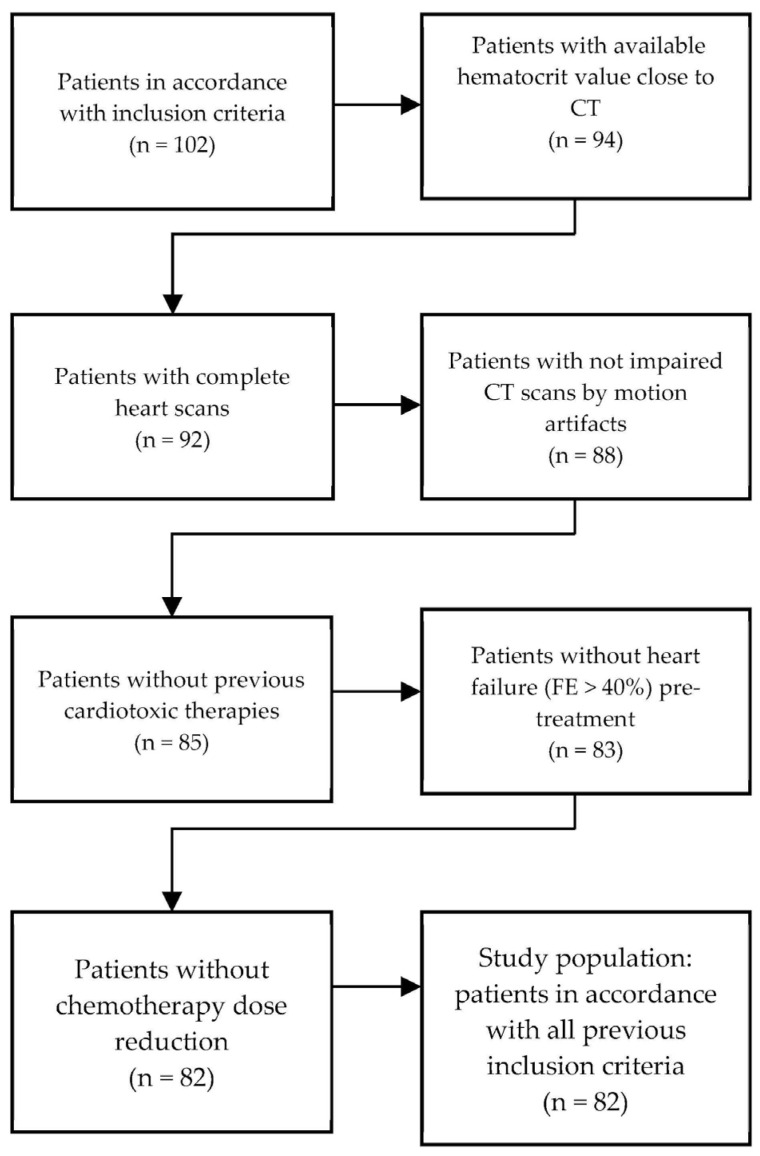
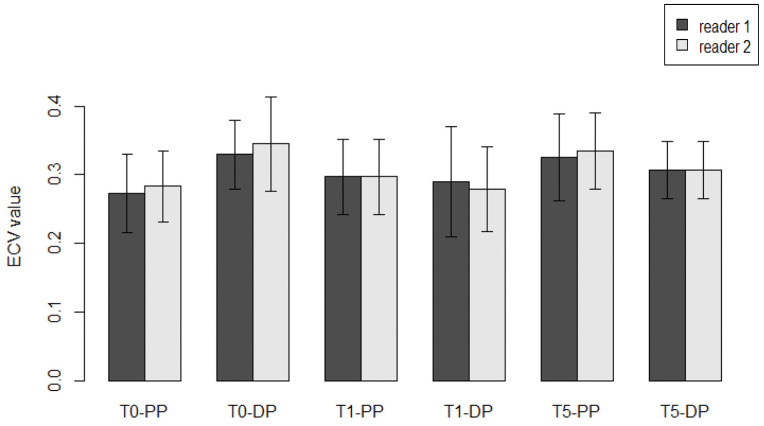
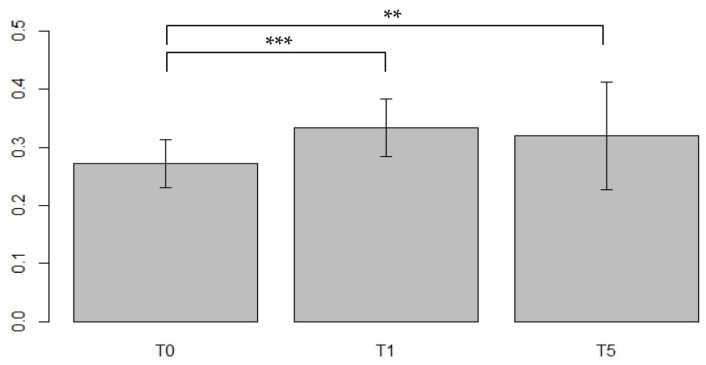
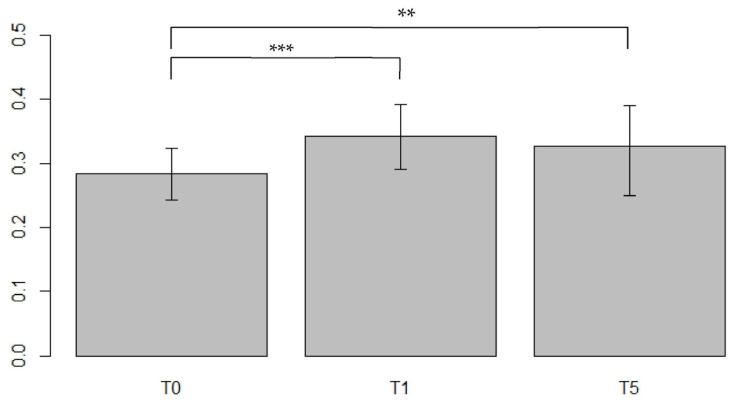
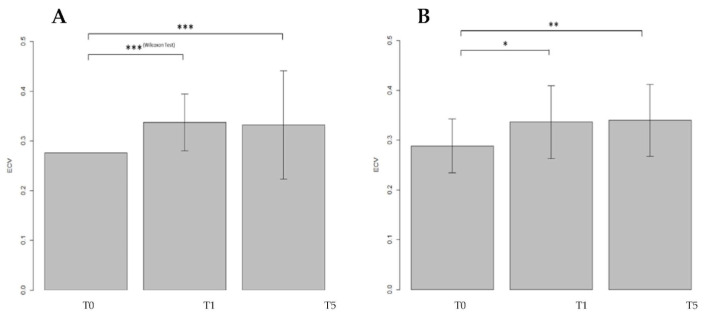
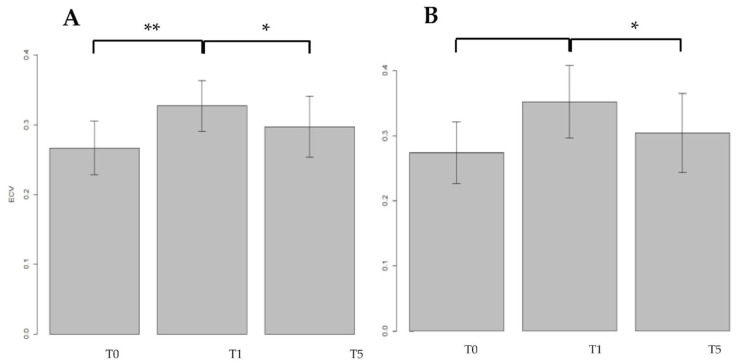
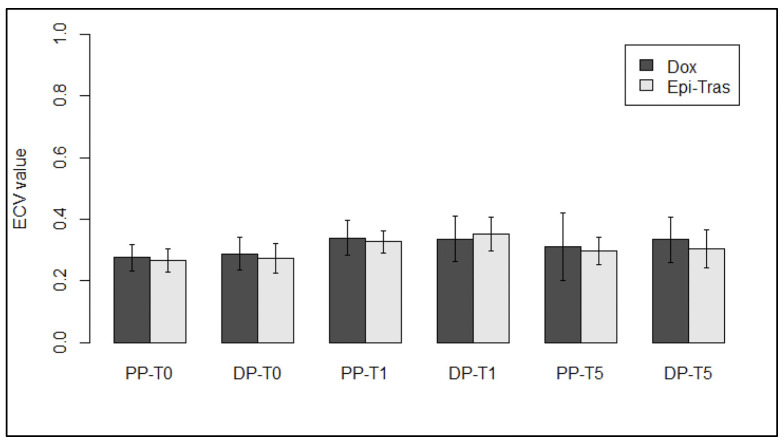
Breast cancer patients undergoing neoadjuvant chemotherapy with anthracyclines or trastuzumab can suffer cardiotoxic issues. Nowadays, the markers of cardiac damage are still not reliable, and extracellular volume (ECV) calculated from CT could be a promising cardiotoxic marker. Eighty-two patients, treated with two different chemotherapy regimens based on doxorubicin (DOX) or epirubicin-trastuzumab (EPI-TRAS), were retrospectively selected and the variations in extracellular volume (ECV) values were measured and analyzed. Whole Body CT (WB-CT) scans were acquired after 1 min, in the portal phase (PP), and after 5 min, in the delayed phases (DP), at the baseline (T0), after one year (T1) and after five years (T5) from the end of chemotherapies. The values measured by two radiologists with different levels of experience were evaluated in order to assess the inter-reader reproducibility assessment (ICC = 0.52 for PP and DP). Further, we performed a population-based analysis and a drug-oriented subgroup analysis in 54 DOX-treated and 28 EPI-TRAS-treated patients. In the general cohort of women treated with any of the two drugs, we observed in the lapse T0-T1 a relative increase (RI) of 25% vs. 20% (PP vs. DP, p < 0.001) as well as in the lapse T0-T5 an RI of 17% vs. 15% (PP vs. DP, p < 0.01). The DOX-treated patients reported in the lapse T0-T1 an RI of 22% (p < 0.0001) in PP and an RI of 16% (p = 0.018) in the DP, with ECV values remaining stably high at T5 both in PP (RI 14.0%, p < 0.0001) and in DP (RI 17%, p = 0.005) highlighting a possible hallmark of a persisting CTX sub-damage. On the other hand, ECV measured in EPI-TRAS-treated women showed an RI in T0-T1 of 18% (p = 0.001) and 29% (p = 0.006) in PP and DP, respectively, but the values returned to basal levels in T5 both in the PP (p = 0.12) and in DP setting (p = 0.13), suggesting damage in the first-year post-treatment and a possible recovery over time. For the 82 patients, an echocardiography was performed at T0, T1= 12 m + 3 m and T5 = 60 m + 6 m with LVEF values at T0 (64% ± 5%), T1 (54% ± 6%) and T5 (53% ± 8%). WB-CT-derived ECV values could provide a valid imaging marker for the early diagnosis of cardiotoxic damage in BC patients undergoing oncological treatments. We detected different patterns during the follow-up, with stably high values for DOX, whereas EPI-TRAS showed a peak within the first year, suggesting different mechanisms of cardiac damage.

Keywords: cardiotoxicity; chemotherapy; extracellular volume.


Conflict of interest statement

The authors declare no conflict of interest.

Figures

Figure 1
Figure 1
ROI (green arrows) located in the interventricular septum and left intraventricular blood pool in CT scans acquired (A) during the portal phase (1 min after contrast mean injection) and (B) in the delayed phase (5 min after contrast mean injection), respectively. ROIs used for ECV calculation in CT scans were acquired (C) in the pre-contrast phase, where the ventricular septum appears more hyperdense than the cardiac chambers (D) and in the portal phase.
Figure 2
Figure 2
Selection of the study population.
Figure 3
Figure 3
Comparison between two readers with different experience. The bar plots show the mean values for ECV measurements between two readers during FU in different moments, at the baseline, at the first year and at the fifth year, both in the portal phase (PP) and delayed phase (DP). All the comparisons were not significative (p > 0.05).
Figure 4
Figure 4
Comparisons of the ECV values from the same population between different timepoints in the Portal Phase. ECV values measured at baseline (T0), after first year post-treatment (T1) and after 5 years post-treatment (T5). strongly significant values were associated within the comparison T0–T1 (p < 0.0001) suggesting a strong interaction between CTX drugs and myocardial precocious damage, confirmed also after 5 years with stable high values, significant as well (p < 0.01). *: barely significant, **: significant, ***: strongly significant.
Figure 5
Figure 5
Comparisons of the ECV values from the same population between different timepoints in the Delayed Phase. Moreover, in Delayed Phase ECV values were measured at T0, T1 and T5. Both comparisons revealed values strongly significant (p < 0.001) confirming a strict interaction between CTX drugs and myocardial precocious damage. *: barely significant, **: significant, ***: strongly significant.
Figure 6
Figure 6
ECV mean values are presented in bar plots, while SD was expressed with error bars, at different FU times: baseline (T0), first year (T1) and fifth year (T5), both in portal phase (A) and in delayed phase (B) in patients treated with doxorubicin (DOX). Of note, T0 in PP was not normally distributed so SD was not used and the error bar was consequently not reported. A significant increase in mean values was found between T0–T1 and T0–T5. *** p < 0.001; ** p < 0.01; * p < 0.05.
Figure 7
Figure 7
ECV mean values are presented in barplots at different FU times, at baseline (T0), at first year (T1) and at fifth year (T5), both in portal phase (A) and in delayed phase (B) in patients treated with epirubicin and trastuzumab (EPI–TRAS). *** p< 0.001; ** p< 0.01; * p< 0.05.
Figure 8
Figure 8
ECV comparison in patients treated with DOX versus patients treated with EPI–TRAS, at different FU times in both PP and DP setting. NS, not significant; PP, portal phase; DP, delayed phase.

References

    1. WHO Health Organization The Top 10 Causes of Death. [(accessed on 1 February 2022)]. Available online: http://www.who.int/news-room/fact-sheets/detail/the-top-10-causes-of-death.
    1. Vanni G., Pellicciaro M., Materazzo M., Bruno V., Oldani C., Pistolese C.A., Buonomo C., Caspi J., Gualtieri P., Chiaravalloti A., et al. Lockdown of Breast Cancer Screening for COVID-19: Possible Scenario. Vivo. 2020;34:3047–3053. doi: 10.21873/invivo.12139. - DOI - PMC - PubMed
    1. DeSantis C.E., Ma J., Gaudet M.M., Newman L.A., Miller K.D., Goding Sauer A., Jemal A., Siegel R.L. Breast Cancer Statistics, 2019. CA Cancer J. Clin. 2019;69:438–451. doi: 10.3322/caac.21583. - DOI - PubMed
    1. Orsaria P., Varvaras D., Vanni G., Pagnani G., Scaggiante J., Frusone F., Granai A.V., Petrella G., Buonomo O.C. Nodal Status Assessment in Breast Cancer: Strategies of Clinical Grounds and Quality of Life Implications. Int. J. Breast Cancer. 2014;2014:1–8. doi: 10.1155/2014/469803. - DOI - PMC - PubMed
    1. Cardoso F., Kyriakides S., Ohno S., Penault-Llorca F., Poortmans P., Rubio I.T., Zackrisson S., Senkus E. Early Breast Cancer: ESMO Clinical Practice Guidelines for Diagnosis, Treatment and Follow-Up. Ann. Oncol. 2019;30:1194–1220. doi: 10.1093/annonc/mdz173. - DOI - PubMed

LinkOut - more resources