

Advancing Osteoporosis Evaluation Procedures: Detailed Computational Analysis of Regional Structural Vulnerabilities in Osteoporotic Bone
- PMID: 36836558
- PMCID: PMC9962183
- DOI: 10.3390/jpm13020321
Advancing Osteoporosis Evaluation Procedures: Detailed Computational Analysis of Regional Structural Vulnerabilities in Osteoporotic Bone
Abstract
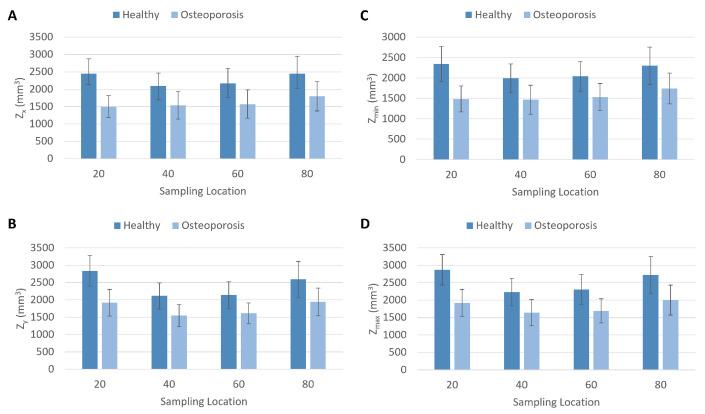
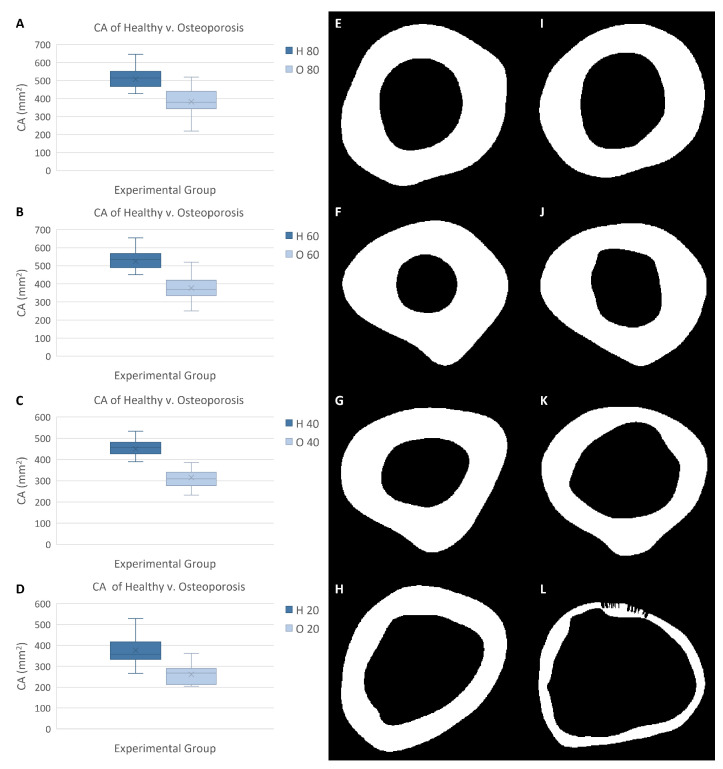
Osteoporotic fractures of the femur are associated with poor healing, disability, reduced quality of life, and high mortality rates within 1 year. Moreover, osteoporotic fractures of the femur are still considered to be an unsolved problem in orthopedic surgery. In order to more effectively identify osteoporosis-related fracture risk and develop advanced treatment approaches for femur fractures, it is necessary to acquire a greater understanding of how osteoporosis alters the diaphyseal structure and biomechanical characteristics. The current investigation uses computational analyses to comprehensively examine how femur structure and its associated properties differ between healthy and osteoporotic bones. The results indicate statistically significant differences in multiple geometric properties between healthy femurs and osteoporotic femurs. Additionally, localized disparities in the geometric properties are evident. Overall, this approach will be beneficial in the development of new diagnostic procedures for highly detailed patient-specific detection of fracture risk, for establishing novel injury prevention treatments, and for informing advanced surgical solutions.
Keywords: biomechanics; computational analysis; diagnostic methods; fracture prevention; patient-specific; personalized medicine.
Conflict of interest statement
The authors declare no conflict of interest.
Figures


Similar articles
-
Femoroplasty-augmentation of mechanical properties in the osteoporotic proximal femur: a biomechanical investigation of PMMA reinforcement in cadaver bones.Clin Biomech (Bristol). 2004 Jun;19(5):506-12. doi: 10.1016/j.clinbiomech.2004.01.014. Clin Biomech (Bristol). 2004. PMID: 15182986
-
Biomechanical characterization of an osteoporotic artificial bone model for the distal femur.J Biomater Appl. 2012 Jan;26(5):565-79. doi: 10.1177/0885328210378057. Epub 2010 Sep 6. J Biomater Appl. 2012. PMID: 20819921
-
Utilization of DXA Bone Mineral Densitometry in Ontario: An Evidence-Based Analysis.Ont Health Technol Assess Ser. 2006;6(20):1-180. Epub 2006 Nov 1. Ont Health Technol Assess Ser. 2006. PMID: 23074491 Free PMC article.
-
Bench-to-bedside strategies for osteoporotic fracture: From osteoimmunology to mechanosensation.Bone Res. 2019 Aug 15;7:25. doi: 10.1038/s41413-019-0066-7. eCollection 2019. Bone Res. 2019. PMID: 31646015 Free PMC article. Review.
-
Unmet needs and current and future approaches for osteoporotic patients at high risk of hip fracture.Arch Osteoporos. 2016 Dec;11(1):37. doi: 10.1007/s11657-016-0292-1. Epub 2016 Oct 31. Arch Osteoporos. 2016. PMID: 27800591 Free PMC article. Review.
Cited by
-
Validation of Three Tools for Estimating the Risk of Primary Osteoporosis in an Elderly Male Population in Beijing.Clin Interv Aging. 2023 May 24;18:845-853. doi: 10.2147/CIA.S410239. eCollection 2023. Clin Interv Aging. 2023. PMID: 37256154 Free PMC article.
-
Compartmentalization Index: Description and Applications in Anthropological Studies.Am J Biol Anthropol. 2025 Jul;187(3):e70087. doi: 10.1002/ajpa.70087. Am J Biol Anthropol. 2025. PMID: 40579945 Free PMC article.
-
Personalized Medicine for Orthopaedic Disorders.J Pers Med. 2023 Oct 30;13(11):1553. doi: 10.3390/jpm13111553. J Pers Med. 2023. PMID: 38003868 Free PMC article.
-
Construction of a predictive model for osteoporosis risk in men: using the IOF 1-min osteoporosis test.J Orthop Surg Res. 2023 Oct 11;18(1):770. doi: 10.1186/s13018-023-04266-7. J Orthop Surg Res. 2023. PMID: 37821993 Free PMC article.
References
-
- Caliri A., De Filippis L., Bagnato G., Bagnato G. Osteoporotic fractures: Mortality and quality of life. Panminerva Med. 2007;49:21. - PubMed
LinkOut - more resources
Full Text Sources
