

Practical Understanding of Cancer Model Identifiability in Clinical Applications
- PMID: 36836767
- PMCID: PMC9961656
- DOI: 10.3390/life13020410
Practical Understanding of Cancer Model Identifiability in Clinical Applications
Abstract
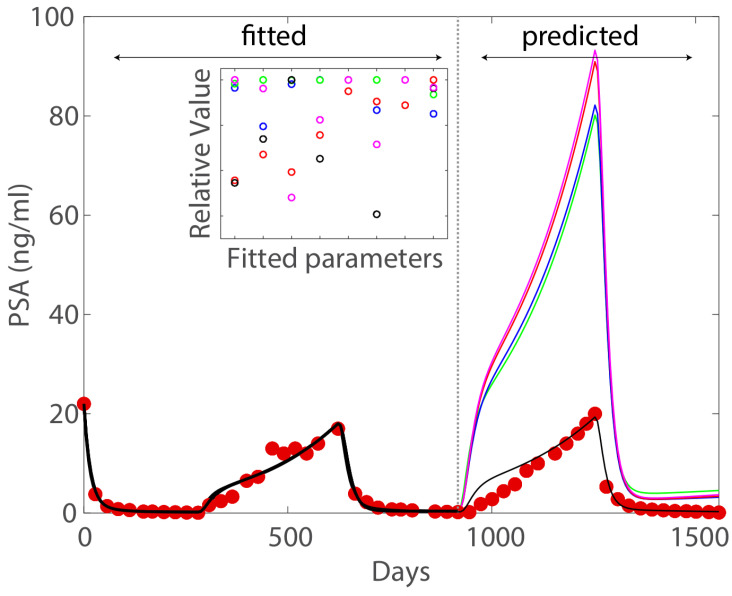
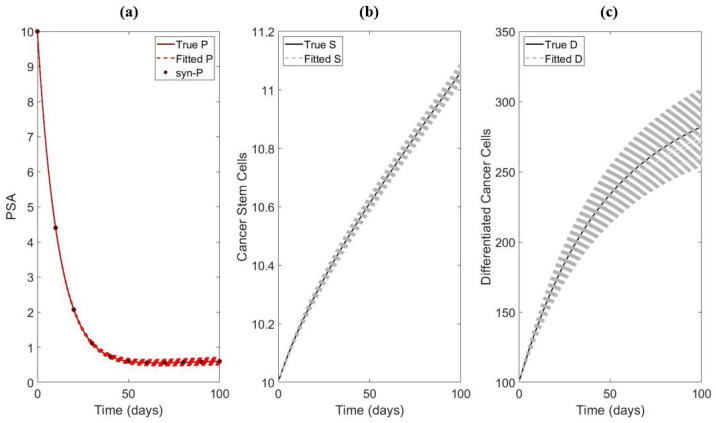
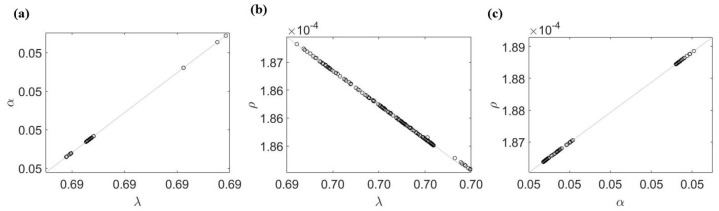
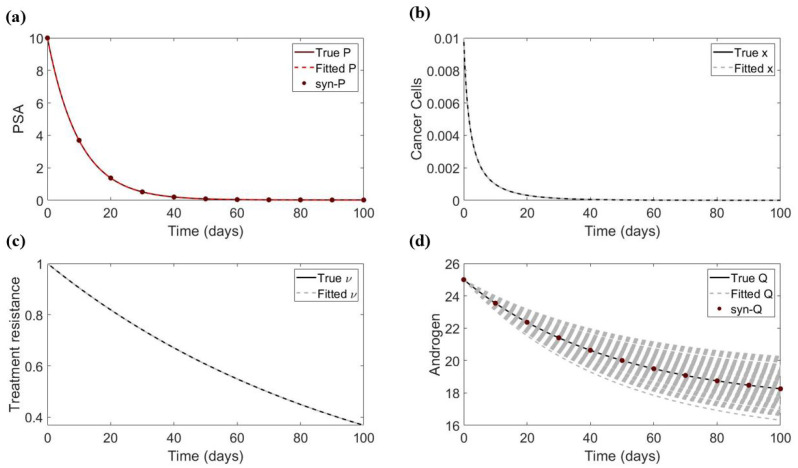
Mathematical models are a core component in the foundation of cancer theory and have been developed as clinical tools in precision medicine. Modeling studies for clinical applications often assume an individual's characteristics can be represented as parameters in a model and are used to explain, predict, and optimize treatment outcomes. However, this approach relies on the identifiability of the underlying mathematical models. In this study, we build on the framework of an observing-system simulation experiment to study the identifiability of several models of cancer growth, focusing on the prognostic parameters of each model. Our results demonstrate that the frequency of data collection, the types of data, such as cancer proxy, and the accuracy of measurements all play crucial roles in determining the identifiability of the model. We also found that highly accurate data can allow for reasonably accurate estimates of some parameters, which may be the key to achieving model identifiability in practice. As more complex models required more data for identification, our results support the idea of using models with a clear mechanism that tracks disease progression in clinical settings. For such a model, the subset of model parameters associated with disease progression naturally minimizes the required data for model identifiability.
Keywords: clinical application; computational oncology; mathematical model; mathematical oncology; model identifiability; observing-system simulation experiment; precision treatment; prostate cancer.
Conflict of interest statement
The authors declare no conflict of interest.
Figures
References
-
- Kuang Y., Nagy J.D., Eikenberry S.E. Introduction to Mathematical Oncology. Volume 59 CRC Press; Boca Raton, FL, USA: 2016.
-
- Wodarz D., Komarova N. Dynamics of Cancer: Mathematical Foundations of Oncology. World Scientific; River Edge, NJ, USA: 2014.
-
- Bull J.A., Byrne H.M. The hallmarks of mathematical oncology. Proc. IEEE. 2022;110:523–540. doi: 10.1109/JPROC.2021.3136715. - DOI
Grants and funding
LinkOut - more resources
Full Text Sources
Research Materials
