. 2023 Feb 16;16(4):1664.
doi: 10.3390/ma16041664.

3D DEM Simulations and Experiments on Spherical Impactor Penetrating into the Elongated Particles

Affiliations

3D DEM Simulations and Experiments on Spherical Impactor Penetrating into the Elongated Particles

Ping Li et al. Materials (Basel). .

Abstract

In this study, a brass or glass spherical impactor vertically penetrating into a granular bed composed of mono-sized spherical or elongated particles was simulated with three-dimensional (3D) discrete element method (DEM). Good agreement of the particle masses in the cup before and after penetration can be found in the simulations and experiments. The effects of particle length (Lp), friction coefficient, and particle configuration on the penetration depth of the impactor, ejecta mass, and solid volume fraction describing the response of the granular bed are discussed. The penetration depth is negatively correlated with Lp as the corresponding solid volume fraction of the granular bed decreases. A smaller friction coefficient leads to a larger penetration depth of the impactor and more ejection of particles. When the impactor is penetrating the Lp = 10 mm elongated particles, the penetration depth is negatively correlated to the order parameter and solid volume fraction.

Keywords: discrete element method; elongated particles; impact experiment; impaction; particle orientation.


Conflict of interest statement

The authors declare no conflict of interest.

Figures
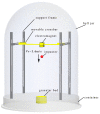
Figure 1
Figure 1
Schematic drawing of the experimental apparatus. (The arrow represents the velocity direction of the impactor.)
Figure 2
Figure 2
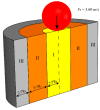
Schematic diagram of numerical setup. (The arrow represents the velocity direction of the impactor.)
Figure 3
Figure 3
(a) Comparison of the penetration depth of glass impactor for five different time steps in DEM simulations. (b) Comparison of the penetration depth of glass impactor for five different cups in DEM simulations. (The length of elongated particles is 10 mm, the velocity of glass impactor is 3.60 m/s, and Dc and Hc are shown in Table 2).
Figure 4
Figure 4
(a) Influence of particle length on ejecta masses for both glass and brass impactors in DEM simulations. (b) Comparison of ejecta mass as a function of particle length between experiments and simulations. (The length of 2 mm represents the data of 2 mm spheres here and all the simulation parameters are from Table 2).
Figure 5
Figure 5
Kinetic energy Eke of ejected particles as a function of time for granular bed of spherical particles and elongated particles of four particle lengths in DEM simulations: (a) is for the glass impactor, and (b) is for the brass impactor.
Figure 6
Figure 6
(a) H0/D0 versus time for granular bed of spheres and elongated particles of four lengths. (b) The fitting curves of the H0/D0 and particle length Lp for glass and brass impactors. H0 and D0 represent the penetration depth and diameter of the impactor, respectively.
Figure 7
Figure 7
Kinetic energy of impactor Eki as a function of time for granular bed of spherical particles and elongated particles of four lengths: (a) is for the glass impactor, and (b) is for the brass impactor.
Figure 8
Figure 8
Average contact force of particles Fppc as a function of time for 2 mm sphere and Lp = 4 mm, 6 mm, 8 mm, 10 mm elongated particles for DEM simulations: (a) is for the glass impactor, and (b) is for the brass impactor.
Figure 9
Figure 9
Diagram of sub-region division for granular bed. Region I: 0 < R1 < 2/7Rc; region II: 2/7Rc < R2 < 5/7Rc; and region III: 5/7Rc < R3 < Rc. (The particles count in one region if their mass centers fall in this region; Rc is the radius of the cup).
Figure 10
Figure 10
(a) Comparison of solid volume fraction ϕp as a function of particle length Lp between experiments and simulations for both glass and brass impactors. (b) Initial solid volume fraction ϕp of the whole granular bed or three regions of granular bed as a function of particle length Lp before impact. The particle length of 2 mm represents the data of 2 mm spheres here.
Figure 11
Figure 11
Granular temperature Tp of particles in three regions versus time for granular bed with Lp = 4 mm, 6 mm, 8 mm, 10 mm elongated particles: (a) is for the glass impactor, and (b) is for the brass impactor.
Figure 12
Figure 12
Kinetic energy of particles in the cup Ekc in three regions versus time for granular bed with Lp = 4 mm, 6 mm, 8 mm, 10 mm elongated particles: (a) is for the glass impactor, and (b) is for the brass impactor.
Figure 13
Figure 13
Relationship between percentage of ejecta mass and friction coefficient μp-p, μi-p, and μw-p for Lp = 6 mm elongated particles. Condition I: μi-p = 0.2, μw-p = 0.34 and various μp-ps; condition II: μp-p = 0.2, μw-p = 0.34 and various μi-ps; condition III: μp-p = 0.2, μi-p = 0.2 and various μw-ps.
Figure 14
Figure 14
Time evolution of the non-dimensional penetration depth H0/D0 of impacting into the granular bed of Lp = 6 mm particles: (a) condition I, (b) condition II, and (c) condition III. H0 and D0 represent the penetration depth and diameter of impactor, respectively. Condition I: μi-p = 0.2, μw-p = 0.34 and various μp-ps; condition II: μp-p = 0.2, μw-p = 0.34 and various μi-ps; condition III: μp-p = 0.2, μi-p = 0.2 and various μw-ps. (The dotted lines are used to clearly mark the position of the impactor at different times.)
Figure 15
Figure 15
Time evolution of vertical velocity of impactor with sphere impacting into the granular bed of Lp = 6 mm elongated particles: (a) condition I and (b) condition II and III. Condition I: μi-p = 0.2, μw-p = 0.34 and various μp-ps; condition II: μp-p = 0.2, μw-p = 0.34 and various μi-ps; condition III: μp-p = 0.2, μi-p = 0.2 and various μw-ps. (The dotted lines are used to clearly mark the velocity of the impactor at different times).
Figure 16
Figure 16
Velocity profiles of elongated particles (Lp = 6 mm) impacted by brass impactor. (Lp = 6 mm, μp-p = 0.8, arrow represents velocity of impactor, whose color remains unchanged.)
Figure 17
Figure 17
(a) Fipc as a function of time, Fipc is the vertical contact force between impactor and particles; and (b) Fppc as a function of time, Fppc is the average contact force between all particles.
Figure 18
Figure 18
Diagram of regular configuration of elongated particles (Lp = 10 mm): (a,b) are lateral arrangement and vertical arrangement in the cylindrical cup; (c,d) are the lateral arrangement and vertical arrangement in the cuboid cup.
Figure 19
Figure 19
Comparison between solid volume fractions for different packing types (type 1—lateral arrangement, type 2—vertical arrangement, and type 3—random arrangement). The length of particles in the cup is 10 mm.
Figure 20
Figure 20
The order parameters and orientational parameters of three packings in cylindrical cup and cuboid cup: (a) is the order parameters for three packing types; (b) is the orientational parameters for three packing types (type 1—lateral arrangement, type 2—vertical arrangement, and type 3—random arrangement). The length of particles in the cup is Lp = 10 mm.
Figure 21
Figure 21
Comparison between ejecta masses for three packing types in cylindrical cup and cuboid cup. The length of particles in the cup is AR = 5.
Figure 22
Figure 22
Comparison between H0/D0 for three packing types in cylindrical cup and cuboid cup. The length of particles in the cup is AR = 5; H0 and D0 represent the penetration depth of impactor and diameter of impactor, respectively.

References

    1. Bötschi S., Rajagopalan A.K., Rombaut I., Morari M., Mazzotti M. From needle-like toward equant particles: A controlled crystal shape engineering pathway. Comput. Chem. Eng. 2019;131:106581. doi: 10.1016/j.compchemeng.2019.106581. - DOI
    1. Aust A.E., Cook P.M., Dodson R.F. Morphological and chemical mechanisms of elongated mineral particle toxicities. J. Toxicol. Environ. Health Part B. 2011;14:40–75. doi: 10.1080/10937404.2011.556046. - DOI - PMC - PubMed
    1. Doshi N., Mitragotri S. Needle-shaped polymeric particles induce transient disruption of cell membranes. J. R. Soc. Interface. 2010;7:S403–S410. doi: 10.1098/rsif.2010.0134.focus. - DOI - PMC - PubMed
    1. Guidelli E.J., Ramos A.P., Zaniquelli M.E.D., Nicolucci P., Baffa O. Synthesis and characterization of silver/alanine nanocomposites for radiation detection in medical applications: The influence of particle size on the detection properties. Nanoscale. 2012;4:2884. doi: 10.1039/c2nr30090g. - DOI - PubMed
    1. Khodadadian A., Noii N., Parvizi M., Abbaszadeh M., Wick T., Heitzinger C. A Bayesian estimation method for variational phase-field fracture problems. Comput. Mech. 2020;66:827–849. doi: 10.1007/s00466-020-01876-4. - DOI - PMC - PubMed