. 2023 Feb 20;16(4):1737.
doi: 10.3390/ma16041737.

Effect of the Application of Sunflower Biochar and Leafy Trees Biochar on Soil Hydrological Properties of Fallow Soils and under Soybean Cultivation

Affiliations

Effect of the Application of Sunflower Biochar and Leafy Trees Biochar on Soil Hydrological Properties of Fallow Soils and under Soybean Cultivation

Urszula Sadowska et al. Materials (Basel). .

Abstract

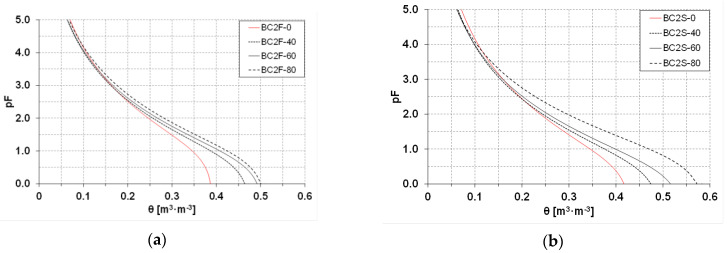
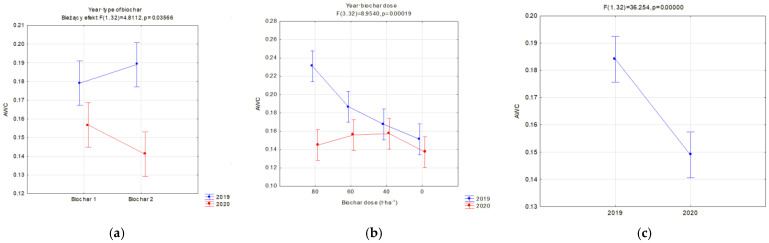
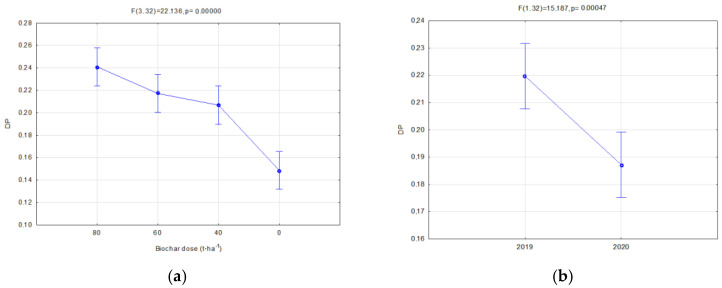
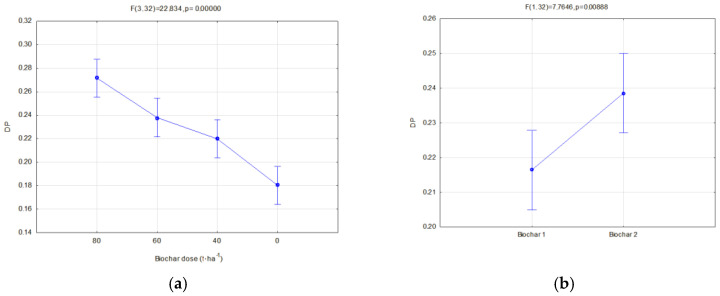
Soils enriched with biochar are recommended as a cultivation grounds, especially in case they contain significant amount of sand. However, the interactions between biochar and plants, as well as the influence of the biochar on water retention, cultivation and air properties of soils, are still not obvious. The present study aimed to determine the impact of various biochar doses on soils used for soya cultivation, in comparison to soils maintained as black fallow soil, on their water retention and productivity, for the period of two years. Sunflower husk biochar (BC1) and biochar of leafy trees (BC2), in doses of 0, 40, 60, 80 t·ha-1, were used for field experiments. The water retention was investigated with porous boards in pressure chambers by a drying method. No differences in the hydrological properties of the soils that were differently managed (black fallow soil, crop) were observed following biochar application. Addition of BC1, in the amounts of 40, 60, and 80 t·ha-1, caused an increase in the plant available water capacity (AWC) by 15.3%, 18.7%, and 13.3%, respectively, whereas the field capacity (FC) increased by 7.4%, 9.4%, and 8.6% for soils without biochar. Application of BC2 analogously resulted in higher AWC, by 8.97, 17.2%, and 33.1%, respectively, and higher FC by 3.75, 7.5%, and 18.3%, respectively. Increasing the doses of BC1 and BC2, both on black fallow soils and soils enriched with soya, caused a rise in total porosity (TP) and drainage porosity (DP), and a decrease in soil bulk density (SBD). Biochar with a higher total area and higher porosity (BC1) applied to soils with soya cultivation resulted in lower reductions in AW and FC than BC2 in the second year of investigation.

Keywords: biochar; retention; soil amendment; soybean porosity; total surface area.


Conflict of interest statement

The authors declare no conflict of interest.

Figures

Figure 1
Figure 1
Granulation (particle size distribution) of the biochars produced.
Figure 2
Figure 2
Air temperature distribution during tests. Average (T), maximum (TM), and minimum (Tm) temperatures in particular soya vegetation months in the years of the tests.
Figure 3
Figure 3
Total monthly sum of precipitation in particular months of soya growing in the years of the research.
Figure 4
Figure 4
Average (2019–2020) soil water retention curves (SWRC) with BC1 additions within the range of 0–80 tons per hectare, (a) on fallow land fields BC1F, (b) on fields with soya BC1S.
Figure 5
Figure 5
Average (2019–2020) soil water retention curves (SWRC) with BC2 additions within the range of 0–80 tons per hectare, (a) on fallow land fields BC2F, (b) on fields with soya BC2S.
Figure 6
Figure 6
Field capacity (cm3·cm−3) of fallow soils in relation to the dose applied (a) and year of research (b).
Figure 7
Figure 7
Field capacity (cm3·cm−3) of soils with soya in relation to the dose applied (a) and interaction of the biochar dose amount and year of research (b).
Figure 8
Figure 8
Field capacity (cm3·cm−3) of soils with soya in relation to the year of research (a) and interaction of biochar type and year of research (b).
Figure 9
Figure 9
Permanent wilting point (cm3·cm−3) of fallow soils in relation to the applied biochar dose (a) and interaction of a dose and biochar type (b).
Figure 10
Figure 10
Permanent wilting point (cm3·cm−3) of fallow soils in relation to the year of research (a) and interaction of a dose and year of research (b).
Figure 11
Figure 11
Permanent wilting point (cm3·cm−3) of soils with soya, significant relations and all interactions; interaction of the dose amount and year of research (a), in relation to the year of research (b), interaction of biochar type and the year of research (c), interaction of the dose amount, biochar type and year of research (d) and in relation to the dose applied (e).
Figure 11
Figure 11
Permanent wilting point (cm3·cm−3) of soils with soya, significant relations and all interactions; interaction of the dose amount and year of research (a), in relation to the year of research (b), interaction of biochar type and the year of research (c), interaction of the dose amount, biochar type and year of research (d) and in relation to the dose applied (e).
Figure 12
Figure 12
AWC (cm3·cm−3) for fallow soils (significant only dose) (a) and for soils covered with plants in relation to the applied dose of biochar (b).
Figure 13
Figure 13
AWC (cm3·cm−3) for soils covered with plants, significant relations; in relation to the applied dose of biochar (a), dose interaction and year of research (b) and in relation to the year of research (c).
Figure 14
Figure 14
Soil bulk density for fallow soils in relation to the biochar dose (a), years of application (b) and dose interaction and the year of research (c).
Figure 15
Figure 15
Soil bulk density for soils taken up by soya cultivation in relation to the biochar dose (a) and year of application (b).
Figure 16
Figure 16
Total porosity of fallow soils in relation to the dose (a) and year of research (b) and dose interaction and the year of research (c).
Figure 17
Figure 17
Total porosity of soils covered with soya in relation to dose (a) and interaction of a dose and biochar type (b).
Figure 18
Figure 18
Total porosity of soils covered with soya cultivation in relation to biochar type (a) and the year of research (b).
Figure 19
Figure 19
Drainage porosity of fallow soils in relation to the applied biochar dose (a) and the year of research (b).
Figure 20
Figure 20
Drainage porosity of soils covered with soya crop in relation to the applied dose (a) and type of biochar (b).
Figure 21
Figure 21
Average yield in relation to the applied biochar dose (a) in particular year of research (b).
Figure 22
Figure 22
Soya yield relation to applied biochar dose.

References

    1. Edeh G., Ondřej M., Bussb W. A meta-analysis on biochar’s effects on soil water properties—New insights and future research challenges. Sci. Total Environ. 2020;714:136857. doi: 10.1016/j.scitotenv.2020.136857. - DOI - PubMed
    1. Tanure M.M., da Costa L.M., Huiz H.A., Fernandes R.B., Cecon P.R., Junior J.D., da Luz J.M. Soil water retention, physiological characteristics, and growth of maize plants in response to biochar application to soil. Soil Tillage Res. 2019;192:164–173. doi: 10.1016/j.still.2019.05.007. - DOI
    1. Razzaghi F., Obour P.B., Arthur E. Does biochar improve soil water retention? A systematic review and meta-analysis. Geoderma. 2020;361:114055. doi: 10.1016/j.geoderma.2019.114055. - DOI
    1. Sadowska U., Domagała-Świątkiewicz I., Żabiński A. Biochar and Its Effects on Plant–Soil Macronutrient Cycling during a Three-Year Field Trial on Sandy Soil with Peppermint (Mentha piperita L.). Part I: Yield and Macro Element Content in Soil and Plant Biomass. Agronomy. 2020;10:1950. doi: 10.3390/agronomy10121950. - DOI
    1. Domingues R.R., Trugilho P.F., Silva C.A. Properties of biochar derived from wood and high nutrient biomasses with the aim of agronomic and environmental benefits. PLoS ONE. 2017;12:e0176884. doi: 10.1371/journal.pone.0176884. - DOI - PMC - PubMed