. 2023 Feb 7;13(2):206.
doi: 10.3390/membranes13020206.

An Isotonic Model of Neuron Swelling Based on Co-Transport of Salt and Water

Affiliations

An Isotonic Model of Neuron Swelling Based on Co-Transport of Salt and Water

Reinoud Maex. Membranes (Basel). .

Abstract

Neurons spend most of their energy building ion gradients across the cell membrane. During energy deprivation the neurons swell, and the concomitant mixing of their ions is commonly assumed to lead toward a Donnan equilibrium, at which the concentration gradients of all permeant ion species have the same Nernst potential. This Donnan equilibrium, however, is not isotonic, as the total concentration of solute will be greater inside than outside the neurons. The present theoretical paper, in contrast, proposes that neurons follow a path along which they swell quasi-isotonically by co-transporting water and ions. The final neuronal volume on the path is taken that at which the concentration of impermeant anions in the shrinking extracellular space equals that inside the swelling neurons. At this final state, which is also a Donnan equilibrium, all permeant ions can mix completely, and their Nernst potentials vanish. This final state is isotonic and electro-neutral, as are all intermediate states along this path. The path is in principle reversible, and maximizes the work of mixing.

Keywords: KCC2; brain; co-transporter; concentration gradient; energy; extracellular space; ions; ischemia; mixing; osmosis.


Conflict of interest statement

The author declares no conflict of interest.

Figures
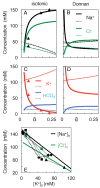
Figure 3
Figure 3
Concentration-volume curves for the permeant ions during isotonic mixing (A,C), as compared to mixing to the Donnan equilibrium at each intermediate volume α˜ (B,D). Thick and thin curves plot extra- and intracellular concentrations, respectively. Data points △ in (A,C) are from Supplementary Table S2 of Reference [44]. (E) Theoretical prediction of the profile of [Na+]o (black solid line) and [Cl]o (green) against [K+]o. Data points are from Reference [44] (△), [45] (□), [46] (∘), and [9] (⋄). Data from the same reference are connected by dotted lines, but may have been compiled from different experiments.
Figure 1
Figure 1
Diagram of the model, showing the extra- and intracellular compartments, separated by the membrane barrier (thick vertical line), before (left) and after mixing (right). Widths (not to scale) indicate relative compartmental sizes, heights relative concentrations of Na+ (gray) and K+ (white). Only the monovalent cations of Table 1 are shown.
Figure 2
Figure 2
Comparison of the isotonic mixing path (black curves) and the Donnan equilibrium at each intermediate volume (red). (A) Extra- and intracellular total solute concentration. (B) Transmembrane Nernst potential. For the Donnan equilibria, the four Nernst potentials coincide at their common Donnan potential. In this and the following figures, mixing starts from the physiological concentrations of Table 1 (at α˜=α=0.25), and the concomitant shrinkage of extracellular space is monitored by variable α˜ on the horizontal axis.
Figure 4
Figure 4
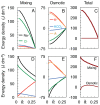
Work done by mixing (A,D), osmotic work done (B,E), and total work done (C,F). Work, expressed as energy density in joule per liter, is compared for neuronal swelling along the isotonic path (AC) and swelling to the Donnan equilibria at the same volumes (DF), each time starting from α˜ = 0.25. (A,D) Work calculated from Equation (12). (B,E) Work calculated by adding Equations (13a) and (13b). (C,F) Total work of mixing (thick line) and total osmotic work (thin), obtained by adding over all ion species.
Figure 5
Figure 5
Mechanical equivalent of work of mixing. Boxes represent families of membrane proteins (yellow: the Na+/K+ pump; orange, ion channels and transporters); displacement to the right indicates work done by transport. Springs reflect storage of potential energy in primary or secondary transmembrane gradients. (A) The chemical potential of ATP and its metabolites drives the Na+/K+ pump and stores potential energy in the concentration gradients of the monovalent ions. (B) The primary ion gradients drive secondary transport of ions, water and metabolites. (C) Hypothetical ATP synthesis through backward operation of the Na+/K+ pump.

References

    1. Ereciñska M., Silver I.A. ATP and brain function. J. Cereb. Blood Flow Metab. 1989;9:2–19. doi: 10.1038/jcbfm.1989.2. - DOI - PubMed
    1. Skou J.C. The influence of some cations on an adenosine triphosphatase from peripheral nerves. Biochim. Biophys. Acta. 1957;23:394–401. doi: 10.1016/0006-3002(57)90343-8. - DOI - PubMed
    1. De Weer P., Gadsby D.C., Rakowski R.F. Voltage dependence of the Na-K pump. Annu. Rev. Physiol. 1988;50:225–241. doi: 10.1146/annurev.ph.50.030188.001301. - DOI - PubMed
    1. Maex R. Effect of extracellular volume on the energy stored in transmembrane concentration gradients. Phys. Rev. E. 2021;104:044409. doi: 10.1103/PhysRevE.104.044409. - DOI - PubMed
    1. Rungta R.L., Choi H.B., Tyson J.R., Malik A., Dissing-Olesen L., Lin P.J.C., Cain S.M., Cullis P.R., Snutch T.P., MacVicar B.A. The cellular mechanisms of neuronal swelling underlying cytotoxic edema. Cell. 2015;161:610–621. doi: 10.1016/j.cell.2015.03.029. - DOI - PubMed

LinkOut - more resources