Review
. 2023 Feb 10;13(2):223.
doi: 10.3390/membranes13020223.

Remodeling of Biomembranes and Vesicles by Adhesion of Condensate Droplets

Affiliations
Review

Remodeling of Biomembranes and Vesicles by Adhesion of Condensate Droplets

Reinhard Lipowsky. Membranes (Basel). .

Abstract

Condensate droplets are formed in aqueous solutions of macromolecules that undergo phase separation into two liquid phases. A well-studied example are solutions of the two polymers PEG and dextran which have been used for a long time in biochemical analysis and biotechnology. More recently, phase separation has also been observed in living cells where it leads to membrane-less or droplet-like organelles. In the latter case, the condensate droplets are enriched in certain types of proteins. Generic features of condensate droplets can be studied in simple binary mixtures, using molecular dynamics simulations. In this review, I address the interactions of condensate droplets with biomimetic and biological membranes. When a condensate droplet adheres to such a membrane, the membrane forms a contact line with the droplet and acquires a very high curvature close to this line. The contact angles along the contact line can be observed via light microscopy, lead to a classification of the possible adhesion morphologies, and determine the affinity contrast between the two coexisting liquid phases and the membrane. The remodeling processes generated by condensate droplets include wetting transitions, formation of membrane nanotubes as well as complete engulfment and endocytosis of the droplets by the membranes.

Keywords: adhesion; biomembranes; condensate droplets; endocytosis; engulfment; line tension; membrane tubulation; surface tensions; synthetic biosystems; wetting transitions.


Conflict of interest statement

The author declares no conflict of interest.

Figures

Figure 1
Figure 1
Geometry of vesicle-droplet systems which involve three liquid phases α (white), β (green), and γ (pink). The phases α and β represent two coexisting phases that arise via segregative or associative liquid–liquid phase separation: (a) Phase separation in the exterior solution and adhesion of the condensate droplet β to the outer leaflet of the vesicle membrane; and (b) Phase separation in the interior solution and adhesion of the β droplet to the interior leaflet of the membrane. The γ phase corresponds to an inert spectator phase. The αβ interface (dashed green line) and the vesicle membrane form the contact line (open circles) which partitions the vesicle membrane into two segments, the αγ segment exposed to the α and γ phases as well as the βγ segment in contact with the β and γ phases.
Figure 2
Figure 2
Different adhesion morphologies of a lipid vesicle (light red) interacting with a condensate droplet β (light green) that coexists with the bulk phase α (white): (a) Complete dewetting and (b) partial dewetting of the vesicle membrane (red/purple) by the condensate droplet β; (c) Balanced pressure between the β and the γ phase; (c) Partial wetting and (d) complete wetting of vesicle membrane by β droplet. As in Figure 1, all morphologies involve three aqueous phases, the liquid bulk phase α (white), the condensate phase β forming the droplet (light green), and the inert spectator phase γ (light red) within the vesicle. The contact area between droplet and membrane, which is equal to the surface area of the βγ segment (purple), increases from zero in (a) to the total membrane area in (e).
Figure 3
Figure 3
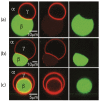
Adhesion morphologies of giant unilamellar vesicles (GUVs) exposed to exterior PEG-dextran solutions that undergo liquid–liquid phase separation into the PEG-rich bulk phase α (black) and the dextran-rich condensate droplet β (green): (a) Partial wetting of vesicle membrane by condensate droplet; (b) Partial wetting of the membrane by the droplet and partial engulfment of the droplet by the membrane; and (c) Complete engulfment of the droplet by the membrane which forms two spherical segments (red) connected by a narrow membrane neck, which is too small to be resolved. The middle column displays the red membrane channel, the right column the green droplet channel. The superimposed red and green channels are shown in the left column. In (a,b), the vesicle membrane exhibits an apparent membrane kink that reflects the limited spatial resolution of the optical microscope [11]. (With permission from ACS).
Figure 4
Figure 4
Phase diagram for aqueous PEG-dextran solutions at room temperature in terms of the weight fractions wd and wp of dextran and PEG. The binodal line (black and red data points) separates the one-phase region at low weight fractions from the two-phase region at higher weight fractions. The dashed line in (a) corresponds to constant weight fraction ratio wd/wp=2. The green dashed lines in (b) represent tie lines in the two-phase region. Each tie line has two end points which lie on the binodal. When the weight fractions are located on a certain tie line, the solution phase separates into a PEG-rich and a dextran-rich phase. The compositions of these two coexisting phases are given by the end points of the tie line as indicated by upward-pointing triangles for the dextran-rich phase and by downward-pointing triangles for the PEG-rich phase. These compositions can be determined from the measured mass densities of the two coexisting phases by constructing isopycnic lines of constant mass densities in the (wd,wp)-plane. The intersections of these isopycnic lines with the binodal provide the comparisons of the coexisting phases. The blue and the red line segments represent isopycnic lines corresponding to the crossed data points (⊕) [16]. (With permission from ACS).
Figure 5
Figure 5
Interfacial tension Σαβ of the liquid–liquid interface between the PEG-rich phase α and the dextran-rich phase β as a function of the polymer concentration Δc(cccr)/ccr where ccr denotes the concentration at the critical demixing point [16]. The red data for the PEG-dextran solutions exhibit the power-law behavior ΣαβΔcμ where the critical exponent μ is close to the mean value μ=3/2. For comparison, the dashed red line corresponds to μ=1.26 based on the hyperscaling relation μ=2ν [49] where ν is the critical exponent of the correlation length. (With permission from ACS).
Figure 6
Figure 6
Phase diagram for a binary mixture of water and solute molecules as a function of solute mole fraction ΦS and solubility ζ of the solute molecules in water [50]: (a) Global phase diagram for 0ΦS1. The phase diagram is mirror symmetric with respect to the dashed vertical line at ΦS=1/2, which implies horizontal tie lines. The critical demixing point (red star) with coordinates (ΦS,ζ)=(1/2,0.746) is located at the crossing point of the dashed vertical line and the binodal line (dark blue), and (b) Phase diagram for 0ΦS0.2 corresponding to the grey-shaded region on the left of panel a. The four data points (open circles) on the binodal line have been determined by molecular dynamics simulations [50]. The binary mixture forms a uniform phase above the binodal line and undergoes phase separation into a water-rich phase α with ΦS<0.5 and a solute-rich phase β with ΦS>0.5. Essentially the same phase diagram is obtained when the solubility is replaced by the temperature.
Figure 7
Figure 7
Phase diagram for condensates enriched in the protein PGL−1 labeled by GFP as observed in P granules of C. elegans cells [32]. The data in (a) were obtained for the wild type, those in (b) after the deletion of the protein PGL−3. The experimental data (diamonds) for the binodals are compared with theoretical binodals based on effective parameters for a binary liquid mixture, compare the phase diagram in Figure 6.
Figure 8
Figure 8
Apparent contact angles θα, θβ, and θγ for the vesicle-droplet systems in Figure 1: Phase separation of (a) exterior solution and (b) interior solution into the two liquid phases α and β. The contact angle θα is the angle between the αβ interface (broken green line) and the αγ membrane segment (red line); the angle θβ is the angle between the αβ interface and the βγ membrane segment (purple line); and θγ is the angle between the αγ and βγ membrane segments. The two contact lines, at which the three surface segments meet, are indicated by the four open circles in panel a and b.
Figure 9
Figure 9
Apparent contact angles θα, θβ, and θγ for the adhesion morphologies in Figure 2: (a) Complete wetting by the α phase, which is equivalent to complete dewetting from the β phase, corresponds to the limit θα=0 and θβ=θγ=π; (b) Partial dewetting from the β phase with θα<θβ; (c) Balanced adhesion with θβ=θα; (d) Partial wetting by the β phase with θβ<θα; and (e) Complete wetting by the β phase, which is equivalent to complete dewetting from the α phase, corresponds to the limit θβ=0 and θα=θγ=π.
Figure 10
Figure 10
Force balance between the interfacial tension Σαβ (green) as well as the two membrane segment tensions Σβγm (purple), and Σαγm (red) for partial wetting by the β droplet which is characterized by the relationship θβ<θα between the apparent contact angles θα and θβ: (a) Each tension generates a force per unit length that pulls at the contact line in the direction of the corresponding arrow. The contact angles θα, θβ, and θγ have been introduced in Figure 8; and (b) In mechanical equilibrium, the three surface tensions must balance and form a triangle. The contact angles θi with i=α,β, and γ are the external angles of this triangle while the internal angles of the triangle are given by ηiπθi [8].
Figure 11
Figure 11
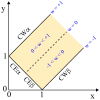
Force balance regime (yellow) and rescaled affinity contrast w as a tension ratios x=Σαγm/Σαβ and y=Σβγm/Σαβ, corresponding to the membrane segment tensions Σαγm and Σβγm divided by the interfacial tension Σαβ. The rescaled affinity contrast w is defined in Equation (18). Within the yellow regime, the three surface tensions can balance each other along the contact line of droplet and vesicle. The force balance regime is bounded from below by the CWβ line of complete wetting of the vesicle membrane by the β phase with w=1 and from above by the CWα line of complete wetting by the α phase with w=+1. The left boundary with y=1x corresponds to complete engulfment of an α droplet (CEα) and to complete engulfment of a β droplet (CEβ), depending on the sign of the affinity contrast w. Balanced adhesion with w=0 (dashed line) divides the force balance regime up into a partial wetting regime by the β phase with 1<w<0 and a partial wetting regime by the α phase with 0<w<+1. The corner point with x=1 and y=0 corresponds to the limit of small segment tensions Σβγm, the corner point with x=0 and y=1 to the limit of small Σαγm. Below the CWβ line, the vesicle avoids any contact with the α phase as in Figure 2e; above the CWα line, the vesicle has no contact with the β phase as in Figure 2a.
Figure 12
Figure 12
Morphological pathways of vesicle-droplet systems within the parameter space defined by the tension ratios x=Σαγm/Σαβ and y=Σβγm/Σαβ as in Figure 11. The green pathway starts from partial wetting of the vesicle membrane by a β droplet and ends up with the complete engulfment of this droplet as in Figure 3c. The red pathway starts from complete wetting of the vesicle membrane by the α phase and then undergoes a complete-to-partial wetting transition, see the example in the next subsection. The purple pathway starts from complete wetting by the α phase and ends up with complete wetting by the β phase. For visual clarity, the different pathways have been drawn as straight lines but can, in general, be arbitrarily curved.
Figure 13
Figure 13
Schematic phase diagram and wetting morphologies of aqueous PEG-dextran solutions within giant vesicles, with the PEG-rich phase α and the dextran-rich phase β: (a) Phase diagram of PEG-dextran solutions at room temperature as in Figure 4. The phase diagram exhibits a one-phase region (white) at low weight fractions wd and wp of the two polymers and a two-phase region (light red and light blue) at higher weight fractions. The boundary between the one-phase and two-phase regions defines the binodal line which contains the critical demixing point (CP, orange). The two-phase region above the binodal is divided up into two subregions, a complete wetting (CW) subregion (light red) close to the critical point and a partial wetting (PW) subregion (light blue) further away from it. The boundary between the CW and PW subregions is provided by a certain tie line (purple dashed line), the precise location of which depends on the lipid composition of the membrane; (b) CW morphology and (c) PW morphology of the vesicle-droplet system corresponding to complete and partial wetting of the vesicle membrane by the α phase, corresponding to the light red and light blue subregions of the phase diagram in panel a [28].
Figure 14
Figure 14
Apparent membrane kinks are low-resolution images of highly curved membrane segments: (a) GUV with an interior compartment that contains a PEG-rich α droplet and a dextran-rich β droplet. The region enframed by the white-dashed rectangle contains one membrane kink which is enlarged in panels b and c; (b) In the confocal microscope, the highly curved membrane segment cannot be resolved; and (c) In the STED image, the smoothly curved segment leads to a contour curvature radius of about 220 nm [52].
Figure 15
Figure 15
Intrinsic contact angles θα* and θβ* describing the force balance along the contact line for a smoothly curved membrane segment: (a) Partial dewetting of the β droplet with θα*<θβ*. The limit of zero θα* corresponds to complete dewetting from the β phase; (b) Balanced adhesion with θα*=θβ*; and (c) Partial wetting by the β droplet with θα*>θβ*. The limit of zero θβ* corresponds to complete wetting by the β phase. The dashed black line represents the common tangent plane of the two membrane segments at the contact line which implies θα*+θβ*=π=180. Same color code for surface segments and tensions as in Figure 9 and Figure 10.
Figure 16
Figure 16
Experimental values of the intrinsic contact angle θα*: (a) Apparent contact angles (CAs) for a batch of 63 GUVs with different volume-to-area ratios v as defined by Equation (48) [5]; (b) The intrinsic contact angle (CA) θα* as obtained from the apparent CAs in panel a by using Equation (47), which leads to cosθα*=0.714±0.075 and θα*44.4; and (c) Intrinsic contact angle θα* measured via STED imaging (half-filled circles) and compared to those calculated from the observed apparent contact angles via Equation (47) (open triangles) [52].
Figure 17
Figure 17
Typical conformations of a single PEG molecule adsorbed to two bilayers with different lipid compositions as observed in atomistic molecular dynamics simulations [9]. The color code for the lipids is blue for DOPC, orange for DPPC, and red for cholesterol. The lipid composition in (a) belongs to the liquid-disordered (Ld) phase, which is enriched in DOPC (blue), the one in (b) to the liquid-ordered (Lo) phase enriched in DPPC (orange). The PEG chains, which consist of 180 monomers, are only weakly bound to the lipid bilayers, with relatively short contact segments and relatively long loops in between two such segments. The two terminal OH groups of the PEG molecule are often bound to the membrane via hydrogen bonds. The same lipid compositions were studied experimentally in [9], but the polymer solution was semi-dilute and the PEG chains formed an adsorption layer close to the overlap concentration.
Figure 18
Figure 18
Three nanotube patterns corresponding to the distinct vesicle morphologies VM-A, VM-B, and VM-C observed along a deflation path that moves the interior PEG-dextran solution into the two-phase coexistence region: Schematic views of horizontal xy-scans (top row) and of vertical xz-scans (bottom row) across an individual vesicle, the volume of which is reduced by osmotic deflation. In all cases, the tubes are filled with the exterior solution (white). For the morphology VM-A, the interior polymer solution is uniform (green), whereas it is phase separated (blue-yellow) for the morphologies VM-B and VM-C, with complete and partial wetting of the membrane by the PEG-rich α phase (yellow). For the VM-B morphology, the nanotubes explore the whole PEG-rich α droplet but stay away from the dextran-rich β droplet (blue). For the VM-C morphology, the nanotubes adhere to the αβ interface between the two aqueous droplets, forming a thin and crowded layer at this interface [9].
Figure 19
Figure 19
Patterns of flexible nanotubes formed by liquid-disordered membranes (red) exposed to aqueous solutions of PEG and dextran. All tubes protrude into the vesicle interior: (a) Disordered pattern of tubes freely suspended within the PEG-rich droplet enclosed by the vesicle, corresponding to the VM-B pattern in Figure 18; and (b) Thin layer of tubes adhering to the αβ interface between the PEG-rich and the dextran-rich phase, providing an example for the VM-C pattern in Figure 18. The width of the fluorescently labeled nanotubes is below the optical diffraction limit and of the order of 100 nm [9].
Figure 20
Figure 20
Nanotubes of GUV membranes with two different lipid compositions, which form a liquid-disordered lipid phase (red) in (a,b) and a liquid-ordered lipid phase (green) in (c,d). The two colors red and green arise from two different fluorescent dyes, which were added to the lipid bilayers using very small mole fractions. All vesicles are exposed to aqueous solutions of PEG 8000 and sucrose without dextran. The interior solution contains only PEG and no sucrose with the initial weight fraction wp=0.0443 of PEG. The vesicles are deflated by exchanging the external medium by a hypertonic solution with no PEG but an increasing weight fraction wsu of sucrose. The vesicles in (a,c) are obtained for wsu=0.0066, those in (b,d) for wsu=0.01. The white scale bars are 10 μm in all panels [9].
Figure 21
Figure 21
Membrane nanotubes protruding from the membranes of the mother vesicles (large red circles) into the vesicle interior in the absence of liquid–liquid phase separation. The vesicle membranes consist of the phospholipid POPC and the glycolipid GM1, with 2 mole % GM1 in (a) and 4 mole % GM1 in (b). The nanotubes are only visible when the membranes are doped with a fluorescently labeled lipid (red), in agreement with the theoretical analysis of micropipette experiments, which imply that the nanotubes have a width of the order of 100 nm. Scale bars: 10 μm [85].
Figure 22
Figure 22
Microscopy images and schematic drawings for partial (a,b) and complete (c,d) engulfment of a condensate droplet β (green) by the membrane (red) of a giant vesicle [11]. For complete engulfment, the membrane forms two spherical segments that are connected by a narrow or closed membrane neck. This neck is not resolvable by conventional confocal microscopy but is indicated in the schematic drawing in (d). The color code in the drawings is the same as in Figure 2.
Figure 23
Figure 23
Partial engulfment of a condensate droplet (green) by the lipid bilayer (purple-grey) of a nanovesicle, as observed in molecular dynamics simulations [30]. The vesicle encloses the aqueous solution γ (blue). Both the nanodroplet and the nanovesicle are immersed in the aqueous bulk phase α (white): (a) Initially, the droplet is well separated from the vesicle which implies that the outer leaflet of the bilayer is only in contact with the α phase; (b) When the droplet is attracted towards the vesicle, it spreads onto the lipid bilayer, thereby forming an increasing contact area with the vesicle membrane; and (c) Partial engulfment of the droplet by the membrane after the vesicle-droplet couple has relaxed to a new stable state. The contact area between bilayer and β droplet defines the βγ segment of the bilayer membrane whereas the rest of the bilayer represents the αγ segment still in contact with the α phase. Vesicle and droplet have a diameter of 37 nm and 11.2 nm, respectively.
Figure 24
Figure 24
Stalled engulfment of large nanodroplets (green) by the vesicle membranes (purple-grey) as observed in molecular dynamics simulations [30]. Droplet engulfment can proceed in an axisymmetric or non-axisymmetric manner, depending on the lipid numbers, Nol and Nil, which are assembled in the outer and inner leaflets of the bilayer membranes: (a) For Nol=5400 and Nil=4700, the engulfment process proceeds in an axisymmetric manner as can be seen from the circular shape of contact line and αβ interface (green); and (b) For Nol=5700 and Nil=4400, both the contact line and the αβ interface attain a non-circular shape which implies a non-axisymmetric morphology of vesicle and droplet. The lipid numbers in (b) are obtained from those in (a) by reshuffling 300 lipids from the inner to the outer leaflet. Vesicle and droplet have a diameter of 37 nm and 19.6 nm, respectively.
Figure 25
Figure 25
Partial engulfment of a condensate nanodroplet (β, dark blue) by a planar bilayer, consisting of lipids with yellow headgroups and green lipid tails as studied by molecular dynamics simulations [29]. The αβ interface between the droplet and the liquid bulk phase α forms a contact line with the bilayer which partitions this bilayer into a βγ segment in contact with the β droplet and into an αγ segment exposed to the α phase as in Figure 1a.
Figure 26
Figure 26
Formation of a non-circular, tight-lipped membrane neck generated by a nanodroplet (dark blue) that adheres to a planar bilayer [29]. This process was induced by a time-dependent reduction of the lateral size L of the simulation box, keeping the box volume fixed: (a) Bottom views of circular membrane segments (yellow) around the αβ interface (blue) of the β droplet, separated by the contact line which is circular at time t=0 μs, strongly non-circular after t=3 μs, and has closed into a tight-lipped shape after t=4 μs; and (b) Side views of the same membrane-droplet morphology, with perpendicular cross-sections through membrane (green) and droplet (blue) taken along the red dashed lines in panel (a). The non-circular shape of the membrane neck is caused by the negative line tension of the contact line and prevents membrane fission. The droplet has a diameter of about 12 nm. Same color code as in Figure 25.
Figure 27
Figure 27
Endocytosis of condensate droplet (green) with complete engulfment of the droplet followed by division of the nanovesicle membrane (purple-grey) into two nested daughter vesicles as observed in molecular dynamics simulations [30]. In this example, the bilayer membrane consists of 5500 lipids in the outer and 4600 lipids in the inner leaflet. The contact line between membrane and droplet has a positive line tension λ+7kBT/d. The membrane neck closes at t=4 μs and undergoes fission at t=9 μs, generating a small intraluminal vesicle around the droplet. The undivided nanovesicle has a size of 37 nm, the droplet has a diameter of 11.2 nm.

References

    1. Lipowsky R. Remodeling of Membrane Shape and Topology by Curvature Elasticity and Membrane Tension. Adv. Biol. 2022;6:2101020. doi: 10.1002/adbi.202101020. - DOI - PubMed
    1. Bassereau P., Sens P., editors. Physics of Biological Membranes. Springer Nature; Cham, Switzerland: 2018.
    1. Dimova R., Marques C., editors. The Giant Vesicle Book. Taylor & Francis; Boca Raton, FL, USA: 2020.
    1. Young T. An Essay on the Cohesion of Fluids. Philos. Trans. R. Soc. Lond. 1805;95:65–87.
    1. Kusumaatmaja H., Li Y., Dimova R., Lipowsky R. Intrinsic contact angle of aqueous phases at membranes and vesicles. Phys. Rev. Lett. 2009;103:238103. doi: 10.1103/PhysRevLett.103.238103. - DOI - PubMed

LinkOut - more resources