. 2023 Jan 31;13(2):210.
doi: 10.3390/metabo13020210.

Integrating Metabolomics and Gene Expression Underlying Potential Biomarkers Compounds Associated with Antioxidant Activity in Southern Grape Seeds

Affiliations

Integrating Metabolomics and Gene Expression Underlying Potential Biomarkers Compounds Associated with Antioxidant Activity in Southern Grape Seeds

Ahmed G Darwish et al. Metabolites. .

Abstract

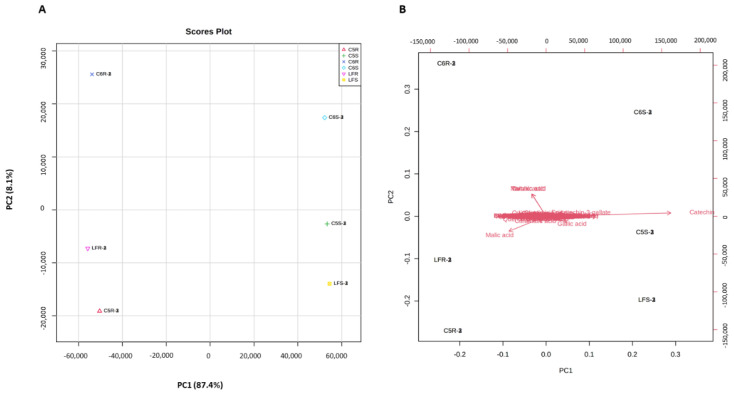
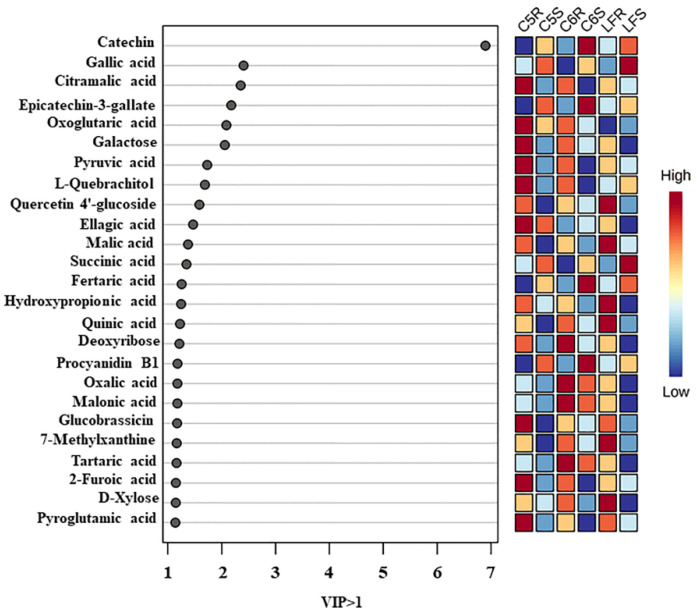
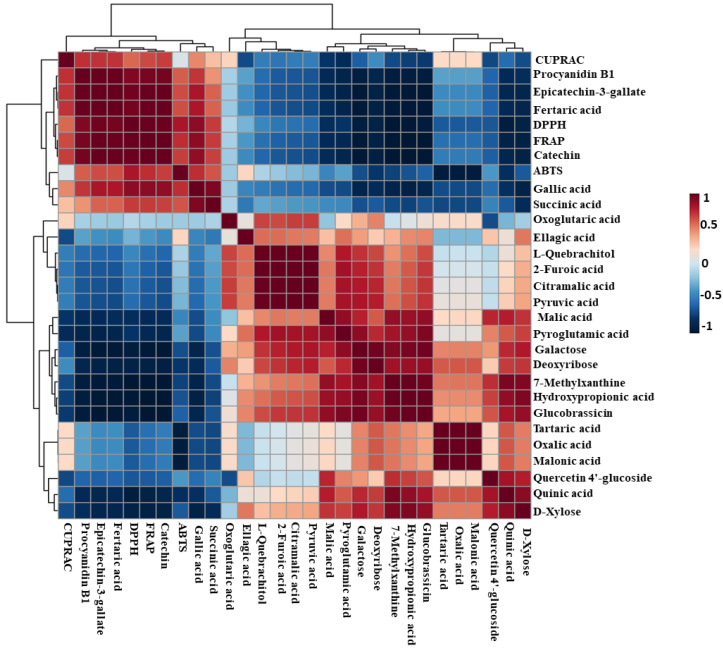
Different southern grape (Muscadine) genotypes (Muscadinia rotundifolia Michx.) were evaluated for their contents of metabolites in ripe berries. The metabolome study identified 331 metabolites in ripening skin and seed tissues. The major chemical groups were organic acids, fatty acyls, polyketides, and organic heterocycle compounds. The metabolic pathways of the identified metabolite were mainly arginine biosynthesis, D-glutamine, D-glutamate metabolism, alanine, aspartate metabolism, aminoacyl-tRNA biosynthesis, and citrate cycle. Principal component analysis indicated that catechin, gallic acid, and epicatechin-3-gallate were the main metabolites existing in muscadine seed extracts. However, citramalic and malic acids were the main metabolites contributing to muscadine skin extracts. Partial least-squares discriminant analysis (VIP > 1) described 25 key compounds indicating the metabolome in muscadine tissues (skin and seed). Correlation analysis among the 25 compounds and oxidation inhibition activities identified five biomarker compounds that were associated with antioxidant activity. Catechin, gallic acid, epicatechin-3-gallate, fertaric acid, and procyanidin B1 were highly associated with DPPH, FRAP, CUPRAC, and ABTS. The five biomarker compounds were significantly accumulated in the seed relative to the skin tissues. An evaluation of 15 antioxidant-related genes represented by the 3-dehydroquinate dehydratase (DHD), shikimate kinase (SK), chalcone synthase (CHS), anthocyanidin reductase (ANR), laccase (LAC), phenylalanine ammonia-lyase (PAL), dihydroflavonol 4-reductase (DFR), 3-dehydroquinate synthase (DHQS), chorismate mutase (CM), flavanone-3-hydroxylase (F3H), cinnamoyl-CoA reductase (CCR), cinnamyl alcohol dehydrogenase (CAD), leucoanthocyanidin reductase (LAR), gallate 1-β-glucosyltransferase (UGT), and anthocyanidin 3-O-glucosyltransferase (UFGT) encode critical enzymes related to polyphenolics pathway throughout four developmental stages (fruit-set FS, véraison V, ripe-skin R, and ripe-seed; S) in the C5 genotype demonstrated the dramatic accumulation of all transcripts in seed tissue or a developmental stage-dependent manner. Our findings suggested that muscadine grape seeds contain essential metabolites that could attract the attention of those interested in the pharmaceutical sector and the plant breeders to develop new varieties with high nutraceutical value.

Keywords: antioxidant; biomarker compounds; genes; metabolome; muscadine genotypes; seed.


Conflict of interest statement

The authors declare no conflict of interest.

Figures

Figure 1
Figure 1
(A) A representative image of muscadine grape genotypes C5, Latefry, and C6. DPPH and ABTS (B), FRAP, and CUPRAC (C) activities. During ripening (R), and seed (S) stages, antioxidant activities of muscadine grape genotypes were determined using DPPH and ABTS (B), FRAP, and CUPRAC (C) assays. The experiments were carried out in three biological replicates, and each replicate was repeated three times (n = 9). The data represent the mean values ± SD (n = 3).
Figure 2
Figure 2
(A) Bar chart and (B) interactive network chart metabolite set enrichment analysis (MSEA) were conducted to classify the identified compounds in ripe muscadine berries based on KEGG human metabolic pathways. Colors in the bar plot describe the p-value. The red and orange colors signify the high and low values, respectively. The lines indicate the enrichment ratio computed by hits/expected, where hits = observed hits and expected = expected hits. The red, orange, and yellow colors in the interactive network chart designate each metabolic pathway relative to the total number of compounds.
Figure 3
Figure 3
(A) Bar chart and (B) interactive pie chart of the chemical classification of ripe muscadine berry metabolites in skin and seed tissues using metabolite set enrichment analysis (MSEA). Colors in the bar plot describe the p-value. The red and orange colors signify the high and low values, respectively. The lines indicate the enrichment ratio, which was computed by hits/expected, where hits = observed hits and expected = expected hits. The colors in the interactive pie chart designate each chemical group relative to the total number of compounds.
Figure 4
Figure 4
PCA 2D score plot (A) and biplot (B) of muscadine skin and seeds metabolites. The muscadine genotypes and stages of development demonstrated by C5R, C5S, C6R, C6S, LFR, and LFS. The red (Δ) represents C5-R, green (+) represents C5-S, purple (×) represents C6-R, blue (◊) represents C6-S, pink (Δ) LF-R, and the yellow () represents LF-S.
Figure 5
Figure 5
The weighted sum of absolute regression coefficients (coef.) of candidate metabolites (VIP > 1) of ripe muscadine skin and seed. The colored boxes on the right indicate the relative concentrations of the corresponding metabolite in each group under study.
Figure 6
Figure 6
Heatmap analysis of candidate metabolites (VIP > 1) that were obtained by partial least-squares–discriminant analysis (PLS-DA) and antioxidant activities of ripe muscadine berries. Each column refers to the muscadine genotype with seed or skin tissues, and each row indicates the metabolites and antioxidant activities. The yellow and blue colors in the plot describe high and low intensities, and the values range from −2 to +2. The higher yellow color intensity (from +1 to +2 values) represents the greater metabolite contents and antioxidant activities. By contrast, the higher blue color intensity (from −1 to −2 values) describes the lower metabolite contents and antioxidant activities.
Figure 7
Figure 7
Heatmap of Pearson correlation between candidate metabolites (VIP > 0.4) with antioxidant activities of muscadine genotypes at selected developmental stages. Correlation values range from −1 to +1. The values close to +1 represent the higher positive correlation, whereas values closer to zero mean no linear trend between the variables; values close to −1 represent the negative correlation between variables.
Figure 8
Figure 8
The intensity of absorbance (MAU.s) values of muscadine ripe and seed biomarker compounds among different genotypes.
Figure 9
Figure 9
Expression profile of the 15 selected muscadine genes quantified by qPCR related to antioxidant activity in the C5 genotype at different stages of berry development. The genes encode DHQS 3-dehydroquinate synthase, DHD 3-dehydroquinate dehydratase, SK shikimate kinase, CM chorismate mutase, PAL phenylalanine ammonia-lyase, CCR cinnamoyl-CoA reductase, CAD cinnamyl alcohol dehydrogenase, CHS chalcone synthase, F3H flavanone-3-hydroxylase, DFR dihydroflavonol 4-reductase, LAR leucoanthocyanidin reductase, ANR anthocyanidin reductase, UGT gallate 1-β-glucosyltransferase, UFGT anthocyanidin 3-O-glucosyltransferase, and LAC laccase. The y-axis represents the mean expression level (±SD) determined by qPCR. The x-axis in each chart represents the developmental stages (fruit-set FS, véraison V, ripe-skin R, and ripe-seed S). The level of expression mean was calculated from three bio/tech replicates (n = 9). Standard curves were used to calculate the number of target gene molecules/samples and standardized relative to the expression of actin and EF1.
Figure 10
Figure 10
The pathway shows the different genes involved in biomarker compounds biosynthesis pathways. DHQS 3-dehydroquinate synthase, DHD 3-dehydroquinate dehydratase, SK shikimate kinase, CM chorismate mutase, PAL phenylalanine ammonia-lyase, CCR cinnamoyl-CoA reductase, CAD cinnamyl alcohol dehydrogenase, CHS chalcone synthase, F3H flavonoid 3′- hydroxylase, DFR dihydroflavonol 4-reductase, LAR leucoanthocyanidin reductase, ANR anthocyanidin reductase, UGT UDP-glycosyltransferase, UFGT UDP-glucose: flavonoid 3-O-glucosyltransferase, and LAC laccase.

References

    1. Gupta M., Dey S., Marbaniang D., Pal P., Ray S., Mazumder B. Grape seed extract: Having a potential health benefits. J. Food Sci. Technol. 2020;57:1205–1215. doi: 10.1007/s13197-019-04113-w. - DOI - PMC - PubMed
    1. Sochorova L., Prusova B., Jurikova T., Mlcek J., Adamkova A., Baron M., Sochor J. The Study of Antioxidant Components in Grape Seeds. Molecules. 2020;15:3736. doi: 10.3390/molecules25163736. - DOI - PMC - PubMed
    1. Jayaprakasha G.K., Singh R.P., Sakariah K.K. Antioxidant activity of grape seed (Vitis vinifera) extracts on peroxidation models in vitro. Food Chem. 2021;73:285–290. doi: 10.1016/S0308-8146(00)00298-3. - DOI
    1. Grases F., Prieto R.M., Fernández-Cabot R.A. Effect of consuming a grape seed supplement with abundant phenolic compounds on the oxidative status of healthy human volunteers. Nutr. J. 2015;14:94. doi: 10.1186/s12937-015-0083-3. - DOI - PMC - PubMed
    1. Grimplet J., Deluc L.G., Tillett R.L., Wheatley M.D., Schlauch K.A., Cramer G.R., Cushman J.C. Tissue-specific mRNA expression profiling in grape berry tissues. BMC Genom. 2007;8:187. doi: 10.1186/1471-2164-8-187. - DOI - PMC - PubMed

LinkOut - more resources