A Multimodal Desorption Electrospray Ionisation Workflow Enabling Visualisation of Lipids and Biologically Relevant Elements in a Single Tissue Section
- PMID: 36837881
- PMCID: PMC9964958
- DOI: 10.3390/metabo13020262
A Multimodal Desorption Electrospray Ionisation Workflow Enabling Visualisation of Lipids and Biologically Relevant Elements in a Single Tissue Section
Abstract
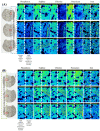
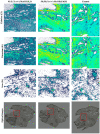
The colocation of elemental species with host biomolecules such as lipids and metabolites may shed new light on the dysregulation of metabolic pathways and how these affect disease pathogeneses. Alkali metals have been the subject of extensive research, are implicated in various neurodegenerative and infectious diseases and are known to disrupt lipid metabolism. Desorption electrospray ionisation (DESI) is a widely used approach for molecular imaging, but previous work has shown that DESI delocalises ions such as potassium (K) and chlorine (Cl), precluding the subsequent elemental analysis of the same section of tissue. The solvent typically used for the DESI electrospray is a combination of methanol and water. Here we show that a novel solvent system, (50:50 (%v/v) MeOH:EtOH) does not delocalise elemental species and thus enables elemental mapping to be performed on the same tissue section post-DESI. Benchmarking the MeOH:EtOH electrospray solvent against the widely used MeOH:H2O electrospray solvent revealed that the MeOH:EtOH solvent yielded increased signal-to-noise ratios for selected lipids. The developed multimodal imaging workflow was applied to a lung tissue section containing a tuberculosis granuloma, showcasing its applicability to elementally rich samples displaying defined structural information.
Keywords: biological tissue analysis; correlative imaging; desorption electrospray ionisation mass spectrometry; ion beam analysis; multimodal imaging.
Conflict of interest statement
The authors declare no conflict of interest.
Figures


References
-
- Walter A., Paul-Gilloteaux P., Plochberger B., Sefc L., Verkade P., Mannheim J.G., Slezak P., Unterhuber A., Marchetti-Deschmann M., Ogris M., et al. Correlated Multimodal Imaging in Life Sciences: Expanding the Biomedical Horizon. Front. Phys. 2020;8:47. doi: 10.3389/fphy.2020.00047. - DOI
-
- Touboul D., Roy S., Germain D.P., Chaminade P., Brunelle A., Laprévote O. MALDI-TOF and cluster-TOF-SIMS imaging of Fabry disease biomarkers. Int. J. Mass. Spectrom. 2007;260:158–165. doi: 10.1016/j.ijms.2006.09.027. - DOI
-
- Flint L.E., Hamm G., Ready J.D., Ling S., Duckett C.J., Cross N.A., Cole L.M., Smith D.P., Goodwin R.J.A., Clench M.R. Characterization of an Aggregated Three-Dimensional Cell Culture Model by Multimodal Mass Spectrometry Imaging. Anal. Chem. 2020;92:12538–12547. doi: 10.1021/acs.analchem.0c02389. - DOI - PMC - PubMed
Grants and funding
LinkOut - more resources
Full Text Sources

