Review
. 2023 Jan 21;14(2):281.
doi: 10.3390/mi14020281.

Highly-Sensitive, Label-Free Detection of Microorganisms and Viruses via Interferometric Reflectance Imaging Sensor

Affiliations
Review

Highly-Sensitive, Label-Free Detection of Microorganisms and Viruses via Interferometric Reflectance Imaging Sensor

Monireh Bakhshpour-Yucel et al. Micromachines (Basel). .

Abstract

Pathogenic microorganisms and viruses can easily transfer from one host to another and cause disease in humans. The determination of these pathogens in a time- and cost-effective way is an extreme challenge for researchers. Rapid and label-free detection of pathogenic microorganisms and viruses is critical in ensuring rapid and appropriate treatment. Sensor technologies have shown considerable advancements in viral diagnostics, demonstrating their great potential for being fast and sensitive detection platforms. In this review, we present a summary of the use of an interferometric reflectance imaging sensor (IRIS) for the detection of microorganisms. We highlight low magnification modality of IRIS as an ensemble biomolecular mass measurement technique and high magnification modality for the digital detection of individual nanoparticles and viruses. We discuss the two different modalities of IRIS and their applications in the sensitive detection of microorganisms and viruses.

Keywords: biomass measurement; interferometric reflectance imaging sensor; nanoparticle detection; pathogenic microorganisms; sensitive detection; viruses.


Conflict of interest statement

The authors declare no conflict of interest.

Figures

Figure 1
Figure 1
Imaging and sizing of H1N1 influenza virus. (a) IRIS image of captured viruses on the chip surface; (b) SEM photo of the same area monitored with IRIS; (c) size distribution of viruses measured by IRIS [20]. Reproduced with permission from G.G. Daaboul, A. Yurt, X. Zhang, G.M. Hwang, B.B. Goldberg, M.S. Ünlü, Nano Letters; Published by American Chemical Society, 2010.
Figure 2
Figure 2
Determining the specificity of the method for VSV. VSV detection (green circles) was seen for concentration 0 and 106 PFU/mL [31]. Reproduced with permission from A.P. Reddington, J.T. Trueb, D.S. Freedman, A. Tuysuzoglu, G.G. Daaboul, C.A. Lopez, W.C. Karl, J.H. Connor, H. Fawcett, M.S. Ünlü, IEEE Transactions on Biomedical Engineering; Published by IEEE, 2013.
Figure 3
Figure 3
Dual detection of pseudotyped EBOV and MARV from fetal bovine serum contaminated with E. coli K12 at the concentration of 106 CFU/mL. Scheme of (a) preparation of single and dual virus spiked samples; (b) the results obtained for single virus detection and dual detection at different virus concentrations; (c) the response obtained with anti-Ebola spots for FBS and bacteria spiked FBS samples was similar, as indicated by the linear regression fitting the scatter plot of one sample type versus the other [39]. Reproduced with permission from G.G. Daaboul, C.A. Lopez, J. Chinnala, B.B. Goldberg, J.H. Connor, M.S. Ünlü, ACS Nano; Published by American Chemical Society, 2014.
Figure 4
Figure 4
Discrimination of viruses with genome length. (a) The sizing curve that was composed with the responses obtained for varying lengths of a cylindrical particle with constant width, was used to calculate the dimension of virus particles based on VSV captured on the SP-IRIS chip surface. (b) The virus lengths measured with SP-IRIS for wtVSV, DIP, MARV, EBOV (Z), EBOV (ZS) [39]. Reproduced with permission from G.G. Daaboul, C.A. Lopez, J. Chinnala, B.B. Goldberg, J.H. Connor, M.S. Ünlü, ACS Nano; Published by American Chemical Society, 2014.
Figure 5
Figure 5
(a) Photos of IRIS chip and microfluidic cartridge. (b) Schematization of ssDNA spotted sensor area and antibody immobilization on the chip surface through DNA hybridization [44]. Reproduced with permission from E. Seymour, G.G. Daaboul, X. Zhang, S.M. Scherr, N.L. Ünlü, J.H. Connor, M.S. Ünlü, Analytical Chemistry; Published by American Chemical Society, 2015.
Figure 6
Figure 6
Comparison of the detection efficiency of directly immobilized VSV-pseudotyped EBOV antibodies with DNA-conjugated types. The measurement of signals obtained by captured viruses with SP-IRIS at different virus concentrations after (a) 15 min incubation (b) 60 min incubation [44]. Reproduced with permission from E. Seymour, G.G. Daaboul, X. Zhang, S.M. Scherr, N.L. Ünlü, J.H. Connor, M.S. Ünlü, Analytical Chemistry; Published by American Chemical Society, 2015.
Figure 7
Figure 7
Multiplexed and real-time virus detection with SP-IRIS on a chip designed with DNA conjugated antibodies. (A) The SP-IRIS chip surface spotted with three different DNA sequences and incubation with DNA conjugated antibodies (anti-EBOV, anti-MARV, anti-LASV). (B) Virus density of each DNA conjugated antibody spots following sample flow [48]. Reproduced with permission from E. Seymour, N.L. Ünlü, E.P. Carter, J.H. Connor, M.S. Ünlü, ACS Sensor; Published by American Chemical Society, 2021.
Figure 8
Figure 8
Schematic representation of new generation. (A) IRIS chip; (B) Si-based IRIS cartridge [49]. Reproduced with permission from A.Y. Ozkumur, F.E. Kanik, J.T. Trueb, C. Yurdakul, M.S. Ünlü, IEEE Journal of Selected Topics in Quantum Electronics; Published by IEEE, 2019.
Figure 9
Figure 9
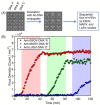
Schematization of IRIS chip surface decorated in an antibody array format with anti-E.coli and bovine serum albumin as a control. Experiment stage: incubation of spotted IRIS chips with 1 mL of serial E. coli concentrations in the 24-well plate [33]. Reproduced with permission from N. Zaraee, A.M. Bhuiya, E.S. Gong, M.T. Geib, N.L. Ünlü, A.Y. Ozkumur, J.R. Dupuis, M.S. Ünlü, Biosensors and Bioelectronics; Published by Elsevier, 2020.

References

    1. Leonard P., Hearty S., Brennan J., Dunne L., Quinn J., Chakraborty T., O’Kennedy R. Advances in biosensors for detection of pathogens in food and water. Enzym. Microb. Technol. 2003;32:3–13. doi: 10.1016/S0141-0229(02)00232-6. - DOI
    1. Zhao X.H., Lin C.W., Wang J., Oh D.H. Advances in rapid detection methods for foodborne pathogens. J. Microbiol. Biotechnol. 2014;24:297–312. doi: 10.4014/jmb.1310.10013. - DOI - PubMed
    1. Yi J., Xiao W., Li G., Wu P., He Y., Chen C., He Y., Ding P., Kai T. The research of aptamer biosensor technologies for detection of microorganism. Appl. Microbiol. Biotechnol. 2020;104:9877–9890. doi: 10.1007/s00253-020-10940-1. - DOI - PubMed
    1. Alahi M., Mukhopadhyay S.C. Detection methodologies for pathogen and toxins: A review. Sensors. 2017;17:1885. doi: 10.3390/s17081885. - DOI - PMC - PubMed
    1. Garibyan L., Avashia N. Research techniques made simple: Polymerase chain reaction (PCR) J. Investig. Dermatol. 2013;133:6. doi: 10.1038/jid.2013.1. - DOI - PMC - PubMed

LinkOut - more resources