. 2023 Jan 27;14(2):323.
doi: 10.3390/mi14020323.

Zwitterionic Polymer Coated and Aptamer Functionalized Flexible Micro-Electrode Arrays for In Vivo Cocaine Sensing and Electrophysiology

Affiliations

Zwitterionic Polymer Coated and Aptamer Functionalized Flexible Micro-Electrode Arrays for In Vivo Cocaine Sensing and Electrophysiology

Bingchen Wu et al. Micromachines (Basel). .

Abstract

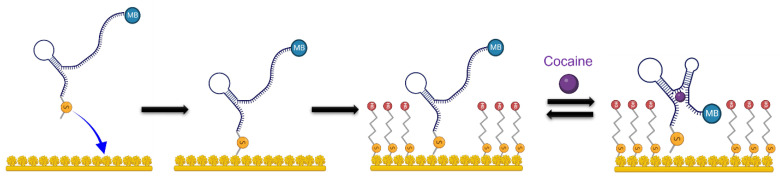
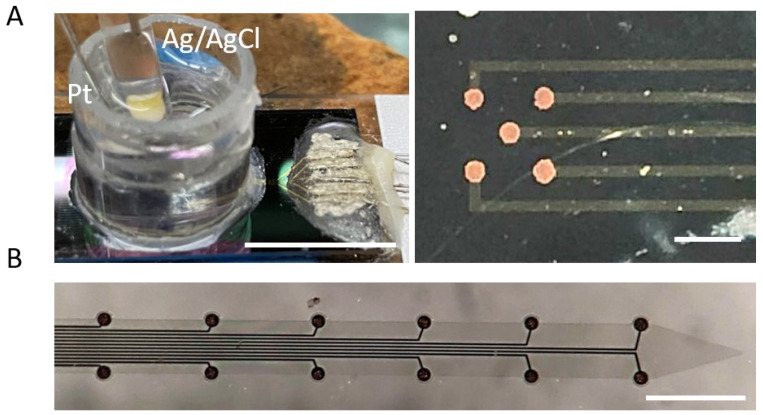
The number of people aged 12 years and older using illicit drugs reached 59.3 million in 2020, among which 5.2 million are cocaine users based on the national data. In order to fully understand cocaine addiction and develop effective therapies, a tool is needed to reliably measure real-time cocaine concentration and neural activity in different regions of the brain with high spatial and temporal resolution. Integrated biochemical sensing devices based upon flexible microelectrode arrays (MEA) have emerged as a powerful tool for such purposes; however, MEAs suffer from undesired biofouling and inflammatory reactions, while those with immobilized biologic sensing elements experience additional failures due to biomolecule degradation. Aptasensors are powerful tools for building highly selective sensors for analytes that have been difficult to detect. In this work, DNA aptamer-based electrochemical cocaine sensors were integrated on flexible MEAs and protected with an antifouling zwitterionic poly (sulfobetaine methacrylate) (PSB) coating, in order to prevent sensors from biofouling and degradation by the host tissue. In vitro experiments showed that without the PSB coating, both adsorption of plasma protein albumin and exposure to DNase-1 enzyme have detrimental effects on sensor performance, decreasing signal amplitude and the sensitivity of the sensors. Albumin adsorption caused a 44.4% sensitivity loss, and DNase-1 exposure for 24 hr resulted in a 57.2% sensitivity reduction. The PSB coating successfully protected sensors from albumin fouling and DNase-1 enzyme digestion. In vivo tests showed that the PSB coated MEA aptasensors can detect repeated cocaine infusions in the brain for 3 hrs after implantation without sensitivity degradation. Additionally, the same MEAs can record electrophysiological signals at different tissue depths simultaneously. This novel flexible MEA with integrated cocaine sensors can serve as a valuable tool for understanding the mechanisms of cocaine addiction, while the PSB coating technology can be generalized to improve all implantable devices suffering from biofouling and inflammatory host responses.

Keywords: aptasensor; electrophysiology; in vivo cocaine sensing; zwitterionic polymer.


Conflict of interest statement

The authors declare that they have no known competing financial interest or personal relationships that could have appeared to influence the work reported in this paper.

Figures

Scheme 1
Scheme 1
Schematic demonstration of the standard self-assembly process for aptasensors and their detection mechanism. Fuzzy Au was first deposited on electrode sites. Aptamers were then immobilized on the fuzzy Au surface after which an additional self-assemble monolayer of 6-mercapto-1-hexanol (MCH) was immobilized as the passivation layer. Upon binding of the cocaine, the conformation change of aptamer brings the MB tag closer to the surface, resulting in higher current response.
Scheme 2
Scheme 2
Schematic demonstration of PSB deposition on standard cocaine aptasensors. The fabricated standard cocaine aptasensors were immersed in 10 mM Tris buffer containing 2 mg/mL of PSB polymer for 2 h for coating deposition. The PSB polymers were anchored to the hydroxyl groups on the sensor surface through their catechol functional groups [74].
Figure 1
Figure 1
Optical images of the in vitro and in vivo MEAs. (A) In vitro silicon MEA chip assembly. Left: A 1 mL cloning ring was glued on the silicon MEA chip enclosing the microelectrode sites. Stainless-steel wires and silver paste were used for connecting the contact pads of the MEA chip to the potentiostat. The electrochemical cell was set up with a Pt counter electrode and Ag/AgCl reference, scale bar = 0.5 cm. Right: the 5 microelectrode sites are distributed in the 4 corners and the center of a 300 × 300 µm square. Scale bar = 300 µm. (B) Flexible SU-8 thin film MEA for in vivo experiments. 12 Au sites (35 µm diameter) with a spacing of 300 µm are distributed along both edges of the shank. Scale bar 300 µm.
Figure 2
Figure 2
In vitro protein fouling assay for testing effects of different passivation layers. Hydrophobic hexanethiol (HT) is compared with standard hydrophilic 6-mercapto-1-hexanol (MCH). (A) Nyquist plot before and after albumin exposure for the HT group. The aptasensor became more resistive after exposed to albumin. (B) Nyquist plot before and after albumin exposure for the MCH group. The aptasensor also became more resistive after being exposed to albumin. (C) SWV waveform of the HT group before and after albumin exposure. A clear peak amplitude drop can be observed. (D) SWV waveform of the MCH group before and after albumin exposure. A background current drop can be observed. (E) Quantification of peak current for the HT group. Peak current for both blank PBS and 10 mM cocaine showed significant decrease in amplitude after albumin exposure. One-way ANOVA, n = 5. (F) Quantification of peak current for the MCH group. Peak current for both blank PBS and 10 mM cocaine also showed a significant decrease in amplitude after albumin exposure. One-way ANOVA, n = 19. (G) Percent current response to 10 mM cocaine for the HT group after albumin exposure. Sensors showed significantly decreased signal towards cocaine after protein exposure. Welch t test, n = 5. (H) Percent current response to 10 mM cocaine for the MCH group after albumin exposure. Sensors also showed significantly decreased signal towards cocaine after protein exposure. Welch t test, n = 19. * p < 0.05, ** p < 0.01, *** p < 0.0005, **** p < 0.0001. All data are represented by mean + SEM. (AD) SEM removed for clarity.
Figure 3
Figure 3
In vitro DNase exposure test. The aptasensors’ performance was compared before and after exposure to DNase-1. (A) Nyquist plot of sensors before and after DNase-1 exposure. Sensors became more resistive after DNase-1 exposure. (B) SWV waveform of sensors before and after DNase-1 exposure. A decrease in background current and MB reduction peak size can be seen. (C) Quantification of peak current. A significant amplitude decrease is observed for both blank and 10 mM cocaine response after exposure to DNase-1. One-way ANOVA, n = 8. (D) Percent current response characterization. The sensor’s sensitivity towards cocaine significantly decreased after being exposed to DNase-1. Welch’s t test, n = 8. *** p < 0.0005, **** p < 0.0001. all data mean + sem. (A,B) SEM removed for clarity.
Figure 4
Figure 4
PSB coating characterization with FTIR and calibration curves. Pre-synthesized PSB polymers were dissolved in 10 mM Tris buffer and the aptamer functionalized MEAs were submerged in PSB solution for 2 h at room temperature. (A) FTIR spectrum of PSB coating. A Au coated 1 cm × 0.5 cm Si wafer was used for FTIR characterization of the coating. The blue arrow indicates characteristic peaks of C-O (1085–1050 cm−1) from MCH and C=O (1720–1706 cm−1) bond from aptamers. The green arrow indicates C=O (1680 cm−1), S=O (1372–1335 cm−1) from the PSB polymer. (B) The calibration curves of non-coated and PSB coated sensors in vitro. The coating did not affect sensors’ sensitivity. Mean ± SD, Modified Langmuir model, n = 6.
Figure 5
Figure 5
The effects of albumin adsorption and DNase-1 treatment on sensors with PSB coating in vitro. (A) SWV waveform of PSB coated sensors before and after albumin exposure. Fluctuations in background current and peak size changes were observed. (B) Quantified peak current comparison. Sensors showed significantly decreased current amplitude for both blank and 10 mM cocaine solution after exposure to albumin. One-way ANOVA, n = 25. (C) Percent current response quantification. PSB coated sensors showed no change in sensitivity towards cocaine after albumin exposure. Welch’s t test, n = 25. (D) SWV waveform of PSB coated sensors before and after DNase-1 exposure. An increase in background current was observed. (E,F) Quantified peak current and percent current response comparison. PSB coated sensors showed no signs of degradation after DNase exposure. Current amplitude (One-way ANOVA, n = 8) (E) and percent current response (Welch’s t test, n = 8) (F) were stable after exposure to DNase. **** p < 0.0001. all data mean + SEM. (A,D) SEM removed for visual clarity.
Figure 6
Figure 6
In vivo direct cocaine infusion surgery set-up, data analysis, and representative electrophysiology recordings of single unit waveforms. (A) A three-electrode set-up was used for in vivo cocaine sensing. Two holes were drilled on the contralateral side for placement of an Ag/AgCl reference electrode and a stainless-steel screw counter electrode. The flexible MEA shank was implanted 5 mm deep in the striatum using the capillary as shuttle. (B) Average percent current response to repeated cocaine injection over 200 min across 3 MEAs implanted in 3 rats. The red dashed line indicates the timing of repeated cocaine infusion every 30 min. The blue shaded regions indicate the 5 min time bins used to average the current response at different time points. Total number of electrode sites n = 9. (C) Average percent current response every 0.5 h from 3 implanted MEAs in 3 rats. At the 2 h and the 2.5 h time point, a significant increase in response was observed. Total number of electrode sites n = 9, * p < 0.05, ** p < 0.01. mean + SEM. One-way ANOVA, Dunnett’s test, 0.5 h response set as control. (D) Scheme of electrode site mapping, location of the capillary outlet, and representative single unit waveforms from electrophysiology recordings. The probe shank is 150 µm wide and vertical spacing of electrode sites is 300 µm. Capillary outlet is aligned with channel 1 and channel 2. channel 5 and 6 and | channel 7 and 8 are groups of electrodes at the same depth but recorded different units that have distinct waveforms.

Similar articles

Cited by

References

    1. Key Substance Use and Mental Health Indicators in the United States: Results from the 2020 National Survey on Drug Use and Health Center for Behavioral Health Statistics and Quality. Substance Abuse and Mental Health Services Administration; Rockville, MD, USA: 2021.
    1. Graham J., Leonard J., Banerji S., Wang G.S. Illicit Drug Exposures in Young Pediatric Patients Reported to the National Poison Data System, 2006–2016. J. Pediatr. 2020;219:254–258. doi: 10.1016/j.jpeds.2019.11.004. - DOI - PubMed
    1. Nestler E.J. The neurobiology of cocaine addiction. Sci. Pract. Perspect. 2005;3:4–10. doi: 10.1151/spp05314. - DOI - PMC - PubMed
    1. Carboni E., Imperato A., Perezzani L., Di Chiara G. Amphetamine, cocaine, phencyclidine and nomifensine increase extracellular dopamine concentrations preferentially in the nucleus accumbens of freely moving rats. Neuroscience. 1989;28:653–661. doi: 10.1016/0306-4522(89)90012-2. - DOI - PubMed
    1. Hollander J.A., Carelli R.M. Cocaine-associated stimuli increase cocaine seeking and activate accumbens core neurons after abstinence. J. Neurosci. 2007;27:3535–3539. doi: 10.1523/JNEUROSCI.3667-06.2007. - DOI - PMC - PubMed

LinkOut - more resources