. 2023 Jan 28;11(2):332.
doi: 10.3390/microorganisms11020332.

eDNA Provides a Scaffold for Autoaggregation of B. subtilis in Bacterioplankton Suspension

Affiliations

eDNA Provides a Scaffold for Autoaggregation of B. subtilis in Bacterioplankton Suspension

Iztok Dogsa et al. Microorganisms. .

Abstract

The self-binding of bacterial cells, or autoaggregation, is, together with surface colonization, one of the first steps in the formation of a mature biofilm. In this work, the autoaggregation of B. subtilis in dilute bacterial suspensions was studied. The dynamics of cell lysis, eDNA release, and bacterial autoaggregate assembly were determined and related to the spatial autocorrelation of bacterial cells in dilute planktonic bacterial suspensions. The non-random distribution of cells was associated with an eDNA network, which stabilized the initial bacterial cell-cell aggregates. Upon the addition of DNase I, the aggregates were dispersed. The release of eDNA during cell lysis allows for the entrapment of bacterial drifters at a radius several times the size of the dying bacteria. The size of bacterial aggregates increased from 2 to about 100 μm in diameter in dilute bacterial suspensions. The results suggest that B. subtilis cells form previously unnoticed continuum of autoaggregate structures during planktonic growth.

Keywords: B. subtilis; autoaggregates; biofilm; eDNA; plankton.


Conflict of interest statement

The authors declare no conflict of interest. The funders had no role in the design of the study, in the collection, analyses, or interpretation of data, in the writing of the manuscript, or in the decision to publish the results.

Figures
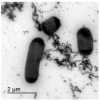
Figure 1
Figure 1
TEM of B. subtilis wt microcolony in the exponential growth phase after 2.5 h of incubation. Bacterial cells are interconnected via the extracellular matrix components.
Figure 2
Figure 2
Release of cytosol material during cell lysis. (A,B) SEM micrograph of B. subtilis 3610 wt cells in SYM medium grown during cell lysis. The white arrow indicates rupture at the pole. Scale bar represents 1 μm. (C) DIC micrograph of the lysing cell, (D) TOTO-1 fluorescence micrograph od the same lysing cell, (E) an overlay of the DIC and fluorescence image. (F) The released fluorescence nucleic material from the dying cell (small fluorescence particles, filament structures, fuzzy cloud nucleic acid material) interconnecting the bacteria (the bright objects). To obtain the faint fluorescence structures interconnecting neighbouring bacteria, the micrographs were overexposed.
Figure 3
Figure 3
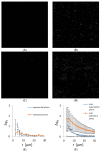
Positions of individual bacteria on microscopy images of size 400 µm × 400 µm grown in CM growth medium. (A) Cells in the early exponential growth phase, (B) early exponentially grown cells that were concentrated 5-fold, (C) cells in the early stationary growth phase, (D) the early stationary cells concentrated five folds. Scale bar corresponds to 20 µm. (E) Pair-wise (autocorrelation) function (Equation (3)) applied to bacterial positions in microscopy images corresponding to an area of 20 times of the areas depicted in panels (AD). (F) Autocorrelation of 5-fold concentrated bacterial suspension. For comparison, a pair-wise correlation function is given for computer generated random autocorrelation function (grey line).
Figure 4
Figure 4
Panel (A) is a DIC micrograph of bacterial aggregate in the early stationary growth phase. Only high-contrast objects that include predominantly cells of high cell integrity likely to represent viable bacteria are outlined. In panel (B), an overlay of fluorescence image of the same bacterial aggregate stained by healthy cell impermeable DNA stain TOTO-1 and an image of colour-coded contrast intensity (Cell integrity) of DIC image is shown. Bright green fluorescence objects are the dying bacterial cells. The cells that were alive are not visible on fluorescence images and are marked by colour-coded DIC contrast intensity. Small fluorescence particles released from the dying cells swarmed around the dying cells. The scale bar corresponds to 10 µm. Panel (C) shows a pair-wise correlation function (Equation (3) applied on microscopy images of concentrated bacterial culture in exponential growth phase treated with DNase I for 30 min at 37 °C; control under the same conditions, but without DNase I.
Figure 5
Figure 5
Fraction of dead cells (propidium iodide, PI, stained) in B. subtilis suspension at the beginning of the exponential growth (2.5 h of incubation, OD650 = 0.5 a.u.), early stationary growth phase (5 h of incubation OD650 = 0.6 a.u), and overnight culture (16 h of incubation, OD650 = 0.8 a.u.) as determined under microscope. The fraction of dead cells in induced cell lysis at different physiological states are given at different times after cell lysis induction.
Figure 6
Figure 6
The volume space of a single eDNA released from a dying bacterium. The representative structure was obtained with a string of beads model. The scale unit on all axis is 2 μm, the average Rg of eDNA was 8 μm at persistence lenght of 50 nm [31,35]. The model eDNA was composed of 700,000 beads of 2 nm in diameter corresponding to the thickness of B-DNA and representing 4.2 Mbp of B. subtilis genome.

References

    1. Kragh K.N., Hutchison J.B., Melaugh G., Rodesney C., Roberts A.E.L., Irie Y., Jensen P.Ø., Diggle S.P., Allen R.J., Gordon V., et al. Role of Multicellular Aggregates in Biofilm Formation. mBio. 2016;7:e00237. doi: 10.1128/mBio.00237-16. - DOI - PMC - PubMed
    1. Branda S.S., Gonzalez-Pastor J.E., Ben-Yehuda S., Losick R., Kolter R. Fruiting body formation by Bacillus subtilis. Proc. Natl. Acad. Sci. USA. 2001;98:11621–11626. doi: 10.1073/pnas.191384198. - DOI - PMC - PubMed
    1. Bossier P., Verstraete W. Triggers for microbial aggregation in activated sludge? Appl. Microbiol. Biotechnol. 1996;45:1–6. doi: 10.1007/s002530050640. - DOI
    1. Tree J., Ulett G., Hobman J., Constantinidou C., Brown N.L., Kershaw C., Schembri M., Jennings M.P., McEwan A.G. The multicopper oxidase (CueO) and cell aggregation in Escherichia coli. Environ. Microbiol. 2007;9:2110–2116. doi: 10.1111/j.1462-2920.2007.01320.x. - DOI - PubMed
    1. Haaber J., Cohn M.T., Frees D., Andersen T.J., Ingmer H. Planktonic aggregates of Staphylococcus aureus protect against common antibiotics. PLoS ONE. 2012;7:e41075. doi: 10.1371/annotation/08d0f2a8-0c40-4a0c-b546-0025648e73f0. - DOI - PMC - PubMed

LinkOut - more resources