. 2023 Feb 15;28(4):1856.
doi: 10.3390/molecules28041856.

Functionalized Sulfur-Containing Heterocyclic Analogs Induce Sub-G1 Arrest and Apoptotic Cell Death of Laryngeal Carcinoma In Vitro

Affiliations

Functionalized Sulfur-Containing Heterocyclic Analogs Induce Sub-G1 Arrest and Apoptotic Cell Death of Laryngeal Carcinoma In Vitro

B Haridevamuthu et al. Molecules. .

Abstract

In this study, we speculate that the hydroxyl-containing benzo[b]thiophene analogs, 1-(3-hydroxybenzo[b]thiophen-2-yl) ethanone (BP) and 1-(3-hydroxybenzo[b]thiophen-2-yl) propan-1-one hydrate (EP), might possess antiproliferative activity against cancer cells. Hydroxyl-containing BP and EP show selectivity towards laryngeal cancer cells (HEp2), with IC50 values of 27.02 ± 1.23 and 35.26 ± 2.15 µM, respectively. The hydroxyl group present in the third position is responsible for the anticancer activity and is completely abrogated when the hydroxyl group is masked. BP and EP enhance the antioxidant enzyme activity and reduce the ROS production, which are correlated with the antiproliferative effect in HEp-2 cells. An increase in the BAX/BCL-2 ratio occurs during the BP and EP treatment and activates the caspase cascade, resulting in apoptosis stimulation. It also arrests the cells in the Sub-G1 phase, indicating the induction of apoptosis. The molecular docking and simulation studies predicted a strong interaction between BP and the CYP1A2 protein, which could aid in combinational therapy by enhancing the bioavailability of the drugs. BP and EP possess an antioxidant property with low antiproliferative effects (~5.18 µg/mL and ~7.8 µg/mL) as a standalone drug, therefore, they can be combined with other drugs for effective chemotherapy that might trigger the effect of pro-oxidant drug on healthy cells.

Keywords: anticancer; apoptosis; benzo[b]thiophene; laryngeal cancer; pharmacology.


Conflict of interest statement

The authors declare no conflict of interest.

Figures
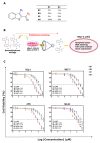
Figure 1
Figure 1
(A) Structure of the benzo[b]thiophene analogs. (B) Experimental outline of this study. (C) Logarithmic dose–response curves of Benzo[b]thiophene analog treatment in human laryngeal carcinoma (HEp−2), breast adenocarcinoma (MCF7), gastric adenocarcinoma (AGS), and osteosarcoma (MG63) cell lines. Cells were cultured in 96-well plates and treated with benzo[b]thiophene analogs for 48 h, and the viability was measured by MTT assay. IC50 values were represented as mean ± SD of three independent experiments.
Figure 2
Figure 2
Redox mechanism of analog BP during free radical attack and stabilization through keto-enol radical resonance was denoted using half arrow.
Figure 3
Figure 3
Cytotoxic effect of BP and EP on Hep-2 cells. (A) Morphological changes of the HEp2 cells after treatments with BP and EP at IC20 and IC50 concentrations. The cells were analyzed using a brightfield inverted microscope at 100× magnification. Morphological changes such as cell rounding (indicated by a short black arrow) and cell shrinkage (indicated by a short yellow arrow) were observed with the BP and EP treatments. (B) Neutral red uptake (NRU) and total LDH release of the HEp2 cancer cells. Reduction of NRU and increase in LDH indicate the cytotoxic ability of analogs BP and EP. Data are expressed as mean ± SD of three independent experiments. * p < 0.05, ** p < 0.01, *** p < 0.001 significance difference between the control and treatment. Scale: 50 µm.
Figure 4
Figure 4
Redox imbalance caused by analogs BP and EP in Hep-2 cells. (A) Intracellular ROS production stained by DCF-DA captured by CytoSMART® Lux3 FL fluorescence microscope. (B) SOD and CAT enzyme activities. A decrease in ROS causes an imbalance in the redox status of the cancer cells, causing the induction of apoptosis. Data are expressed as mean ± SD of three independent experiments. * p < 0.05, ** p < 0.01, *** p < 0.001 significance difference between the control and treatment. Scale: 200 µm.
Figure 5
Figure 5
Fluorescent images of AO/PI dual-stained HEp2 cells after treatments with BP and EP at IC20 and IC50 concentrations for 48 h captured by CytoSMART® Lux3 FL fluorescence microscope. Green nucleus represents viable cells, early apoptotic cells show yellow color, and late apoptotic cells display orange color. Intense red color cells indicate the secondary necrotic condition. The bar graph represents the percentage of cell population in apoptotic phases. The results are expressed as mean ± SD of triplicate experiments. * p < 0.05 significance difference between the control and treatment. (V, viable cells; EA, early apoptosis; LA, late apoptosis; SN, secondary necrosis; mb, membrane blebbing; cc, chromatin condensation). Scale: 200 µm.
Figure 6
Figure 6
Cell cycle analysis by DNA content estimation with flow cytometer in HEp2 cells after treatments with BP and EP at IC20 and IC50 concentrations for 48 h. (A) Histograms show the cell distribution in the different phases of the cell cycle. (B) Bar graph indicating the percentage of cells in Sub-G1, G0/G1, S, and G2/M phases, respectively. The results are expressed as mean ± SD of triplicate experiments. * p < 0.05, ** p < 0.01 significance difference between the control and treatment.
Figure 7
Figure 7
Effect of BP and EP on apoptotic gene expression of HEp2 cell line after 48 h treatment. (A) Expression profile of BAX, BCL-2, CASPASE-3, and CASPASE-9 mRNA (normalized with GAPDH). (B) BAX/BCL2 ratio increased with BP50 and EP50 treatment. The thin horizontal line represents the normalization of the control. The results are expressed as mean ± SD of triplicate experiments. * p < 0.05, ** p < 0.01 significance difference between the control and treatment.
Figure 8
Figure 8
The ligand interaction diagram of compound BP with human CYP1A2, DYRK1A, CLK1, and DYRK1B. Binding energy values (ΔG, kcal/mol) of BP with CYP1A2, DYRK1A, CLK1, and DYRK1B were predicted to be −8.1, −7.5, −7.6, and −7.6, respectively. The lowest energy was observed with CYP1A2.
Figure 9
Figure 9
Molecular simulation dynamics of CYP1A2 (Grey) and DYRK1A (Red) protein and compound BP. (A) Plot of time vs. RMSD of CYP1A2 and DYRK1A protein relative to the starting complexes during 10000 ps MD test for compound BP. (B) RMSF plot of CYP1A2 (Grey) and DYRK1A (Red) protein during 10,000 ps MD represents local changes along the protein chain. (C) Radius of gyration (Rg) value and (D) solvent-accessible surface area (SASA) plot value during the computed 10,000 ps of time for all the systems.

References

    1. Zhang Z., Zhou L., Xie N., Nice E.C., Zhang T., Cui Y., Huang C. Overcoming Cancer Therapeutic Bottleneck by Drug Repurposing. Signal Transduct. Target. Ther. 2020;5:113. doi: 10.1038/s41392-020-00213-8. - DOI - PMC - PubMed
    1. Nelson V.k., Sahoo N.K., Sahu M., Sudhan H.h., Pullaiah C.P., Muralikrishna K.S. In Vitro Anticancer Activity of Eclipta Alba Whole Plant Extract on Colon Cancer Cell HCT-116. BMC Complement. Med. Ther. 2020;20:355. doi: 10.1186/s12906-020-03118-9. - DOI - PMC - PubMed
    1. Reuter C.W.M., Morgan M.A., Eckardt A. Targeting EGF-Receptor-Signalling in Squamous Cell Carcinomas of the Head and Neck. Br. J. Cancer. 2007;96:408–416. doi: 10.1038/sj.bjc.6603566. - DOI - PMC - PubMed
    1. Ferlay J., Ervik M., Lam F., Colombet M., Mery L., Piñeros M., Znaor A., Soerjomataram I., Bray F. Cancer Today. International Agency for Research on Cancer; Lyon, France: 2020. [(accessed on 27 March 2022)]. Global Cancer Observatory. Available online: https://gco.iarc.fr/today.
    1. Ferlay J., Colombet M., Soerjomataram I., Parkin D.M., Piñeros M., Znaor A., Bray F. Cancer Statistics for the Year 2020: An Overview. Int. J. Cancer. 2021;149:778–789. doi: 10.1002/ijc.33588. - DOI - PubMed