

Genistein Inhibits Proliferation and Metastasis in Human Cervical Cancer Cells through the Focal Adhesion Kinase Signaling Pathway: A Network Pharmacology-Based In Vitro Study in HeLa Cells
- PMID: 36838908
- PMCID: PMC9963694
- DOI: 10.3390/molecules28041919
Genistein Inhibits Proliferation and Metastasis in Human Cervical Cancer Cells through the Focal Adhesion Kinase Signaling Pathway: A Network Pharmacology-Based In Vitro Study in HeLa Cells
Abstract
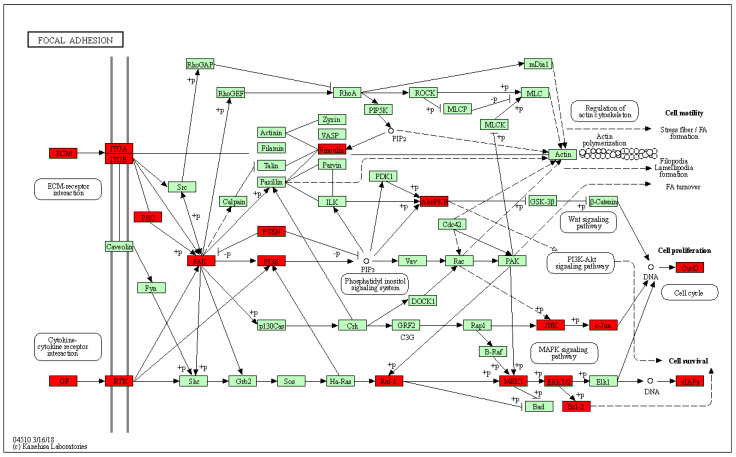
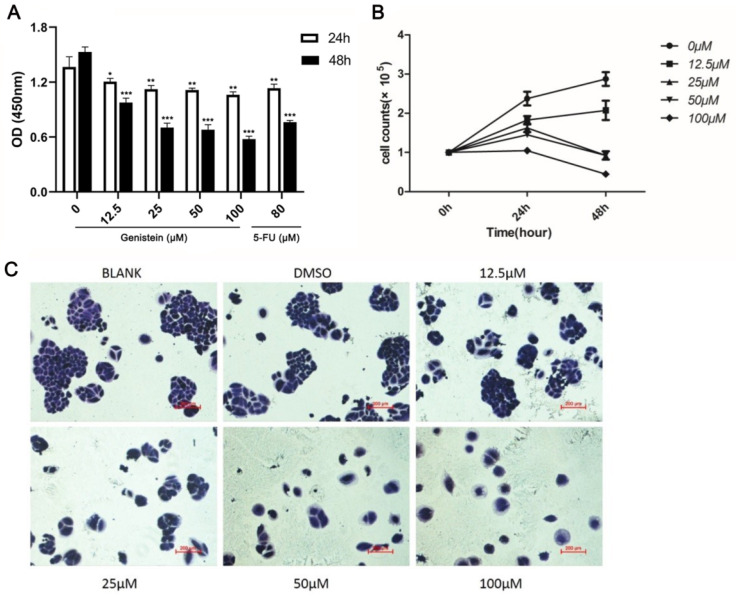
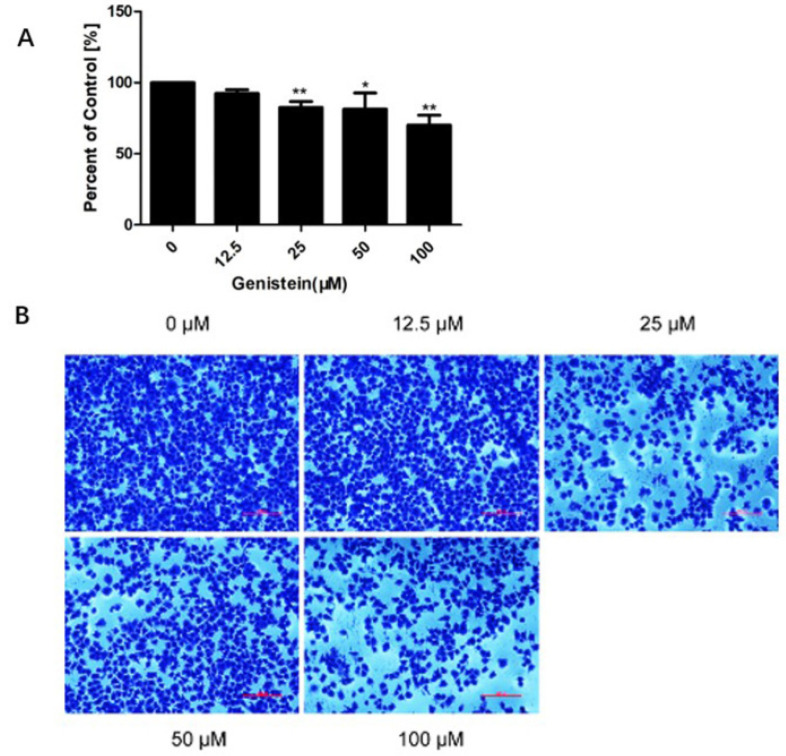
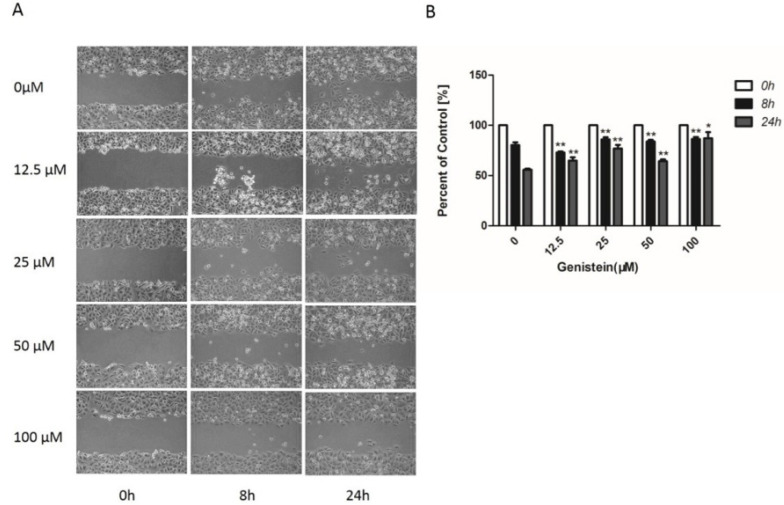
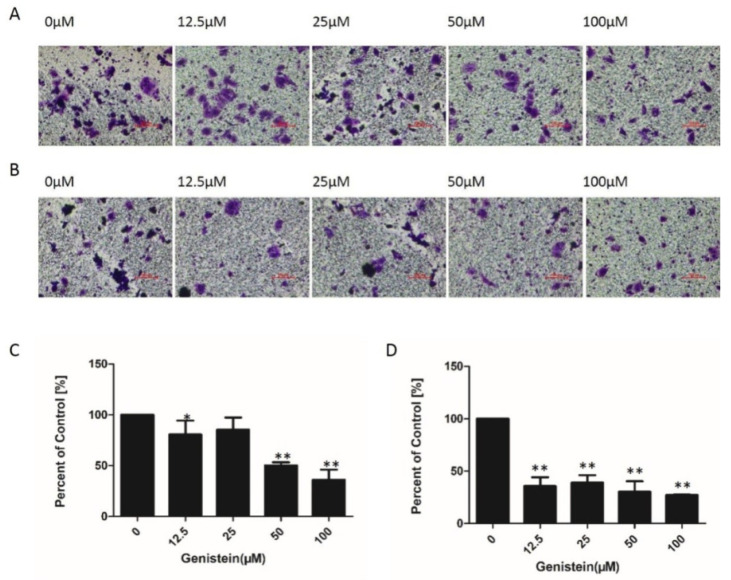
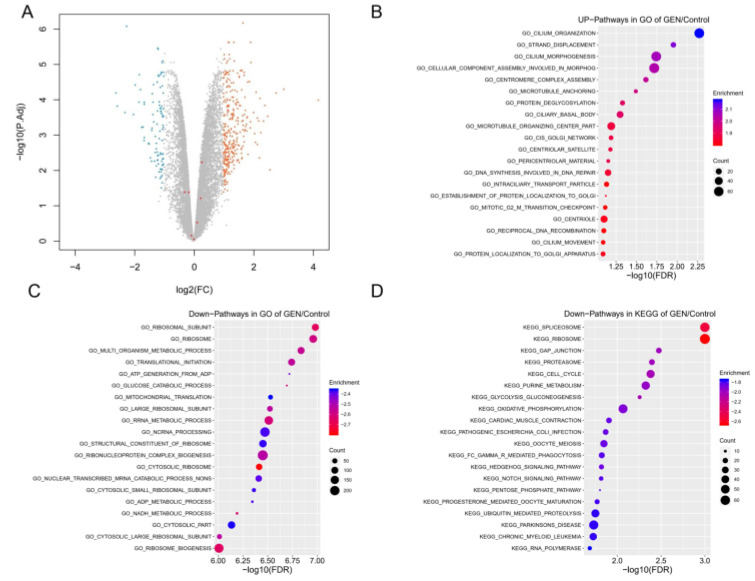
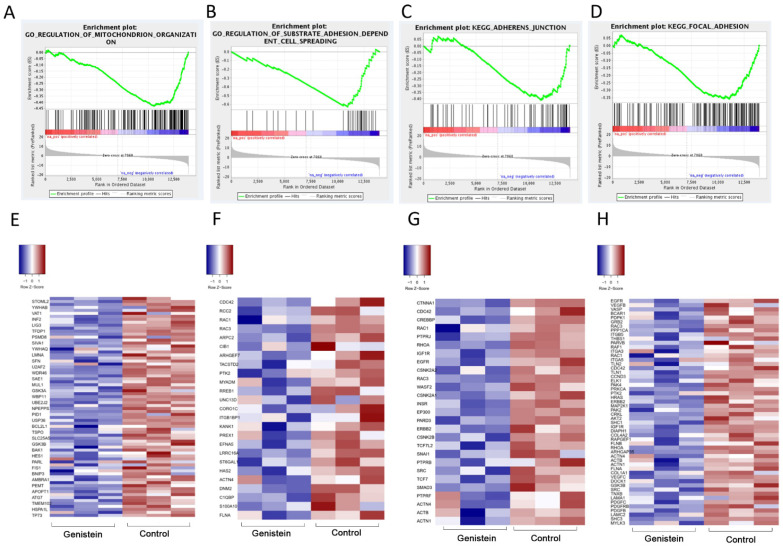
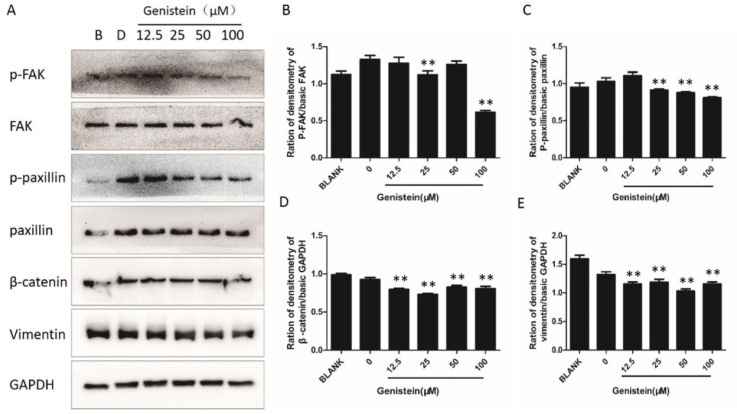
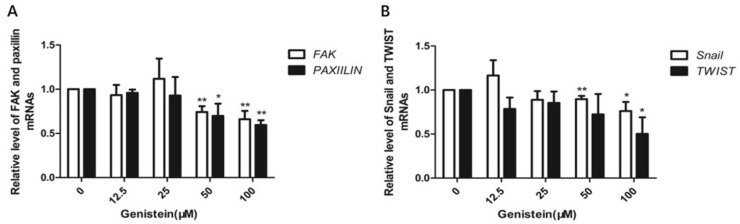
Previous studies have provided evidence that genistein exerts a therapeutic effect on different tumor cells. However, the mechanism of action of genistein against cervical cancer cells remains largely unknown. The aim of this study was to comprehensively decipher the anti-metastatic effect and molecular mechanism of genistein action on cervical cancer cells. We developed an integrated strategy from genotype to phenotype, combining network pharmacology and a transcriptome screening approach, to elucidate the underlying mechanism of action of genistein against human cervical cancer cells. In silico studies predicted that the focal adhesion pathway may be an important signaling cascade targeted by genistein treatment. Using RNA sequencing analysis, representative genes of the focal adhesion pathway were demonstrated to be significantly downregulated. Phenotypic studies revealed that genistein demonstrated strong anti-proliferative and anti-metastatic activity in HeLa cells. Moreover, genistein modulated this activity in a concentration-dependent manner. Genistein also inhibited both the activation and gene expression of FAK (Focal Adhesion Kinase) and paxillin. In addition, vimentin and β-catenin protein expression, and Snail and Twist gene expression, were strongly inhibited by genistein. Our findings provide strong evidence for a pleiotropic effect of genistein on cervical cancer cells, mediated through the focal adhesion pathway.
Keywords: RNA expression profiling; cervical cancer; genistein; metastasis; network pharmacology.
Conflict of interest statement
The authors declare no conflict of interest.
Figures
Similar articles
-
Genistein inhibits migration and invasion of cervical cancer HeLa cells by regulating FAK-paxillin and MAPK signaling pathways.Taiwan J Obstet Gynecol. 2020 May;59(3):403-408. doi: 10.1016/j.tjog.2020.03.012. Taiwan J Obstet Gynecol. 2020. PMID: 32416888
-
Genistein inhibits the growth and regulates the migration and invasion abilities of melanoma cells via the FAK/paxillin and MAPK pathways.Oncotarget. 2017 Mar 28;8(13):21674-21691. doi: 10.18632/oncotarget.15535. Oncotarget. 2017. PMID: 28423510 Free PMC article.
-
Focal adhesion kinase (FAK) phosphorylation is not required for genistein-induced FAK-beta-1-integrin complex formation.Clin Exp Metastasis. 2000;18(3):203-12. doi: 10.1023/a:1006729106034. Clin Exp Metastasis. 2000. PMID: 11315093
-
Effects of the natural isoflavonoid genistein on growth, signaling pathways and gene expression of matrix macromolecules by breast cancer cells.Mini Rev Med Chem. 2006 Mar;6(3):331-7. doi: 10.2174/138955706776073420. Mini Rev Med Chem. 2006. PMID: 16515472 Review.
-
Potential Focal Adhesion Kinase Inhibitors in Management of Cancer: Therapeutic Opportunities from Herbal Medicine.Int J Mol Sci. 2022 Nov 1;23(21):13334. doi: 10.3390/ijms232113334. Int J Mol Sci. 2022. PMID: 36362132 Free PMC article. Review.
Cited by
-
An Updated Review Summarizing the Pharmaceutical Efficacy of Genistein and its Nanoformulations in Ovarian Carcinoma.Curr Pharm Des. 2025;31(2):107-115. doi: 10.2174/0113816128332618240823044548. Curr Pharm Des. 2025. PMID: 39354775 Review.
-
A Comprehensive Review of Genistein's Effects in Preclinical Models of Cervical Cancer.Cancers (Basel). 2023 Dec 20;16(1):35. doi: 10.3390/cancers16010035. Cancers (Basel). 2023. PMID: 38201463 Free PMC article. Review.
-
Actin Cytoskeleton Polymerization and Focal Adhesion as Important Factors in the Pathomechanism and Potential Targets of Mucopolysaccharidosis Treatment.Cells. 2023 Jul 5;12(13):1782. doi: 10.3390/cells12131782. Cells. 2023. PMID: 37443816 Free PMC article.
-
Anticancer and anti-metastasis activity of 1,25 dihydroxycholecalciferols and genistein in MCF-7 and MDA-MB-231 breast cancer cell lines.Heliyon. 2023 Nov 8;9(11):e21975. doi: 10.1016/j.heliyon.2023.e21975. eCollection 2023 Nov. Heliyon. 2023. PMID: 38034665 Free PMC article.
-
Molecular Pathways of Genistein Activity in Breast Cancer Cells.Int J Mol Sci. 2024 May 20;25(10):5556. doi: 10.3390/ijms25105556. Int J Mol Sci. 2024. PMID: 38791595 Free PMC article. Review.
References
MeSH terms
Substances
LinkOut - more resources
Full Text Sources
Medical
Research Materials
Miscellaneous
