. 2023 Feb 20;28(4):1999.
doi: 10.3390/molecules28041999.

Femtosecond Time-Resolved Observation of Relaxation and Wave Packet Dynamics of the S1 State in Electronically Excited o-Fluoroaniline

Affiliations

Femtosecond Time-Resolved Observation of Relaxation and Wave Packet Dynamics of the S1 State in Electronically Excited o-Fluoroaniline

Bumaliya Abulimiti et al. Molecules. .

Abstract

Quantum beat frequency is the basis for understanding interference effects and vibrational wave packet dynamics and has important applications. Using femtosecond time-resolved mass spectrometry and femtosecond time-resolved photoelectron image combined with theoretical calculations, we study the electronic excited-state relaxation of o-fluoraniline molecule and the time-dependent evolution of vibrational wave packets between different eigenstates. After the molecule absorbs a photon of 288.3 nm and is excited to the S1 state, intramolecular vibrational redistribution first occurs on the time scale τ1 = 349 fs, and then the transition to the triplet state occurs through the intersystem crossing on the time scale τ2 = 583 ps, and finally, the triplet state occurs decays slowly through the time scale τ3 = 2074 ps. We find the intramolecular vibrational redistribution is caused by the 00, 10b1 and 16a1 vibrational modes of the Sl state origin. That is, the 288.3 nm femtosecond laser excites the molecule to the S1 state, and the continuous flow of the vibrational wave packet prepares a coherent superposition state of three vibrational modes. Through extracting the oscillation of different peak intensities in the photoelectron spectrum, we observe reversible changes caused by mutual interference of the S1 00, S1 10b1 and S1 16a1 states when the wave packets flow. When the pump pulse is 280 nm, the beat frequency disappears completely. This is explained in terms of increases in the vibrational field density and characteristic period of oscillation, and statistical averaging makes the quantum effect smooth and indistinguishable. In addition, the Rydberg component of the S1 state is more clearly resolved by combining experiment and theory.

Keywords: o-fluoraniline; photoelectron image; quantum beat frequency; relaxation dynamic; wave packet dynamic.


Conflict of interest statement

The authors have no conflict to declare.

Figures

Figure A1
Figure A1
The infrared spectrum of the ground state, S1 state, and T1 state of the molecule shows no imaginary frequency. For the S0 state, calculation method and basis set: DFT and CAM-B3LYP/6-311+G(d,p). For S1 and T1 states, calculation method and basis set: TD-DFT and CAM-B3LYP/6-311+G(d,p).
Figure A2
Figure A2
Molecular structure and Cartesian coordinate system of the ground state, S1 state and T1 state, and the Z axis is perpendicular to the paper surface. For the S0 state, calculation method and basis set: DFT and CAM-B3LYP/6-311+G(d,p). For S1 and T1 states, calculation method and basis set: TD-DFT and CAM-B3LYP/6-311+G(d,p).
Figure A3
Figure A3
The molecular orbitals of the first to the fifth and eighth peaks.
Figure 1
Figure 1
o-Fluoroaniline energy varies with angle, and the five structures of the molecule are given. Calculation method and basis set: DFT and CAM-B3LYP/6-311+G(d,p).
Figure 2
Figure 2
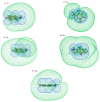
MO29, MO30, MO32 orbitals of o-fluoroaniline S1 state. Calculation method and basis set: TD-DFT and CAM-B3LYP/6-311+G(d,p).
Figure 3
Figure 3
Time decay curves of the parent ion measured with (a) a 288.3 nm pump pulse and 800 nm probe pulse, (b) a 280 nm pump pulse and 800 nm probe pulse. The circles are experimental data, and the solid lines are fitted data. Both curves are fitted using a Gaussian cross-correlation function and a convolution of three exponential decay functions, resulting in different decay times.
Figure 4
Figure 4
Photoelectron spectra at delay times of (a) Δt = 0.027 ps and (b) Δt = 1.429 ps. The ordinates of the two plots are normalized, and (b) is normalized with the maximum value of (a) as a reference. The insets are the corresponding optoelectronic images (the original image on the left and BASEX transformed image on the right).
Figure 5
Figure 5
Time decay curves of the parent ion measured with (a) 266 nm pump pulse and 800 nm probe pulse, (b) 260 nm pump pulse and 800 nm probe pulse, (c) 250 nm pump pulse and 800 nm probe pulse, and (d) 240 nm pump pulse and 800 nm probe pulse. The circles are experimental data, and the solid lines are fitted data. All curves are fitted using a Gaussian cross-correlation function and a convolution of three exponential decay functions to obtain different decay times.
Figure 6
Figure 6
(a) Time-resolved photoelectron spectrum obtained with a 288.3 nm pump pulse and 800 nm probe pulse. (b) The spectrum obtained by Fourier transform of the residual data at the fourth peak. (c) Signal intensities of the six peaks as functions of delay time. Experimental data are given as open circles, while solid lines are fitted results.
Figure 7
Figure 7
(a) Time-resolved photoelectron spectrum obtained with 280 nm pump pulse and 800 nm probe pulse. (b) Signal intensities of the six peaks as functions of delay time. Experimental data are given as open circles, while solid lines are fitted results.

References

    1. Kuthirummal N., Weber P.M. Rydberg states: Sensitive probes of molecular structure. Chem. Phys. Lett. 2003;378:647–653. doi: 10.1016/j.cplett.2003.08.002. - DOI
    1. Cheng X.X., Zhang Y., Deb S., Minitti M.P., Gao Y., Jónssonad H.P., Weber M. Ultrafast structural dynamics in Rydberg excited N,N,N′,N′-tetramethylethylenediamine: Conformation dependent electron lone pair interaction and charge delocalization. Chem. Sci. 2014;5:4394–4403. doi: 10.1039/C4SC01646G. - DOI
    1. Cheng X.X., Zhang Y., Gao Y., Jónsson H., Weber P.M. Ultrafast structural pathway of charge transfer in N,N,N’,N’-tetramethylethylenediamine. J. Phys. Chem. A. 2015;199:2813–2818. doi: 10.1021/acs.jpca.5b01797. - DOI - PubMed
    1. Minitti M.P., Weber P.M. Time-Resolved Conformational Dynamics in Hydrocarbon Chains. Phys. Rev. Lett. 2007;98:253004. doi: 10.1103/PhysRevLett.98.253004. - DOI - PubMed
    1. Deb S., Minitti M.P., Weber P.M. Structural dynamics and energy flow in Rydberg-excited clusters of N,N-dimethylisopropylamine. J. Chem. Phys. 2011;135:044319. doi: 10.1063/1.3609110. - DOI - PubMed

LinkOut - more resources