Review
. 2023 Feb 6;13(4):640.
doi: 10.3390/nano13040640.

Electrochemistry of Carbon Materials: Progress in Raman Spectroscopy, Optical Absorption Spectroscopy, and Applications

Affiliations
Review

Electrochemistry of Carbon Materials: Progress in Raman Spectroscopy, Optical Absorption Spectroscopy, and Applications

Marianna V Kharlamova et al. Nanomaterials (Basel). .

Abstract

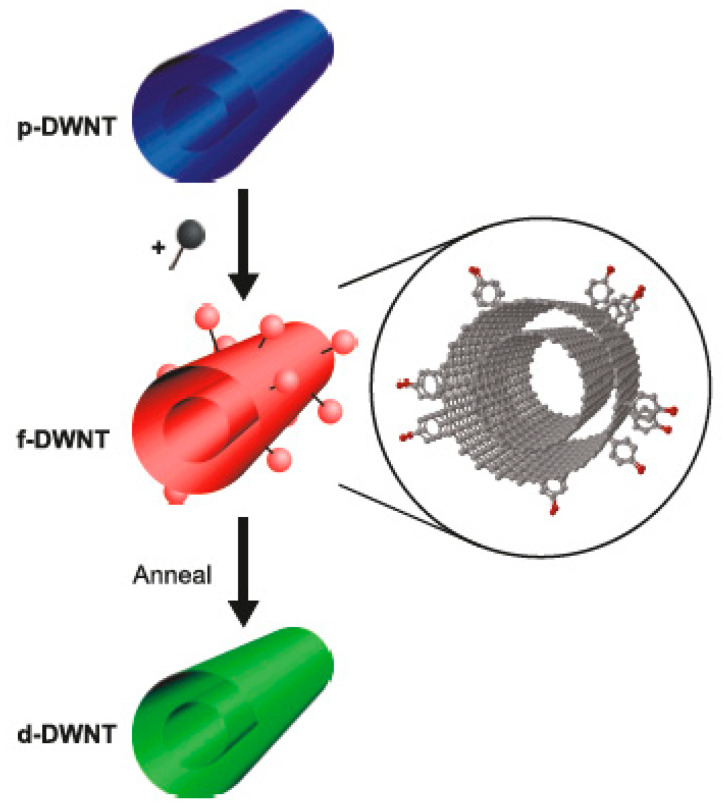
This paper is dedicated to the discussion of applications of carbon material in electrochemistry. The paper starts with a general discussion on electrochemical doping. Then, investigations by spectroelectrochemistry are discussed. The Raman spectroscopy experiments in different electrolyte solutions are considered. This includes aqueous solutions and acetonitrile and ionic fluids. The investigation of carbon nanotubes on different substrates is considered. The optical absorption experiments in different electrolyte solutions and substrate materials are discussed. The chemical functionalization of carbon nanotubes is considered. Finally, the application of carbon materials and chemically functionalized carbon nanotubes in batteries, supercapacitors, sensors, and nanoelectronic devices is presented.

Keywords: Raman spectroscopy; carbon nanotube; electrochemistry; optical absorption spectroscopy; spectroelectrochemistry; voltamerometry.


Conflict of interest statement

The author may have a conflict of interest with Andrei Eliseev (Lomonosov Moscow State University). The funders had no role in the design of the study; in the collection, analyses, or interpretation of the data; in the writing of the manuscript; or in the decision to publish the results.

Figures

Figure 1
Figure 1
SWCNT properties, methods, and applications.
Figure 2
Figure 2
Galvanostatic insertion–extraction of lithium into nanotubes. Current load of 20 mA/g. Reprinted from Frackowiak E, Beguin F Carbon 40 1775 (2002), Copyright (2002), with permission from Elsevier [116].
Figure 3
Figure 3
Dependence of irreversible capacity Cirr versus mesopore volume and specific surface area (inset) for different types of nanotubes. Reprinted from Frackowiak E, Beguin F Carbon 40 1775 (2002), Copyright (2002), with permission from Elsevier [116].
Figure 4
Figure 4
Voltammetry characteristics of MWCNT. Reprinted from E. Frackowiak et al./Carbon 37 (1999) 61–69, Copyright (1999), with permission from Elsevier [144].
Figure 5
Figure 5
The resonance Raman spectra of the RBM (a) and TDM (b) modes acquired at a laser wavelength of 514 nm under both positive and negative voltages. Reprinted from Kavan L, Rapta P, Dunsch L Chem. Phys. Lett. 328 363 (2000), Copyright (2000), with permission from Elsevier [118].
Figure 6
Figure 6
Experimental Raman spectra (solid lines) of the RBM at zero bias (a) and −0.08 V (b) for a laser energy of 2.41 eV. The dotted lines are the calculated line shapes. The inset shows the G-band at zero bias (open circles) and at −0.08 V (solid line). Reprinted from Ghosh S, Sood A K, Rao C N R J. Appl. Phys. 92 1165 (2002), with the permission of AIP Publishing [123].
Figure 7
Figure 7
Potential dependent Raman spectra (excited at 2.18 eV) of HiPco SWCNT on the Pt electrode in acetonitrile +0.2 M LiClO4. The peaks marked by * are assigned to the electrolyte solution. Reprinted with permission from Ref. [127], copyright 2006 Wiley-VCH Verlag GmbH & Co. KGaA, Weinheim.
Figure 8
Figure 8
Vis-NIR spectra of ITO-supported SWCNT in aqueous 0.1M KCl saturated with nitrogen. Reprinted from Kavan L, Rapta P, Dunsch L Chem. Phys. Lett. 328 363 (2000), Copyright (2000), with permission from Elsevier [118].
Figure 9
Figure 9
In situ absorption spectra of an SWCNT film. The star indicates features coming from the solvent and also noises. Reprinted from Kazaoui S et al. Appl. Phys. Lett. 78 3433 (2001), with the permission of AIP Publishing [133].
Figure 10
Figure 10
The schematics of functionalization and reversible defunctionalization by the thermal treatment of DWCNTs. Reprinted with permission from Bouilly D et al. ACS Nano 2011 5 6 4927. Copyright 2011 American Chemical Society [182].
Figure 11
Figure 11
The TEM data in low- and high-magnification images of DWCNTs treated with 5 mL of a solution for 24 h (A,B) and treated with 10 mL of a solution for 2 h (C,D). Reprinted with permission from Brozena A et al. JACS 2010 132 11 3932. Copyright 2010 American Chemical Society [183].
Figure 12
Figure 12
The solubility and defectiveness of DWCNTs at a fixed reaction time of 2 h with nitric acid (AC) and increasing reaction times using 5 mL of HNO3 (DF). Reprinted with permission from Brozena A et al. JACS 2010 132 11 3932. Copyright 2010 American Chemical Society [183].
Figure 13
Figure 13
Concentration of fluorine (a) and oxygen (b) in the DWCNTs fluorinated by F2 (1), BrF3 (2), and CF4 plasma (3) as a function of the annealing temperature. (c) High-resolution TEM image of DWCNTs fluorinated by F2 at 200 °C. Reprinted with permission from Bulusheva L et al. Chem Mater 2010 22 4197. Copyright 2010 American Chemical Society [184].
Figure 14
Figure 14
(a) The schematics of the covalent functionalization of DWCNTs. (b) The optical absorption spectrum of DWCNTs before and after the functionalization with diazonium salts. Reprinted with permission from Piao Y. et al. J Phys Chem Lett 2011 2 1577. Copyright 2011 American Chemical Society [185].
Figure 15
Figure 15
The SEM and TEM images of B,N-CNTs at different addition amounts of boric acid (B,N-CNT-1, 0.05 g (a,b), B,N-CNT-2, 0.1 g (c,d), B,N-CNT-3, 0.25 g (e,f), B,N-CNT-4, 0.5 g (g,h), and B,N-CNT-5, 1 g (i,j)). Copyright 2021 by the authors. Licensee MDPI, Basel, Switzerland. This article is an open-access article distributed under the terms and conditions of the Creative Commons Attribution (CC BY) license [210].
Figure 16
Figure 16
The (a) C 1s XPS spectrum, (b) B 1s XPS spectrum, and (c) N 1s XPS spectrum of B,N-CNTs (B,N-CNT-1, 0.05 g, B,N-CNT-2, 0.1 g, B,N-CNT-3, 0.25 g, B,N-CNT-4, 0.5 g, and B,N-CNT-5, 1 g). Copyright 2021 by the authors. Licensee MDPI, Basel, Switzerland. This article is an open-access article distributed under the terms and conditions of the Creative Commons Attribution (CC BY) license [210].
Figure 17
Figure 17
The OAS spectra of pristine and cobalt bromide-filled SWCNTs. Reprinted from M.V. Kharlamova et al. Study of the electronic structure of single-walled carbon nanotubes filled with cobalt bromide, JETP Letters, V. 91, n 4, p. 196–200, 2010, Springer Nature [146].
Figure 18
Figure 18
The Raman spectra of pristine and cobalt iodide-filled SWCNTs obtained at laser energies of 2.41 eV (a), 1.96 eV (b), 1.58 eV (c). Copyright 2022 by the author. Licensee MDPI, Basel, Switzerland. This article is an open-access article distributed under the terms and conditions of the Creative Commons Attribution (CC BY) license [238].
Figure 19
Figure 19
The XPS spectra of pristine (a) and gallium selenide-filled SWCNTs (b). Reprinted from M.V. Kharlamova. Novel approach to tailoring the electronic properties of single-walled carbon nanotubes by the encapsulation of high-melting gallium selenide using a single-step process, JETP letters, V. 98, n 5, p. 272–277, 2013, Springer Nature [162].
Figure 20
Figure 20
The NEXAFS spectra of the pristine and sulfur-filled SWCNTs and the processed samples. Copyright 2020 by the author. Licensee MDPI, Basel, Switzerland. This article is an open-access article distributed under the terms and conditions of the Creative Commons Attribution (CC BY) license [239].
Figure 21
Figure 21
The schematic of band structures of pristine semiconducting (a) and metallic (b) SWCNTS and the Fermi level (EF) shift (shown with an arrow) in gallium selenide-filled SWCNTs (c). Reprinted from M.V. Kharlamova. Novel approach to tailoring the electronic properties of single-walled carbon nanotubes by the encapsulation of high-melting gallium selenide using a single-step process, JETP letters, V. 98, n 5, p. 272–277, 2013, Springer Nature [162].
Figure 22
Figure 22
Threshold voltage shifts of SWCNT FET (red squares, left axis) and open-circuit potential between the working and reference electrode (blue triangles, right axis). Reprinted with permission from Larrimore L et al. Nano Lett. 6 1329 (2006). Copyright 2006 American Chemical Society [251].
Figure 23
Figure 23
(a) Optical micrograph of the device. (b) Atomic force microscopy image of a tube between two electrodes. The tube diameter is 1.9 nm. (c) Schematic of the electrolyte gate measurement. (d) Current versus source drain voltage I-Vsd characteristics of the device. The inset shows the transconductance gm = dI/dVwg taken at Vsd = −0.8 V. Reprinted with permission from Rosenblatt S et al. Nano Lett. 2 869 (2002). Copyright 2002 American Chemical Society [252].
Figure 24
Figure 24
Specific current vs. voltage dependence of NC and mNC in 1 M H2SO4 (a) and 6 M KOH (b); specific capacitance vs. scan rate dependence of NC and mNC in 1 M H2SO4 (c) and 6 M KOH (d). Copyright 2022 by the author. Licensee MDPI, Basel, Switzerland. This article is an open-access article distributed under the terms and conditions of the Creative Commons Attribution (CC BY) license [268].
Figure 25
Figure 25
Current vs. potential curves of Br-aPNC (a) measured at scan rates of 0.1–1.0 mV s−1 and log(current)–log(scan rate) plots (b) plotted for oxidation (O) and reduction (R) peaks. Copyright 2022 by the author. Licensee MDPI, Basel, Switzerland. This article is an open-access article distributed under the terms and conditions of the Creative Commons Attribution (CC BY) license [262].
Figure 26
Figure 26
The current vs. potential measurements (a,c) and diffusion and pseudocapacitive contributions to the electrochemical storage at various scanning rates (b,d) in lithium-ion batteries and sodium-ion batteries. Copyright 2023 by the author. Licensee MDPI, Basel, Switzerland. This article is an open-access article distributed under the terms and conditions of the Creative Commons Attribution (CC BY) license [263].
Figure 27
Figure 27
(a) Specific capacitances and current vs. voltage curves at scan rates of (b) 5 and (c) 10 mV s−1 of N-C, N-Cw, and N-Ca samples. The inset in (a) presents capacitance retention plots for N-C and N-Ca during 2000 cycles at 100 mV s−1. Copyright 2020 by the author. Licensee MDPI, Basel, Switzerland. This article is an open-access article distributed under the terms and conditions of the Creative Commons Attribution (CC BY) license [275].
Figure 28
Figure 28
Capacitance retention versus cycle number measurements, with insets showing the current density versus potential measurements for pristine (SW) (a), split (SW_DC) (b), and fluorinated F-SW (c) and F-SW_DC (d) electrodes at a scan rate of 100 mV s−1. Copyright 2021 by the author. Licensee MDPI, Basel, Switzerland. This article is an open-access article distributed under the terms and conditions of the Creative Commons Attribution (CC BY) license [276].
Figure 29
Figure 29
The current versus potential dependence (a,d), the log(current) vs. log(scan rate) (b,e), and the diffusion and capacitive contributions for different scan rates (c,f) of P-filled SWCNTs (P@SWCNT/P) and treated P@SWCNT. Copyright 2023 by the author. Licensee MDPI, Basel, Switzerland. This article is an open-access article distributed under the terms and conditions of the Creative Commons Attribution (CC BY) license [277].

Similar articles

Cited by

References

    1. Jeon I., Xiang R., Shawky A., Matsuo Y., Maruyama S. Single-Walled Carbon Nanotubes in Emerging Solar Cells: Synthesis and Electrode Applications. Adv. Energ. Mater. 2019;9:1801312. doi: 10.1002/aenm.201801312. - DOI
    1. Ferguson V., Silva S.R.P., Zhang W. Carbon Materials in Perovskite Solar Cells: Prospects and Future Challenges. Energ. Environ. Mater. 2019;2:107–118. doi: 10.1002/eem2.12035. - DOI
    1. Liu B.L., Wu F.Q., Gui H., Zheng M., Zhou C.W. Chirality-Controlled Synthesis and Applications of Single-Wall Carbon Nanotubes. ACS Nano. 2017;11:31–53. doi: 10.1021/acsnano.6b06900. - DOI - PubMed
    1. Bati A.S.R., Yu L.P., Batmunkh M., Shapter J.G. Recent advances in applications of sorted single-walled carbon nanotubes. Adv. Funct. Mater. 2019;29:1902273. doi: 10.1002/adfm.201902273. - DOI
    1. Moore K.E., Tune D.D., Flavel B.S. Double-walled carbon nanotube processing. Adv. Mater. 2015;27:3105–3137. doi: 10.1002/adma.201405686. - DOI - PubMed

LinkOut - more resources