. 2023 Feb 7;15(4):852.
doi: 10.3390/nu15040852.

Long-Term Effects and Potential Impact of Early Nutrition with Breast Milk or Infant Formula on Glucose Homeostasis Control in Healthy Children at 6 Years Old: A Follow-Up from the COGNIS Study

Affiliations

Long-Term Effects and Potential Impact of Early Nutrition with Breast Milk or Infant Formula on Glucose Homeostasis Control in Healthy Children at 6 Years Old: A Follow-Up from the COGNIS Study

Estefanía Diéguez et al. Nutrients. .

Abstract

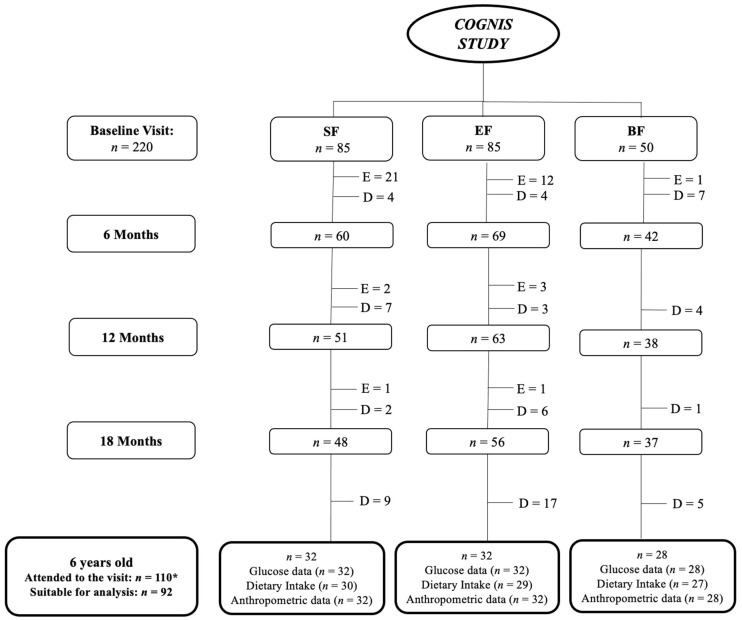
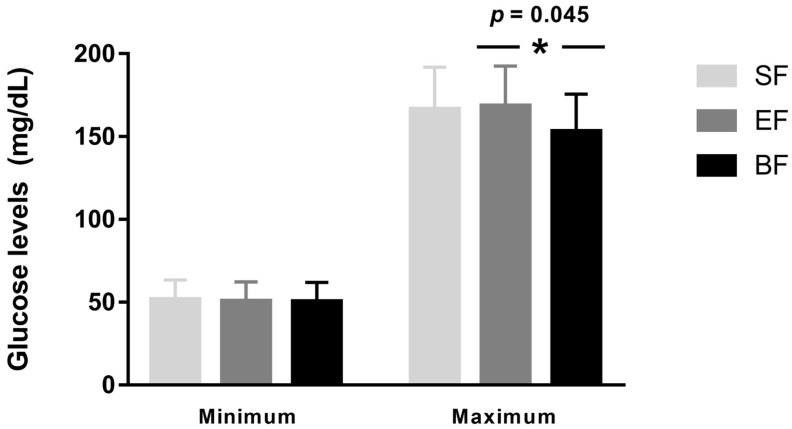
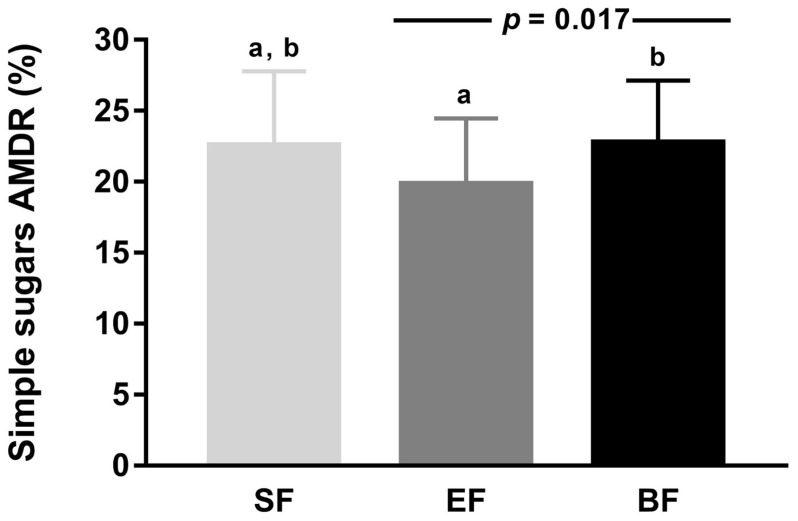
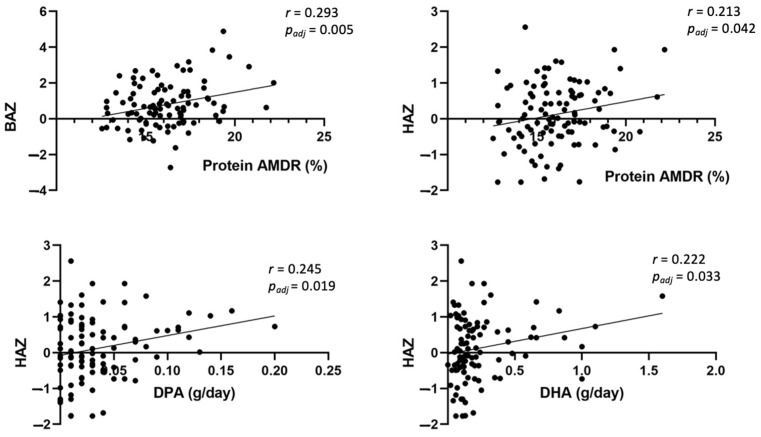
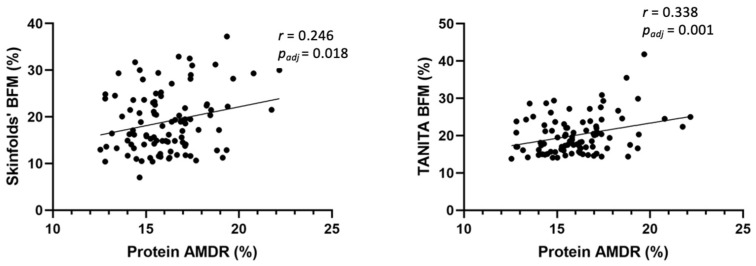
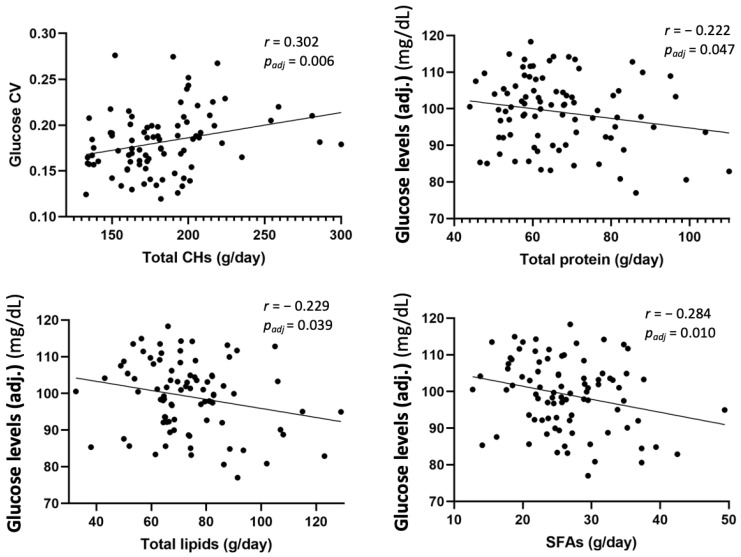
There is scarce evidence about early nutrition programming of dynamic aspects of glucose homeostasis. We analyzed the long-term effects of early nutrition on glycemic variability in healthy children. A total of 92 children participating in the COGNIS study were considered for this analysis, who were fed with: a standard infant formula (SF, n = 32), an experimental formula (EF, n = 32), supplemented with milk fat globule membrane (MFGM) components, long-chain polyunsaturated fatty acids (LC-PUFAs), and synbiotics, or were breastfed (BF, n = 28). At 6 years old, BF children had lower mean glucose levels and higher multiscale sample entropy (MSE) compared to those fed with SF. No differences in MSE were found between EF and BF groups. Normal and slow weight gain velocity during the first 6 months of life were associated with higher MSE at 6 years, suggesting an early programming effect against later metabolic disorders, thus similarly to what we observed in breastfed children. Conclusion: According to our results, BF and normal/slow weight gain velocity during early life seem to protect against glucose homeostasis dysregulation at 6 years old. EF shows functional similarities to BF regarding children's glucose variability. The detection of glucose dysregulation in healthy children would help to develop strategies to prevent the onset of metabolic disorders in adulthood.

Keywords: body fat mass; continuous glucose monitoring; early nutrition; glucose coefficient of variation; glucose homeostasis; glycemic variability; growth velocity; multiscale sample entropy.


Conflict of interest statement

Jesús Jiménez and Roser De Castellar are employees of Ordesa Laboratories, S.L.

Figures

Figure 1
Figure 1
Participant flowchart from baseline visit to 6 years old. BF: breastfeeding; D: drop-outs; E: exclusions; EF: experimental infant formula; n: sample size; SF: standard infant formula. Up to 18 months of life, a total of 40 infants were excluded in the SF and EF groups as previously described [25]: 24 were excluded in the SF group (1 infant due to perinatal hypoxia, 1 infant had growth restriction, not related to the infant formula, 15 infants did not take the infant formula, 2 had infant colic, 3 were excluded due to lactose intolerance, 1 infant due to digestive surgical intervention, and 1 infant suffered hydrocephalia); 16 infants were excluded in the EF group (2 infants presented growth restriction, not related to the infant formula, 2 infants had lactose intolerance, 11 infants did not take the infant formula, and 1 was excluded due to epileptic seizure). While in the BF group, one infant was excluded, because he was not exclusively breastfed beyond 2 months of age. In the follow-up visits, drop-outs were due to the participants that decided not to continue in the study; then, 110* children (SF: 39; EF: 39; BF: 32) attended the follow-up visit at 6 years old. Nonetheless, not all parents attending the follow-up visit wanted their children to wear the 24 h continuous glucose monitoring (CGM) device. Mean glucose data were collected with a CGM device for an average of 7 days. Those glucose data registered for less than three days were not included in the final analysis. Lastly, at 6 years old, 92 children were included in the current analysis (SF: 32; EF: 32; BF: 28).
Figure 2
Figure 2
Minimum and maximum means of glucose levels by study group. Data are presented as mean ± SD. * p-value for differences between EF and BF groups. BF: breastfeeding; EF: experimental infant formula; SF: standard infant formula.
Figure 3
Figure 3
Simple sugars acceptable macronutrient distribution ranges (AMDR) in children by study groups at 6 years old. Data are presented as mean ± SD. Values which do not share the same suffix (ab) are significantly different in a Bonferroni post hoc test. p-value for differences between EF and BF groups. AMDR: acceptable macronutrient distribution ranges; BF: breastfeeding; EF: experimental infant formula; SF: standard infant formula.
Figure 4
Figure 4
Partial correlation to evaluate potential associations between anthropometric data and dietary intake in children at 6 years, adjusted by study group, maternal age, parents’ educational level, and socioeconomic status. AMDR: acceptable macronutrient distribution ranges; BAZ: body mass index for age z-score; DHA: docohexaenoic acid; DPA: docosapentaenoic acid; HAZ: height for age z-score.
Figure 5
Figure 5
Partial correlation to evaluate potential associations between BFM and dietary intake in children at 6 years, adjusted by study group, maternal age, parents’ educational level, and socioeconomic status. AMDR: acceptable macronutrient distribution ranges; BFM: body fat mass; TANITA®: bioelectrical impedance.
Figure 6
Figure 6
Partial correlation to evaluate potential associations between glucose data and dietary intake in children at 6 years, adjusted by study group, maternal age, parents’ educational level, and socioeconomic status. Glucose CV does not have any measurement units. Adj: adjusted mean glucose levels; CHs: carbohydrates; CV: glucose coefficient of variation; SFAs: saturated fatty acids.

Similar articles

Cited by

References

    1. Ellsworth L., Harman E., Padmanabhan V., Gregg B. Lactational programming of glucose homeostasis: A window of opportunity. Reproduction. 2018;156:R23–R42. doi: 10.1530/REP-17-0780. - DOI - PMC - PubMed
    1. Arner P. Fat Tissue Growth and Development in Humans. Nestle Nutr. Inst. Workshop Ser. 2018;89:37–45. - PubMed
    1. Diabetes. [(accessed on 19 October 2022)]. Available online: https://www.who.int/news-room/fact-sheets/detail/diabetes.
    1. Spain World Obesity Federation Global Obesity Observatory. [(accessed on 19 October 2022)]. Available online: https://data.worldobesity.org/country/spain-199/#data_prevalence.
    1. de Assunção S.N.F., Boa Sorte N.C.A., de Aragão Dantas Alves C., Mendes P.S.A., Alves C.R.B., Silva L.R. Glucose alteration and insulin resistance in asymptomatic obese children and adolescents. J. De Pediatr. 2018;94:268–272. doi: 10.1016/j.jped.2017.06.008. - DOI - PubMed