. 2023 Feb 20;15(4):1042.
doi: 10.3390/nu15041042.

Effects of Chronic Administration of Green Tea Ethanol Extract on Sleep Architecture in Mice: A Comparative Study with a Representative Stimulant Caffeine

Affiliations

Effects of Chronic Administration of Green Tea Ethanol Extract on Sleep Architecture in Mice: A Comparative Study with a Representative Stimulant Caffeine

Duhyeon Kim et al. Nutrients. .

Abstract

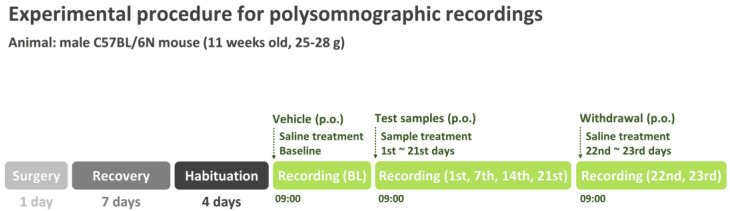
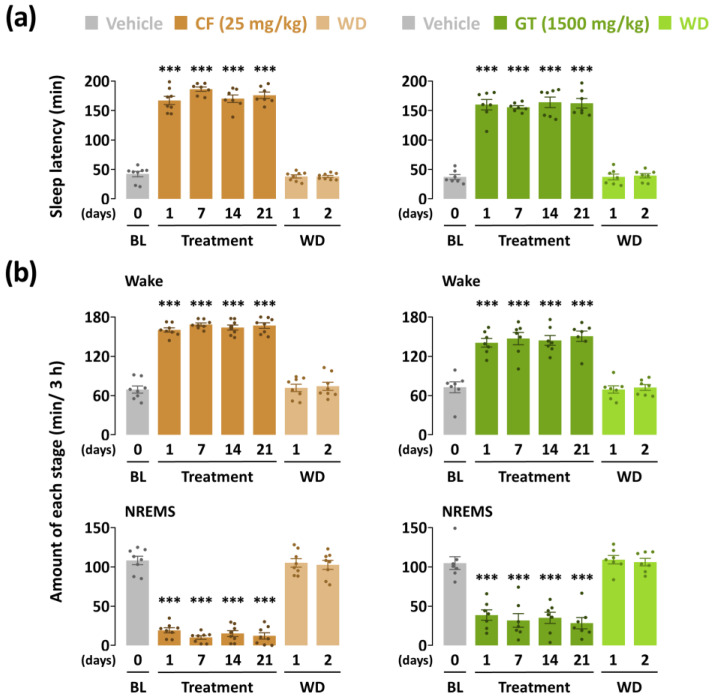
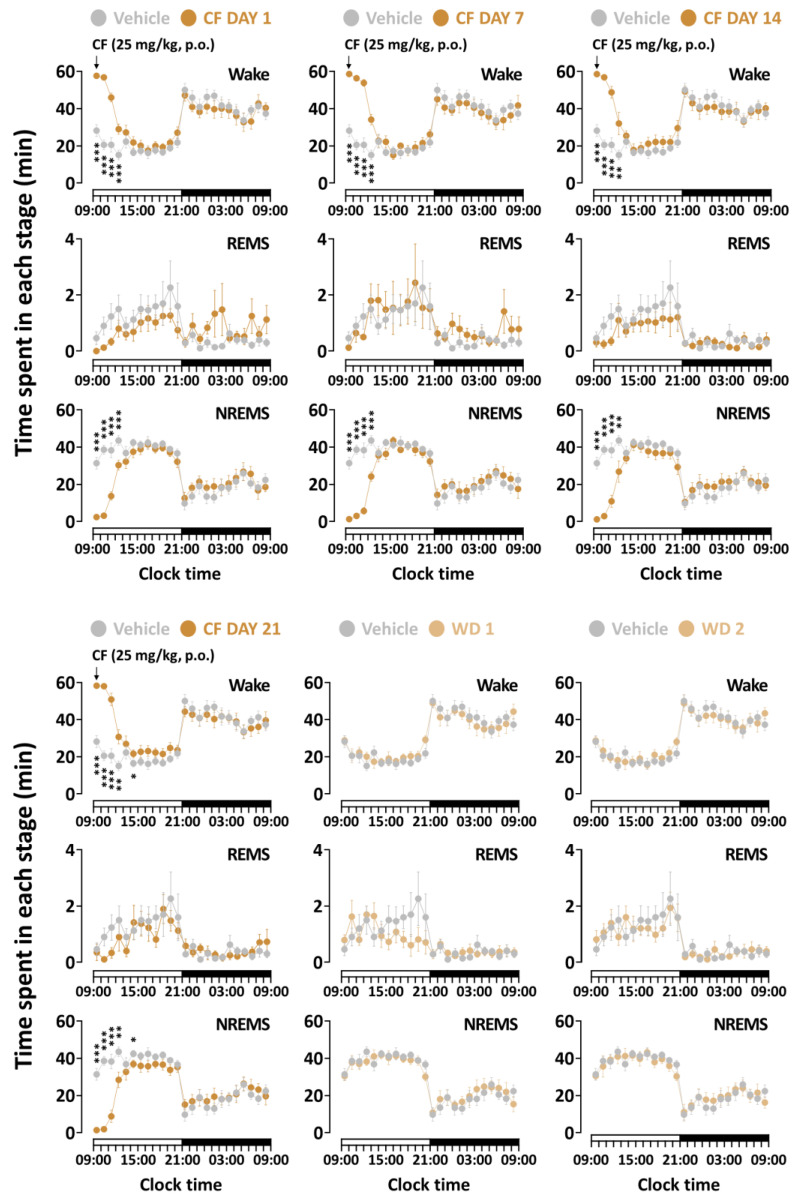
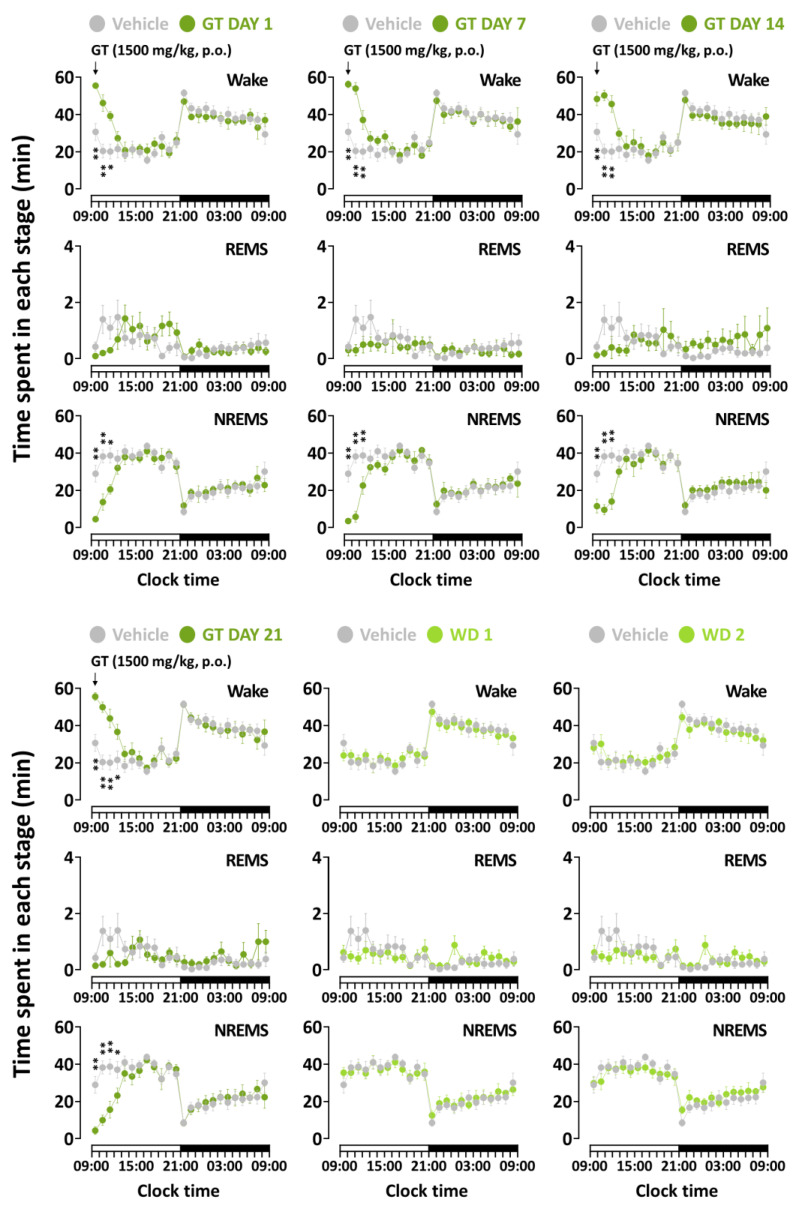
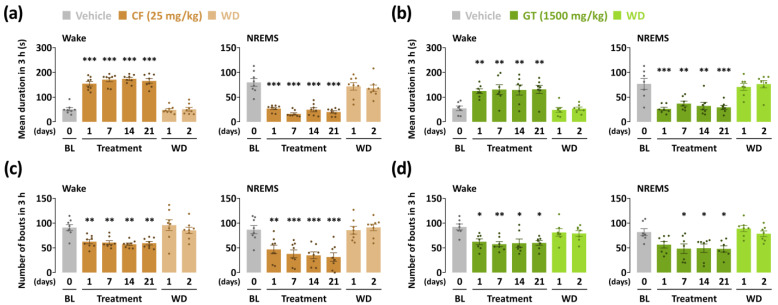
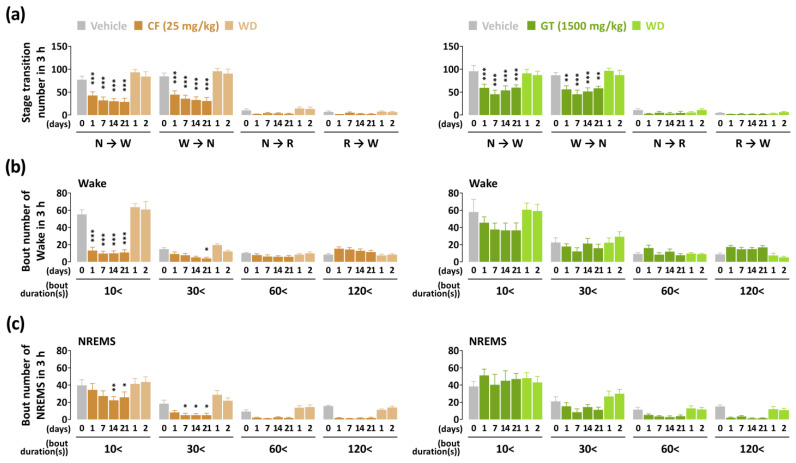
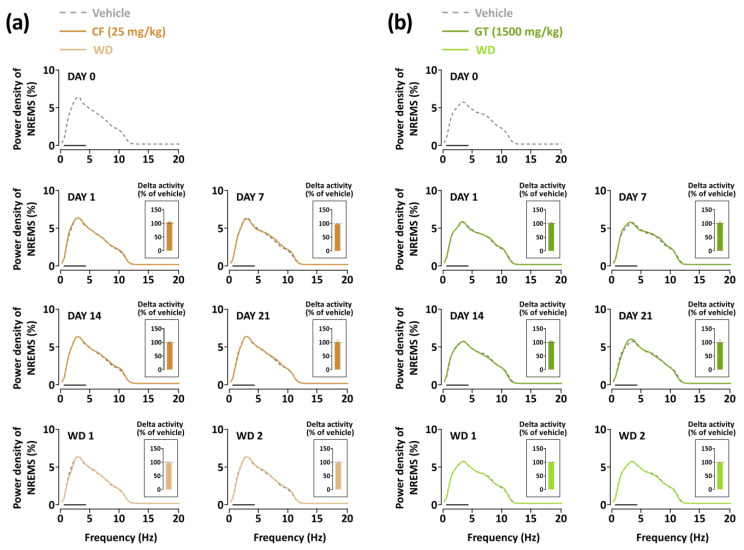
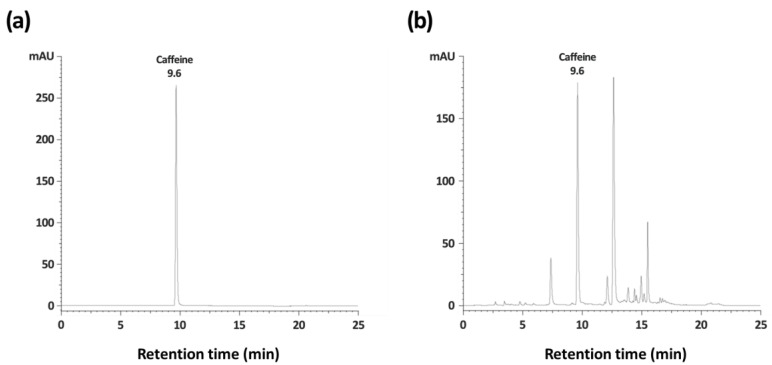
Wakefulness is defined as a state in which individuals can react to a change in situations. The number of people staying awake and compensating for lack of sleep has increased in recent years. Caffeine, a representative stimulant, is the most extensively consumed compound globally and is mainly consumed through coffee. Although green tea (Camellia sinensis L.) contains high caffeine content like coffee, its arousal-inducing effects have not yet been studied. In the present study, we aimed to identify the arousal-inducing effect of GT during a chronic administration period (three weeks) using analysis of sleep architecture. Treatment with GT (1500 mg/kg) significantly elevated the sleep latency and wakefulness throughout the treatment period, and chronic administration of GT consistently maintained an increase in wakefulness for up to 3 h. During the treatment period, the arousal-inducing effect of GT (1500 mg/kg) occurred without any change in the tolerance phenomenon or withdrawal symptoms, similar to that observed with caffeine (25 mg/kg). GT (1500 mg/kg) containing 95.6 mg/kg of caffeine did not produce a better arousal-inducing effect than caffeine at 25 mg/kg. These results indicate that the arousal-inducing effect of GT persisted for three weeks without adverse effects and that GT can control the arousal-inducing effects of caffeine due to the hypnotic effects of its other constituents.

Keywords: Camellia sinensis L.; arousal-inducing effect; caffeine; green tea ethanol extract; polysomnographic recording.


Conflict of interest statement

The authors declare no conflict of interest.

Figures

Figure 1
Figure 1
Experimental procedure involving chronic administration of GT for polysomnographic recordings. BL, baseline; p.o., per os administration.
Figure 2
Figure 2
Effects of chronic administration of caffeine (25 mg/kg) and GT (1500 mg/kg) on (a) sleep latency and (b) amount of wakefulness and NREMS stages during the 3 h after administration. Grey bars illustrate the baseline day (vehicle). Brown and green bars illustrate caffeine and GT treatments, respectively. Light brown and green bars illustrate the withdrawal (WD) days after caffeine and GT treatments, respectively. Every column denotes the mean ± SEM (n = 7–8). *** p < 0.001 indicates significant differences compared to the vehicle (Dunnett’s test). BL, baseline; CF, caffeine; GT, green tea ethanol extract; NREMS, non-rapid-eye-movement sleep; Wake, wakefulness; SEM, standard error of the mean.
Figure 3
Figure 3
Time-course changes of caffeine (25 mg/kg) treatment during each stage over the whole administration period. Grey circles illustrate the baseline day (vehicle). Brown circles illustrate caffeine treatment. Light brown circles illustrate the withdrawal (WD) day during the end of caffeine treatment. Every circle denotes the hourly mean ± SEM (n = 7–8) in each stage. * p < 0.05, ** p < 0.01, and *** p < 0.001 indicate significant differences compared to the vehicle (Dunnett’s test). BL, baseline; CF, caffeine; NREMS, non-rapid-eye-movement sleep; REMS, rapid-eye-movement sleep; Wake, wakefulness; SEM, standard error of the mean.
Figure 4
Figure 4
Time-course changes of GT (1500 mg/kg) treatment during each stage over the whole administration period. Grey circles indicate the baseline day (vehicle). Green circles illustrate GT treatment. Light green circles illustrate the withdrawal (WD) day during the end of GT treatment. Every circle denotes the hourly mean ± SEM (n = 7–8) in each stage. * p < 0.05, ** p < 0.01 indicate significant differences compared to the vehicle (Dunnett’s test). BL, baseline; GT, green tea ethanol extract; NREMS, non-rapid-eye-movement sleep; REMS, rapid-eye-movement sleep; Wake, wakefulness; SEM, standard error of the mean.
Figure 5
Figure 5
Features of sleep–wake bouts during the 3 h following sample treatment for the chronic administration period (21 days). (a) Changes in mean duration of wakefulness and NREMS after caffeine (25 mg/kg) treatment. (b) Changes in mean duration of wakefulness and NREMS after GT (1500 mg/kg) treatment. (c) The number of bouts of wakefulness and NREMS after caffeine treatment. (d) The number of bouts of wakefulness and NREMS after GT treatment. Grey bars illustrate the baseline day (vehicle). Brown and green bars illustrate days when caffeine and GT treatment were administered, respectively. Light brown and green bars illustrate withdrawal (WD) days after caffeine and GT treatments, respectively. Every column denotes the mean ± SEM (n = 7–8). * p < 0.05, ** p < 0.01, and *** p < 0.001, indicate significant differences compared to the vehicle (Dunnett’s test). CF, caffeine; GT, green tea ethanol extract; NREMS, non-rapid-eye-movement sleep; Wake, wakefulness; SEM, standard error of the mean.
Figure 6
Figure 6
(a) Changes in stage transition number during the 3 h following caffeine (25 mg/kg) and GT (1500 mg/kg) treatments for the chronic administration period (21 days). Changes in the number of bouts of (b) wakefulness and (c) NREMS after caffeine and GT treatments during the chronic administration period (21 days). Grey bars illustrate the baseline day (vehicle). Brown and green bars illustrate caffeine and GT treatments, respectively. Light green and brown bars illustrate the withdrawal (WD) day after of GT and caffeine treatments, respectively. Every column denotes the mean ± SEM (n = 7–8). * p < 0.05, ** p < 0.01, and *** p < 0.001 indicate significant differences compared to the vehicle (Dunnett’s test). CF, caffeine; GT, green tea ethanol extract; NREMS, non-rapid-eye-movement sleep; Wake, wakefulness; SEM, standard error of the mean.
Figure 7
Figure 7
Changes in the EEG power density curve in NREMS during the administration of (a) caffeine and (b) GT. Grey curves illustrate the baseline day (vehicle). Brown and green curves illustrate caffeine and GT treatments, respectively. Light brown and green curves illustrate the withdrawal (WD) days. The solid bar (—) illustrates the delta wave range from 0.5 to 4 Hz. The delta activity compared with vehicle is presented in the inset bar graph. CF, caffeine; GT, green tea ethanol extract; NREMS, non-rapid-eye-movement sleep; Wake, wakefulness.
Figure 8
Figure 8
HPLC analysis chromatogram of caffeine standard (a) and GT (b). GT, green tea ethanol extract.

Similar articles

Cited by

References

    1. Andrillon T., Windt J., Silk T., Drummond S.P., Bellgrove M.A., Tsuchiya N. Does the mind wander when the brain takes a break? Local sleep in wakefulness, attentional lapses and mind-wandering. Front. Neurosci. 2019;13:949. doi: 10.3389/fnins.2019.00949. - DOI - PMC - PubMed
    1. Houldin E., Fang Z., Ray L.B., Stojanoski B., Owen A.M., Fogel S.M. Reversed and increased functional connectivity in non-REM sleep suggests an altered rather than reduced state of consciousness relative to wake. Sci. Rep. 2021;11:11943. doi: 10.1038/s41598-021-91211-5. - DOI - PMC - PubMed
    1. Szymusiak R., McGinty D. Hypothalamic regulation of sleep and arousal. Ann. N. Y. Acad. Sci. 2008;1129:275–286. doi: 10.1196/annals.1417.027. - DOI - PubMed
    1. Roth T., Roehrs T. Insomnia: Epidemiology, characteristics, and consequences. Clin. Cornerstone. 2003;5:5–15. doi: 10.1016/S1098-3597(03)90031-7. - DOI - PubMed
    1. Mitchell D.C., Knight C.A., Hockenberry J., Teplansky R., Hartman T.J. Beverage caffeine intakes in the US. Food Chem. Toxicol. 2014;63:136–142. doi: 10.1016/j.fct.2013.10.042. - DOI - PubMed