. 2023 Jan 22;15(2):379.
doi: 10.3390/pharmaceutics15020379.

Interactions between DMPC Model Membranes, the Drug Naproxen, and the Saponin β-Aescin

Affiliations

Interactions between DMPC Model Membranes, the Drug Naproxen, and the Saponin β-Aescin

Pia Hägerbäumer et al. Pharmaceutics. .

Abstract

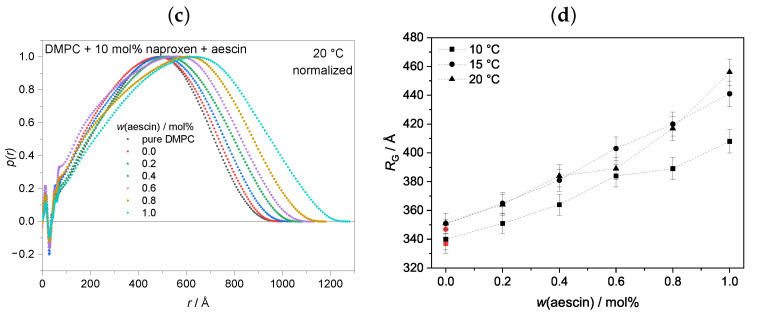
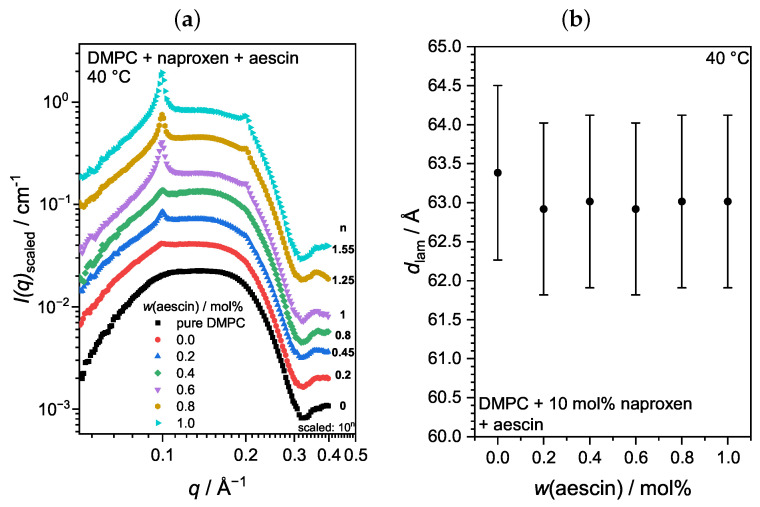
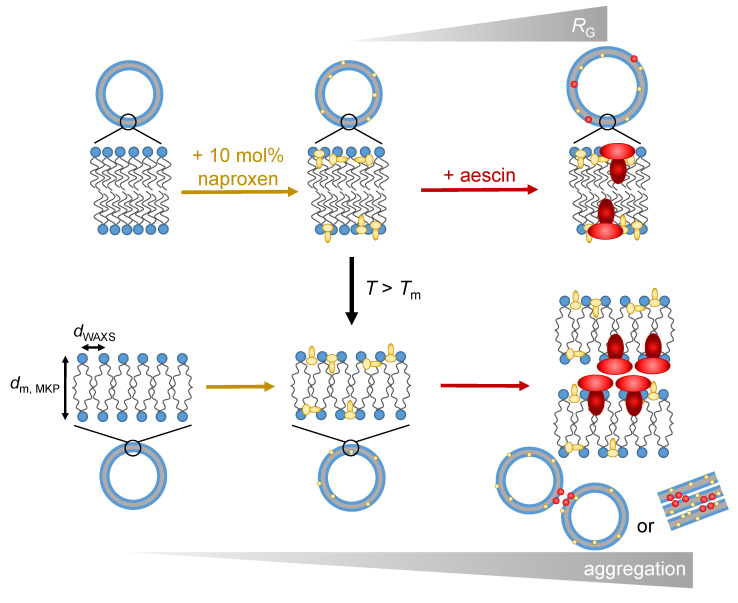
In this study, the interplay among the phospholipid 1,2-dimyristoyl-sn-glycero-3-phosphocholine (DMPC) as a model membrane, the nonsteroidal anti-inflammatory drug naproxen, and the saponin β-aescin are investigated. The naproxen amount was fixed to 10 mol%, and the saponin amount varies from 0.0 to 1.0 mol%. Both substances are common ingredients in pharmaceutics; therefore, it is important to obtain deeper knowledge of their impact on lipid membranes. The size and properties of the DMPC model membrane upon naproxen and aescin addition were characterized with differential scanning calorimetry (DSC), small- and wide-angle X-ray scattering (SAXS, WAXS), and photon correlation spectroscopy (PCS) in a temperature-dependent study. The interaction of all substances was dependent on the lipid phase state, which itself depends on the lipid's main phase transition temperature Tm. The incorporation of naproxen and aescin distorted the lipid membrane structure and lowers Tm. Below Tm, the DMPC-naproxen-aescin mixtures showed a vesicle structure, and the insertion of naproxen and aescin influenced neither the lipid chain-chain correlation distance nor the membrane thickness. Above Tm, the insertion of both molecules instead induced the formation of correlated bilayers and a decrease in the chain-chain correlation distance. The presented data clearly confirm the interaction of naproxen and aescin with DMPC model membranes. Moreover, the incorporation of both additives into the model membranes is evidenced.

Keywords: DMPC; DSC; PCS; SAXS; WAXS; naproxen; nonsteroidal anti-inflammatory drug; saponin; small unilamellar vesicles (SUVs); β-aescin.


Conflict of interest statement

The authors declare no conflict of interest.

Figures

Figure 1
Figure 1
Chemical structures of (a) phospholipid DMPC, (b) NSAID naproxen, and (c) saponin β-aescin.
Figure 2
Figure 2
(a) Endothermic DSC thermograms of vesicles containing DMPC, 10 mol% naproxen, and different amounts of aescin. The black lines show the Lorentzian fits to determine the maxima of the measured signals. The dashed gray line indicates the Tm of pure DMPC vesicles at 24.64±0.06°C. The addition of naproxen induced a shift of Tm to lower temperatures. Aescin amounts from 0.6 mol% and higher led to the appearance of a second peak below Tm. (b) The plot of Tm of the DMPC lipid membrane and the aescin-rich domains against w(aescin). As an example, the error bars for two data points are given. For the sake of clarity, the other data points were plotted without error bars.
Figure 3
Figure 3
WAXS curves of DMPC vesicles with (a) 10 mol% naproxen and (b) 10 mol% naproxen and 0.8 mol% aescin at different temperatures. The maximum of the WAXS signal shifted to lower q-values with increasing temperature. The open circles around 1.3 Å1 mark artifacts that were not considered for evaluation.
Figure 4
Figure 4
Temperature-dependent dWAXS values of the DMPC vesicles with naproxen and aescin, calculated from the peak maximum qpeak via Equation (3).
Figure 5
Figure 5
SAXS curves of (a) DMPC vesicles with 10 mol% naproxen and (b) vesicles with 10 mol% naproxen and 0.8 mol% aescin at different temperatures (see red numbers on the right). Scattering curves were scaled by powers of 10 for better visibility. Solid lines are IFT approximations to the scattering data.
Figure 6
Figure 6
Pair distance distribution functions p(r) of pure DMPC vesicles and vesicles containing naproxen and aescin at (a) 10 °C, (b) 15 °C and (c) 20 °C. Functions were normalized to the maximum of p(r) for better comparability. (d) Radius of gyration RG of DMPC vesicles containing naproxen and different amounts of aescin against w(aescin) at T=10°C,15°C and 20 °C. The dashed lines are only visual guides. The red symbols depict RG of pure DMPC vesicles.
Figure 6
Figure 6
Pair distance distribution functions p(r) of pure DMPC vesicles and vesicles containing naproxen and aescin at (a) 10 °C, (b) 15 °C and (c) 20 °C. Functions were normalized to the maximum of p(r) for better comparability. (d) Radius of gyration RG of DMPC vesicles containing naproxen and different amounts of aescin against w(aescin) at T=10°C,15°C and 20 °C. The dashed lines are only visual guides. The red symbols depict RG of pure DMPC vesicles.
Figure 7
Figure 7
MKP plots for DMPC vesicles (a) with 10 mol% naproxen and (b) with 10 mol% naproxen and 0.8 mol% aescin at T=10°C. Red lines are fourth-order polynomial fits.
Figure 8
Figure 8
Membrane thicknesses dm,MKP of vesicles determined via MKP approximation at T=10°C in dependence of w(aescin). The dashed line gives the mean value of dm,MKP at 34.67±0.21Å. The red circle depicts the membrane thickness of pure DMPC vesicles.
Figure 9
Figure 9
(a) SAXS curves of DMPC vesicles with 10mol% naproxen and varying amounts of aescin at T=40°C. Scattering curves are scaled by powers of 10 for better visibility. (b) Lamellar repeat distance dlam of the correlated bilayers calculated from the maximum of the first order Bragg peak at T=40°C.
Figure 10
Figure 10
Γ plotted against q2 measured by angle-dependent PCS at T=10°C for DMPC vesicles with 10 mol% naproxen and vesicles with 10 mol% naproxen and 0.8 mol% aescin. Black and red lines are linear fits to determine DT.
Figure 11
Figure 11
RH at T=10°C of the DMPC vesicles containing 10 mol% naproxen and aescin is plotted as a function of w(aescin). The red circle depicts the hydrodynamic radius of pure DMPC vesicles.
Figure 12
Figure 12
Schematic illustration of the proposed interplay of the drug naproxen and the saponin aescin with DMPC vesicles as model membranes. The figure displays the intercalation of both substances into the membranes and the aescin-induced formation of aggregates.

Similar articles

References

    1. Singer S.J., Nicolson G.L. The Fluid Mosaic Model of the Structure of Cell Membranes. Science. 1972;175:720–731. doi: 10.1126/science.175.4023.720. - DOI - PubMed
    1. Edidin M. Lipids on the frontier: A century of cell-membrane bilayers. Nat. Rev. Mol. Cell Biol. 2003;4:414–418. doi: 10.1038/nrm1102. - DOI - PubMed
    1. Kiselev M.A. Methods for Lipid Nanostructure Investigation at Neutron and Synchrotron Sources. Phys. Part. Nucl. 2011;42:302–331. doi: 10.1134/S1063779611020055. - DOI
    1. Cevc G. Lipid vesicles and other colloids as drug carriers on the skin. Adv. Drug Deliv. Rev. 2004;56:675–711. doi: 10.1016/j.addr.2003.10.028. - DOI - PubMed
    1. Li J., Wang X., Zhang T., Wang C., Huang Z., Luo X., Deng Y. A review on phospholipids and their main applications in drug delivery systems. Asian J. Pharm. Sci. 2015;10:81–98. doi: 10.1016/j.ajps.2014.09.004. - DOI

LinkOut - more resources