. 2023 Jan 24;15(2):391.
doi: 10.3390/pharmaceutics15020391.

Ginsenoside Rg3 Reduces the Toxicity of Graphene Oxide Used for pH-Responsive Delivery of Doxorubicin to Liver and Breast Cancer Cells

Affiliations

Ginsenoside Rg3 Reduces the Toxicity of Graphene Oxide Used for pH-Responsive Delivery of Doxorubicin to Liver and Breast Cancer Cells

Shadi Rahimi et al. Pharmaceutics. .

Abstract

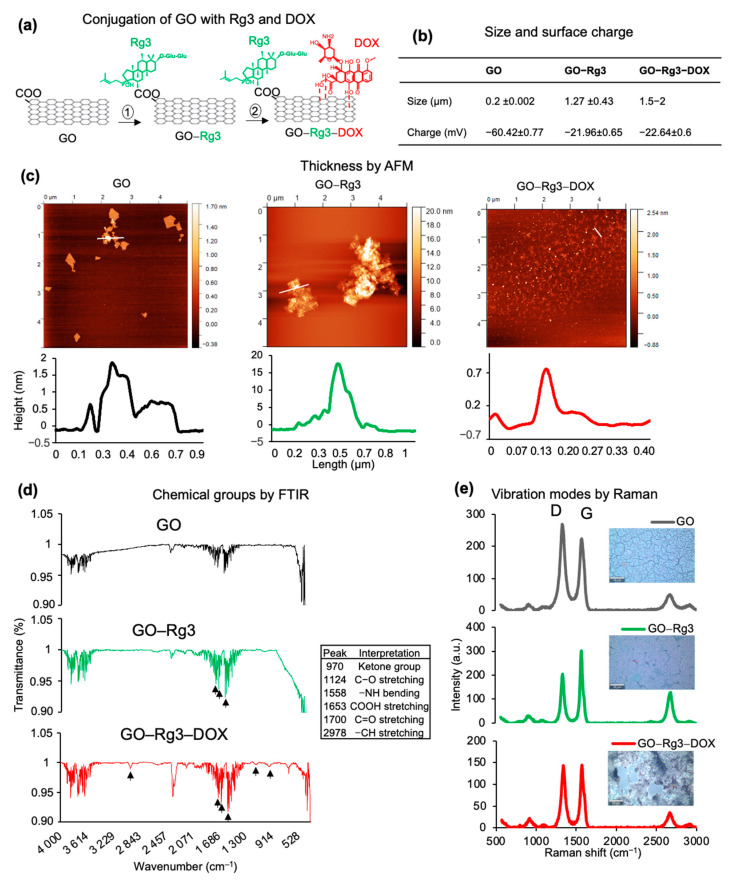
Doxorubicin (DOX) is extensively used in chemotherapy, but it has serious side effects and is inefficient against some cancers, e.g., hepatocarcinoma. To ameliorate the delivery of DOX and reduce its side effects, we designed a pH-responsive delivery system based on graphene oxide (GO) that is capable of a targeted drug release in the acidic tumor microenvironment. GO itself disrupted glutathione biosynthesis and induced reactive oxygen species (ROS) accumulation in human cells. It induced IL17-directed JAK-STAT signaling and VEGF gene expression, leading to increased cell proliferation as an unwanted effect. To counter this, GO was conjugated with the antioxidant, ginsenoside Rg3, prior to loading with DOX. The conjugation of Rg3 to GO significantly reduced the toxicity of the GO carrier by abolishing ROS production. Furthermore, treatment of cells with GO-Rg3 did not induce IL17-directed JAK-STAT signaling and VEGF gene expression-nor cell proliferation-suggesting GO-Rg3 as a promising drug carrier. The anticancer activity of GO-Rg3-DOX conjugates was investigated against Huh7 hepatocarcinoma and MDA-MB-231 breast cancer cells. GO-Rg3-DOX conjugates significantly reduced cancer cell viability, primarily via downregulation of transcription regulatory genes and upregulation of apoptosis genes. GO-Rg3 is an effective, biocompatible, and pH responsive DOX carrier with potential to improve chemotherapy-at least against liver and breast cancers.

Keywords: doxorubicin; drug carrier; drug delivery; ginsenoside Rg3; graphene oxide.


Conflict of interest statement

Daniel van Leeuwen is currently an employee of AstraZeneca.

Figures

Figure 1
Figure 1
Physical and chemical characterization of GO, GO–Rg3, and GO–Rg3–DOX. (a) Schematic depiction of conjugation of GO with Rg3 and DOX. The dotted lines indicate non-covalent binding of DOX to GO. (b) Size and surface charge of GO, GO–Rg3, and GO–Rg3–DOX. (c) Representative AFM images of GO, GO–Rg3, and GO–Rg3–DOX. Height profile of white lines is shown below each AFM image. (d) FTIR analysis of GO, GO–Rg3, and GO–Rg3–DOX. The respective peaks shown by black arrows are listed in the table. (e) Raman spectra (left) and bright filed images (right) of GO, GO–Rg3, and GO–Rg3–DOX taken by Raman microscopy.
Figure 2
Figure 2
GO alone induces ROS generation in Huh7 cells, which leads to a small decrease of cell viability upon longer exposure. (a) TEM images of Huh7 control cells and cells treated with 400 µg/mL of GO for 6 h. Evidence of GO internalization is marked with white boxes, with higher magnification images and black arrows pointing to internalized GO flakes. (b) AlamarBlue cell viability assay 24 h after administration of different concentrations of GO. All values are normalized to those obtained for untreated cells (medium alone). The positive control was 10% DMSO. (c) ROS production induced by 400 µg/mL of GO after 24 h of treatment, measured at excitation at 488 nm on a flow cytometer based on the formation of the fluorescent compound 2′,7′-dichlorofluorescein (DCF) in presence of ROS. Median 488 values represent DCF fluorescent signal and are normalized to the signal from untreated cells. H2O2 was used as a positive control. (d) SEM images of Huh7 cells treated with 400 µg/mL of GO for 24 h. Untreated cells are shown as control. Relevant to panel B and C, data represent the mean ± SE of three independent replicates and it was statistically analyzed and compared with the control (* p < 0.05) using Student’s t test.
Figure 3
Figure 3
RNA sequencing supports mitigated toxicity of GO by Rg3 conjugation. (a) Volcano plots show differentially expressed genes of each treatment. The cut-off for |log2FC| is >1; the cut-off for adjusted p-value is 1 × 10⁻⁴, NS, not significant. (b) Venn diagrams showing the number of common and specific overexpressed (right) and under-expressed genes (left) in treatments compared with the control. The cut-off for |log2FC| is >1; the cut-off for adjusted p-value is 0.01. (c) Barplot of expression of 22 genes differentially expressed genes in GO–Rg3 compared with control. Shown are the log2 transformed count per million (CPM) levels of genes in untreated samples (yellow), treated samples with GO (purple), and treated samples with GO–Rg3 (green). The cut-off for |log2FC| is >1; the cut-off for adjusted p-value is 0.01. (d) Directional GSA of DE analysis for GO- and GO–Rg3-treated versus control and GO–Rg3- versus GO-treated samples. Only the Hallmark gene set collection is shown here and sets with <10 genes were excluded. The more significant (lower value) of the two directional p-values for each gene set is shown in the heatmap as a log10-transformed value. The distinct directional gene set p-values (padj.dist.dir) are calculated for coordinated increases (padj,dist-dir-up) and decreases (padj,dist-dir-down) in expression. The value is also “signed,” meaning that gene sets with a more significant decrease than increase (padj,dist-dir-down < padj,dist-dir-up) are negative; otherwise, they are positive. Only gene sets with a padj,dist-dir less than 0.01 in at least one comparison are shown.
Figure 4
Figure 4
Conjugation of Rg3 with GO reduces oxidative stress induced by the nanocarrier in Huh7 cells. (a) TEM images of Huh7 control cells and cells treated with 400 µg/mL GO for 6 h. Evidence of GO internalization is marked with white boxes, with higher magnification images and black arrows pointing to internalized GO flakes. (b) AlamarBlue cell viability assay of Huh7 cells treated with GO–Rg3 for 24 h. GO–Rg3 was prepared using the 0.5 mg/mL solution of Rg3 for loading. Different concentrations of GO–Rg3 were administered. All values were normalized to those obtained from untreated cells (medium only). The positive control was 10% DMSO. (c) ROS production induced by 24 h exposure of Huh7 cells to 400 µg/mL GO–Rg3. ROS was measured at excitation at 488 nm on a flow cytometer based on the formation of the fluorescent compound 2′,7′-dichlorofluorescein (DCF) in presence of ROS. Median 488 values represent DCF fluorescent signal and are normalized to the signal from untreated cells. H2O2 was used as a positive control. (d) Schematic model of GO (Top) and GO–Rg3 (Down) internalization into Huh7 cells and downstream effects. (Top) GO internalized through endocytosis, under-expressed oxidative phosphorylation, and glutathione-biosynthesis-related genes, leading ROS accumulation. GO enhances cell proliferation through upregulation and activation of JAK-STAT signaling and VEGF. (Down) GO–Rg3 mitigates toxicity of GO by restoring the expression level of oxidative phosphorylation and glutathione biosynthesis genes, leading to reduced ROS production. GO–Rg3 moderates the expression of JAK-STAT signaling and VEGF, leading to normal cell proliferation. Red- and blue-colored genes were over- and under-expressed, respectively, while black means unchanged expression. Relevant to panel B and C, data represent the mean ± SE of three independent replicates and it was statistically analyzed and compared with the control (*: p < 0.05, ns: not significant) using Student’s t test.
Figure 5
Figure 5
Cytotoxicity of GO–Rg3–DOX against Huh7 cells. (a) TEM images of Huh7 cells treated with 100 µg/mL GO–Rg3–DOX for 6 h compared to untreated cells. Evidence of extracellular GO and GO internalization are marked with white boxes, with higher magnification images and black arrows pointing to GO flakes. (b) AlamarBlue cell viability assay 24 h after administration of different concentrations of GO–Rg3–DOX. All values were normalized to those obtained from untreated cells (medium only). The positive controls were 10% DMSO and 2 µg/mL DOX. (c) SEM images of Huh7 cells treated with GO–Rg3–DOX (400 µg/mL) for 24 h, compared to untreated cells as control. (d) ROS production induced by GO–Rg3–DOX 24 h after administration, measured at excitation at 488 nm on a flow cytometer based on the formation of the fluorescent compound 2′,7′-dichlorofluorescein (DCF) in presence of ROS. Median 488 values represent DCF fluorescent signal and are normalized to the signal from untreated cells. H2O2 was used as a positive control. (e) Schematic representation of GO–Rg3–DOX internalization and downstream effects. Upon GO–Rg3–DOX treatment, transcription-related genes were under-expressed, while ROS-scavengers-related genes were overexpressed to detoxify the cell. Under-expression of TNFAIP8 and overexpression of GZMM and TNFSF14 induce cancer cell apoptosis. Red- and blue-colored genes were over- and under-expressed, respectively. Relevant to panel B and E, data represent the mean ± SE of three independent replicates and it was statistically analyzed and compared with the control (* p < 0.05) using Student’s t test.
Figure 6
Figure 6
Rg3 and DOX cytotoxicity in human breast cancer MDA-MB-231 cells. (a) AlamarBlue assay 24 h after GO administration. All values were normalized to those obtained from untreated cells (medium only). The positive control was 10% DMSO. (b) AlamarBlue assay 24 h after GO–Rg3 administration. All values were normalized to those obtained from untreated cells (medium only). The positive control was 10% DMSO. (c) AlamarBlue assay 24 h after GO–Rg3–DOX administration. All values were normalized to those obtained from untreated cells (medium only). The positive control was 10% DMSO. In all panels, ROS production 24 h after administration is shown on the right side, measured at excitation at 488 nm on a flow cytometer based on the formation of the fluorescent compound 2′,7′-dichlorofluorescein (DCF) in presence of ROS. Median 488 values represent DCF fluorescent signal and are normalized to the signal from untreated cells. H2O2 was used as a positive control. Relevant to all panels, data represent the mean ± SE of three independent replicates and it was statistically analyzed and compared with the control (* p < 0.05) using Student’s t test.

Similar articles

Cited by

References

    1. Bernstein W.B. Hunter’s Tropical Medicine and Emerging Infectious Diseases. Elsevier; Amsterdam, The Netherlands: 2020. Cancer in the Tropics; pp. 178–188.
    1. Hu S.W., Wang J., Zhang T.T., Li X.L., Chen H.Y., Xu J.J. Targeted Transmembrane Delivery of Ca 2+ via FA-Nanogel for Synergistically Enhanced Chemotherapy. ACS Appl. Mater. Interfaces. 2019;11:16412–16420. doi: 10.1021/acsami.9b04967. - DOI - PubMed
    1. Liu G., Tsai H., Zeng X., Zuo Y., Tao W., Han J., Mei L. Phosphorylcholine-Based Stealthy Nanocapsules Enabling Tumor Microenvironment-Responsive Doxorubicin Release for Tumor Suppression. Theranostics. 2017;7:1192–1203. doi: 10.7150/thno.17881. - DOI - PMC - PubMed
    1. Chen C.-T., Wang Z.-H., Hsu C.-C., Lin H.-H., Chen J.-H. In Vivo Protective Effects of Diosgenin against Doxorubicin-Induced Cardiotoxicity. Nutrients. 2015;7:4938–4954. doi: 10.3390/nu7064938. - DOI - PMC - PubMed
    1. Su Z., Ye J., Qin Z., Ding X. Protective Effects of Madecassoside against Doxorubicin Induced Nephrotoxicity in Vivo and in Vitro. Sci. Rep. 2016;5:18314. doi: 10.1038/srep18314. - DOI - PMC - PubMed