. 2023 Feb 10;15(2):595.
doi: 10.3390/pharmaceutics15020595.

Quantitative Assessment of Low-Dose Photodynamic Therapy Effects on Diabetic Wound Healing Using Raman Spectroscopy

Affiliations

Quantitative Assessment of Low-Dose Photodynamic Therapy Effects on Diabetic Wound Healing Using Raman Spectroscopy

Hala Zuhayri et al. Pharmaceutics. .

Abstract

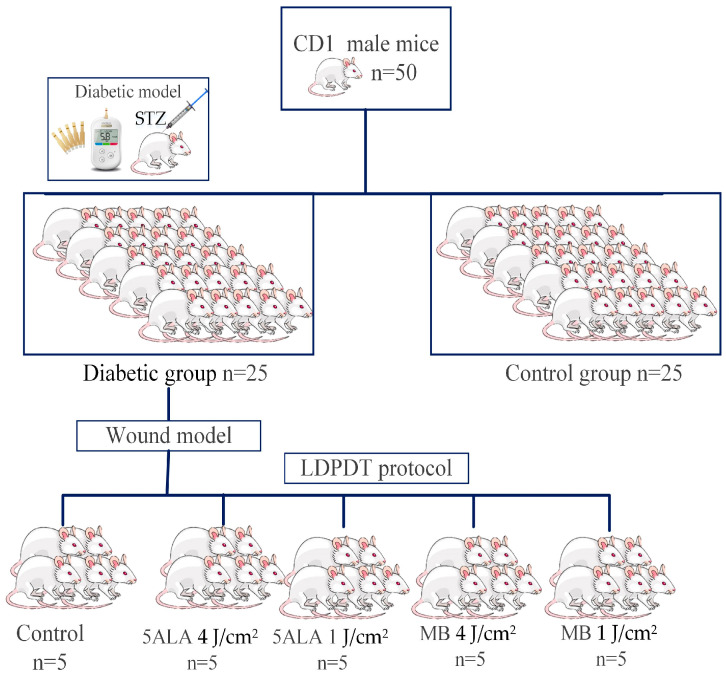
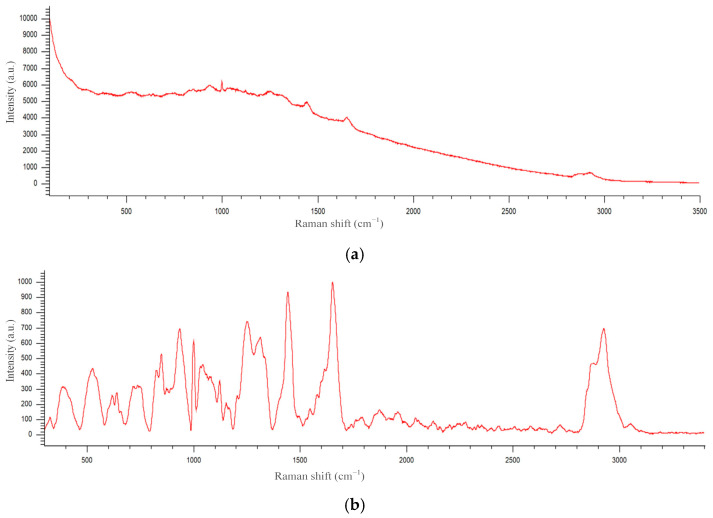
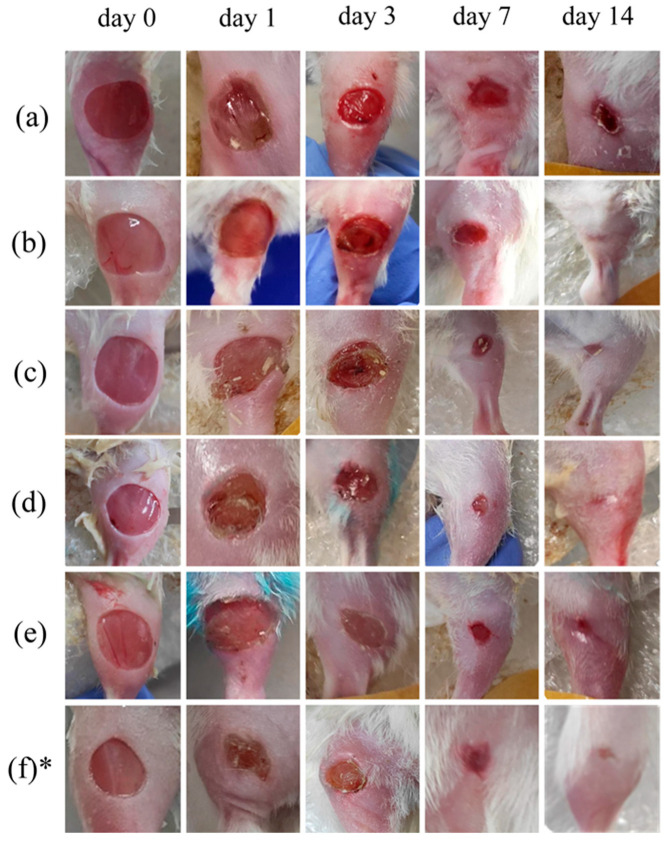
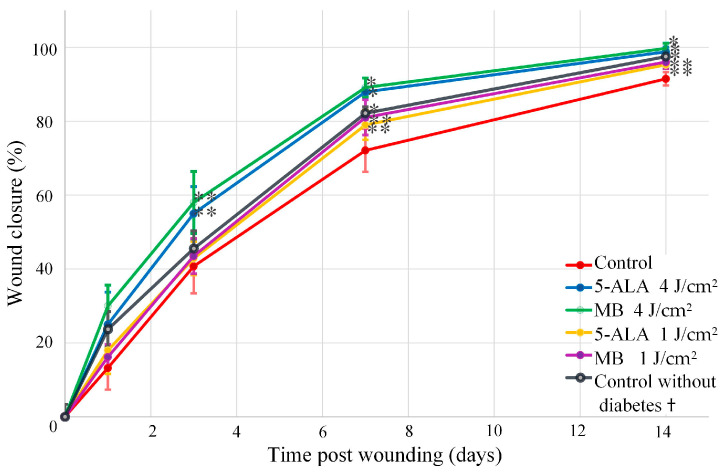
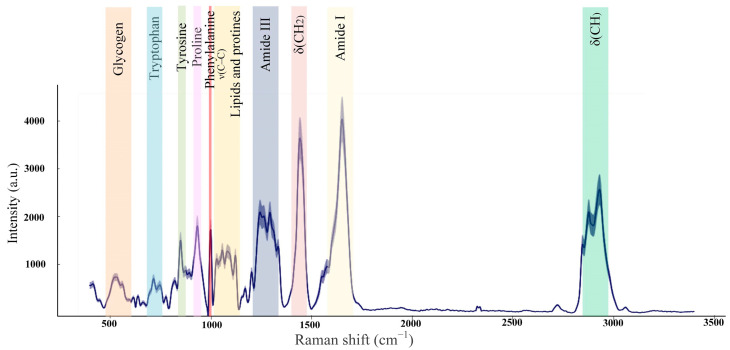
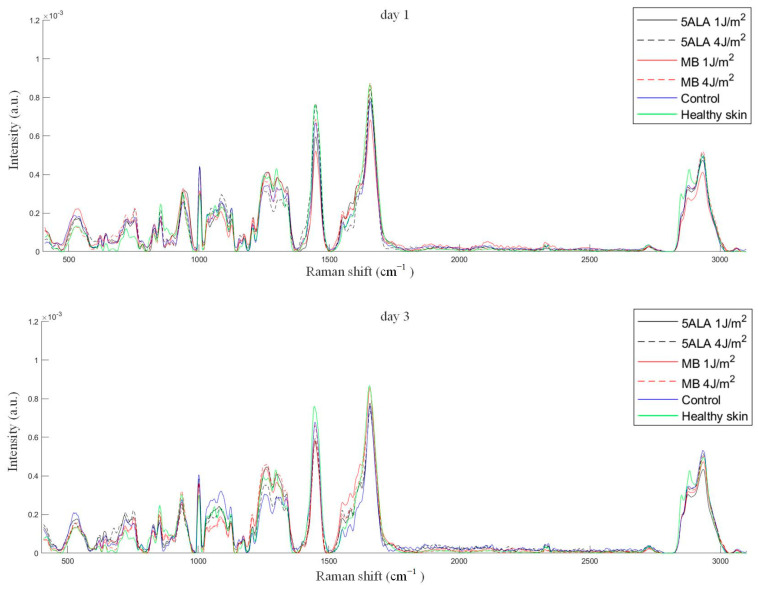
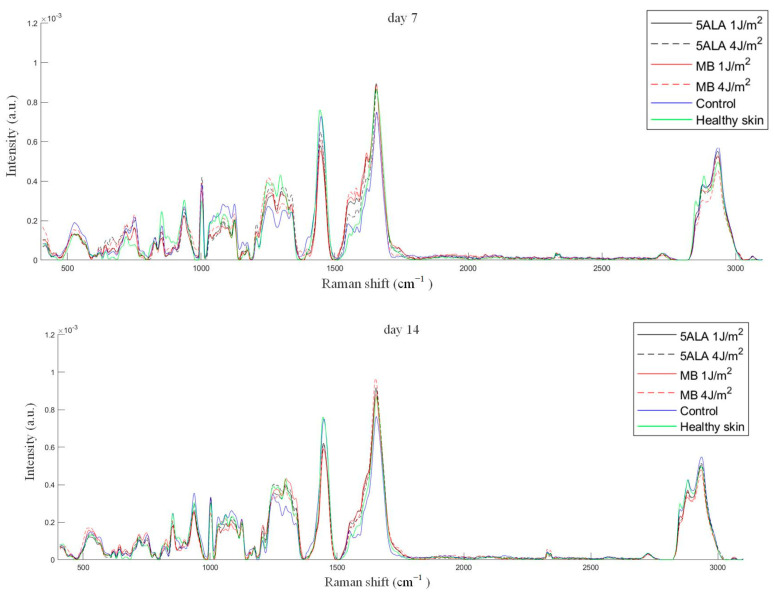
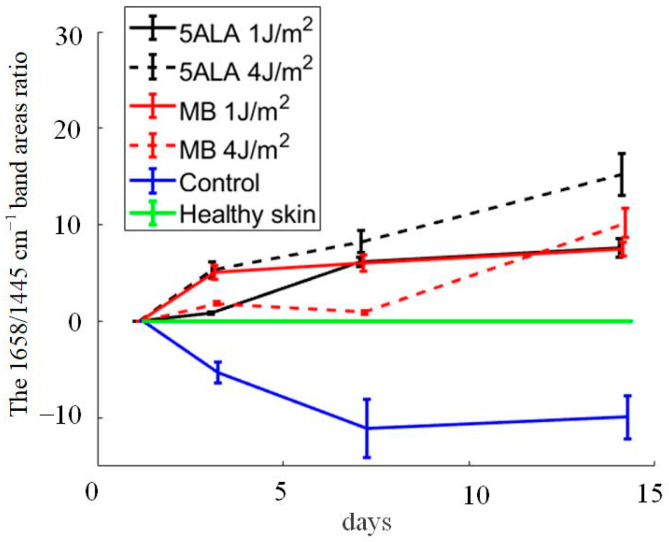
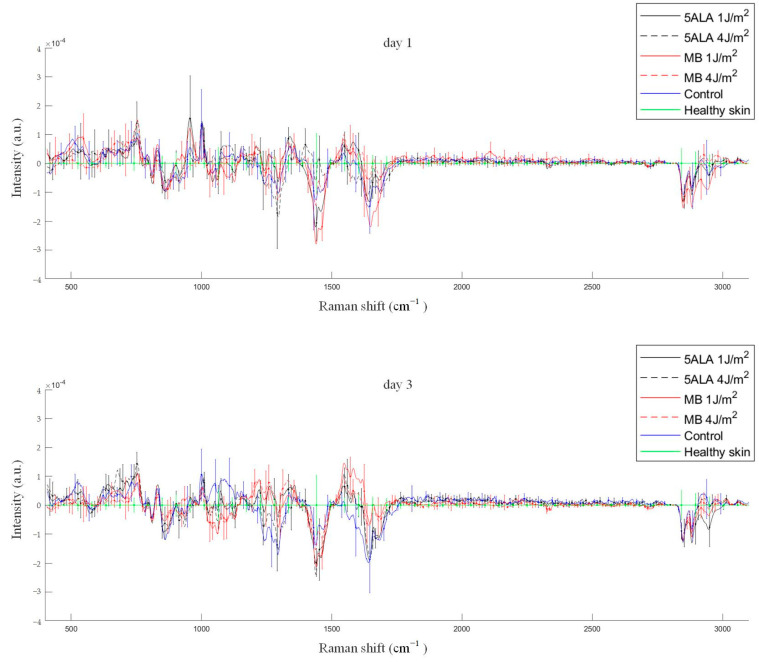
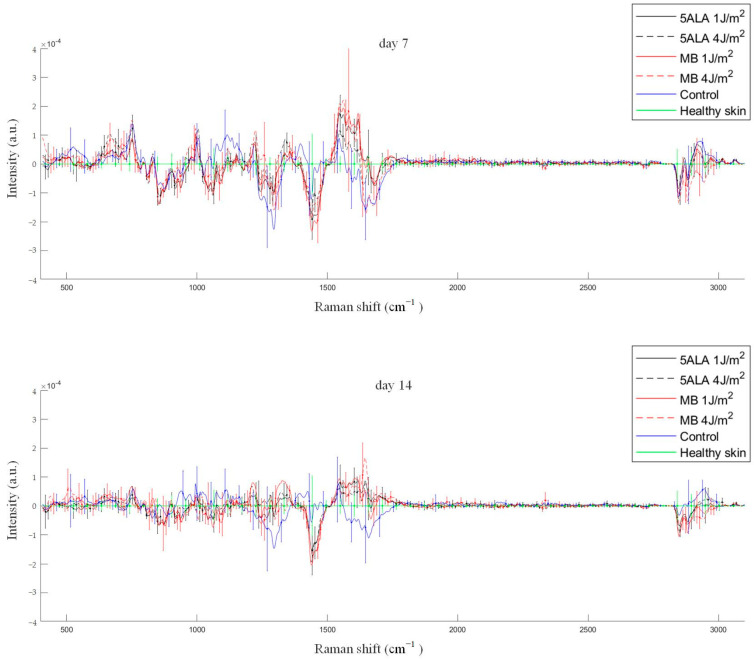
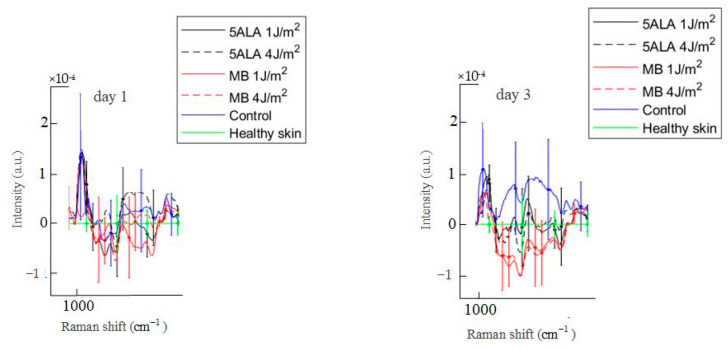
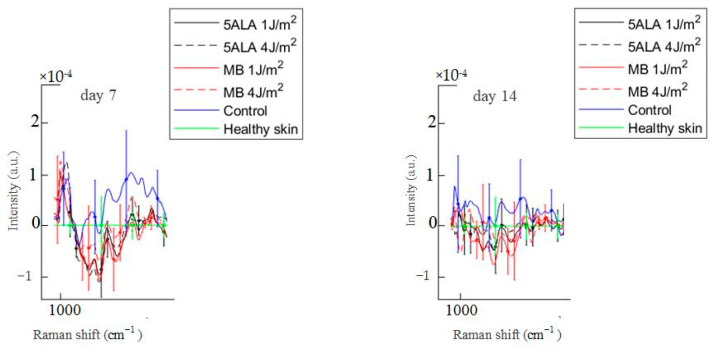
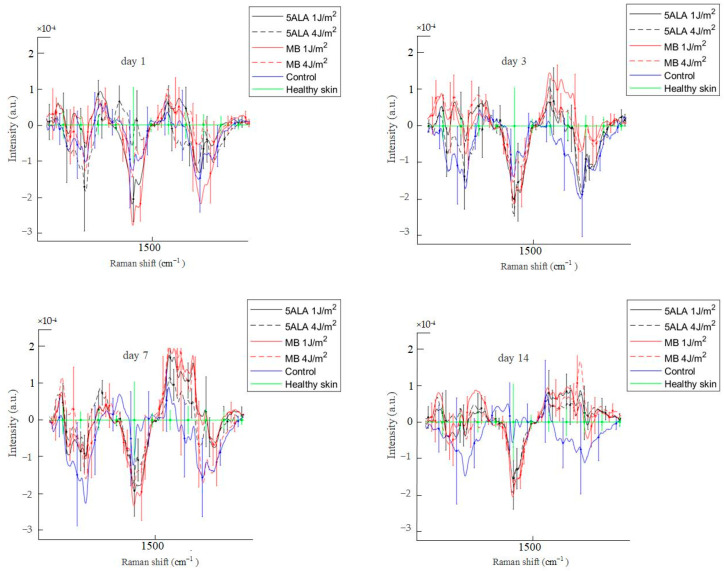
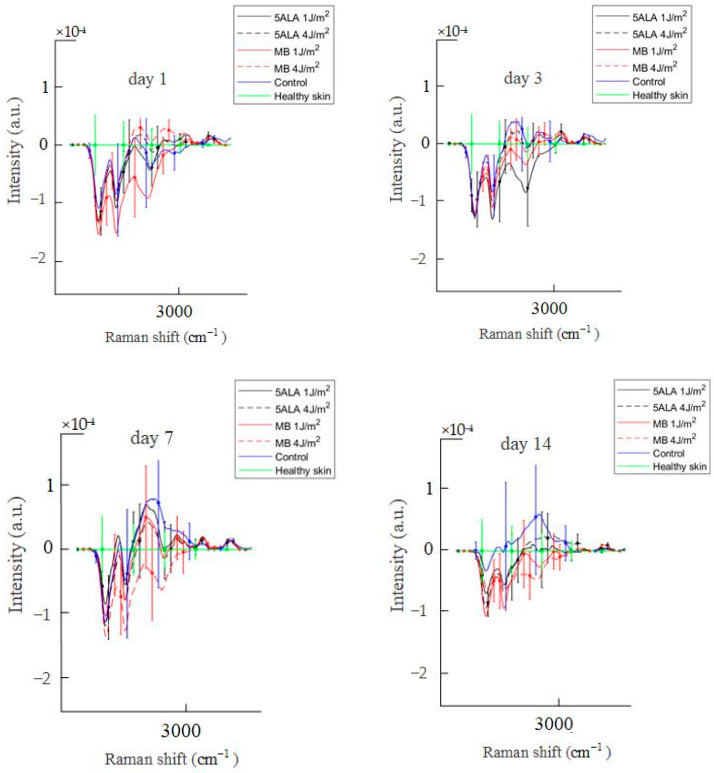
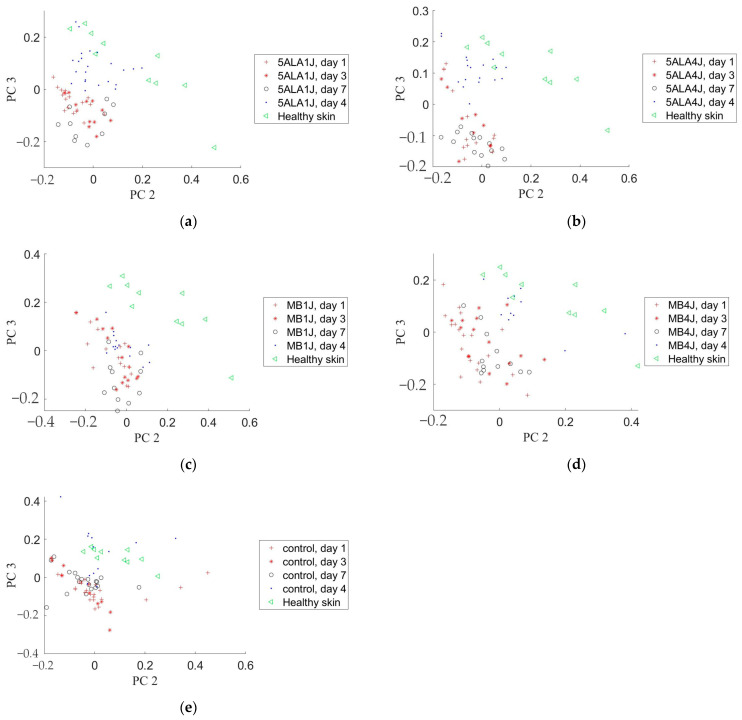
One of challenges that faces diabetes is the wound healing process. The delayed diabetic wound healing is caused by a complicated molecular mechanism involving numerous physiological variables. Low-dose photodynamic therapy (LDPDT) provides excellent results in rejuvenation and wound healing. In this study, the LDPDT effect on diabetic wounds in mice was studied using two photosensitizers, 5-aminolevulinic acid and methylene blue, and two laser dose expositions of 1 J/cm2 and 4 J/cm2 by Raman spectroscopy (RS). The latter was used as a noninvasive method, providing specific information about tissue state based on the fundamental vibrational modes of its molecular components. RS allows high spatial resolution acquisition of biochemical and structural information through the generation of point spectra or spectral images. An approach to in vivo quantitative assessment of diabetic wound healing state was developed. This approach is based on an application of the principal component analysis combined with the Mahalanobis metrics to skin Raman spectra, in particular, intensities of the amide I and CH2 bands.

Keywords: Mahalanobis distance; Raman spectroscopy; diabetes; low dose photodynamic therapy; principal component analysis; wound healing.


Conflict of interest statement

The authors declare no conflict of interest.

Figures

Figure 1
Figure 1
A mouse anesthetized by isoflurane, using the Ugo Basile gas anesthesia system (Italy).
Figure 2
Figure 2
The experimental research design.
Figure 3
Figure 3
The mouse in the working field of the confocal Raman spectrometer.
Figure 4
Figure 4
A tissue image on the Raman spectrometer camera screen.
Figure 5
Figure 5
An example of a Raman spectrum before (a) and after (b) background subtraction.
Figure 6
Figure 6
Digital photos of the wound healing progression from day 0 to day 14: (a) control group, (b) 5-ALA 4 J/cm2 group, (c) 5-ALA 1 J/cm2 group, (d) MB 4 J/cm2 group, (e) MB 1 J/cm2 group, (f) healthy control without diabetes. * This line of pictures was adapted from [6] under CC BY 4.0 license. 2022, MDPI).
Figure 7
Figure 7
Wound healing progression in the following groups: red line—control, blue line—5-ALA 4 J/cm2, green line—MB 4 J/cm2, yellow line—5-ALA 1 J/cm2, purple line—MB 4 J/cm2, black line—control without diabetes. (The number of mice was equal to 3 for each group), * p-value < 0.05, ** p-value < 0.1. † The wound areas of control without diabetes were taken from a previous study of the authors [6].
Figure 8
Figure 8
Mice healthy skin average Raman spectra (the number of processed Raman spectra was equal to 20).
Figure 9
Figure 9
The mean Raman spectra of skin wounds in all groups on all observation days and healthy skin, black line—5ALA 1 J/cm2, black dashed line—5ALA 4 J/cm2, red line—MB 1 J/cm2, red dashed line—MB 4 J/cm2, blue line—control, green line—healthy skin (the number of processed Raman spectra was equal to 30 for each group).
Figure 9
Figure 9
The mean Raman spectra of skin wounds in all groups on all observation days and healthy skin, black line—5ALA 1 J/cm2, black dashed line—5ALA 4 J/cm2, red line—MB 1 J/cm2, red dashed line—MB 4 J/cm2, blue line—control, green line—healthy skin (the number of processed Raman spectra was equal to 30 for each group).
Figure 10
Figure 10
The 1658/1445 cm−1 band areas ratio during wound healing in the following groups: black line—5ALA 1 J/cm2, black dashed line—5ALA 4 J/cm2, red line—MB 1 J/cm2, red dashed line—MB 4 J/cm2, blue line—control, green line—healthy skin (the number of processed Raman spectra was equal to 30 for each group).
Figure 11
Figure 11
Differences between the wound Raman spectra of all groups subtracting the healthy skin mean Raman spectrum. The Raman spectra are presented in terms of mean ± StD values. Black line—5ALA 1 J/cm2, black dashed line—5ALA 4 J/cm2, red line—MB 1 J/cm2, red dashed line—MB 4 J/cm2, blue line—control, green line—healthy skin (the number of processed Raman spectra was equal to 30 for each group).
Figure 11
Figure 11
Differences between the wound Raman spectra of all groups subtracting the healthy skin mean Raman spectrum. The Raman spectra are presented in terms of mean ± StD values. Black line—5ALA 1 J/cm2, black dashed line—5ALA 4 J/cm2, red line—MB 1 J/cm2, red dashed line—MB 4 J/cm2, blue line—control, green line—healthy skin (the number of processed Raman spectra was equal to 30 for each group).
Figure 12
Figure 12
Difference between the wound Raman spectra of all groups subtracting the healthy skin mean Raman spectrum in the 1020–1140 cm−1 spectral range. The Raman spectra are presented in terms of mean ± StD values. Black line—5ALA 1 J/cm2, black dashed line—5ALA 4 J/cm2, red line—MB 1 J/cm2, red dashed line—MB 4 J/cm2, blue line—control, green line—healthy skin (the number of processed Raman spectra was equal to 30 for each group).
Figure 12
Figure 12
Difference between the wound Raman spectra of all groups subtracting the healthy skin mean Raman spectrum in the 1020–1140 cm−1 spectral range. The Raman spectra are presented in terms of mean ± StD values. Black line—5ALA 1 J/cm2, black dashed line—5ALA 4 J/cm2, red line—MB 1 J/cm2, red dashed line—MB 4 J/cm2, blue line—control, green line—healthy skin (the number of processed Raman spectra was equal to 30 for each group).
Figure 13
Figure 13
Difference between the wound Raman spectra of all groups subtracting the healthy skin mean Raman spectrum in the 1200–1750 cm−1 spectral range. The Raman spectra are presented in terms of mean ± StD values. Black line—5ALA 1 J/cm2, black dashed line—5ALA 4 J/cm2, red line—MB 1 J/cm2, red dashed line—MB 4 J/cm2, blue line—control, green line—healthy skin (the number of processed Raman spectra was equal to 30 for each group).
Figure 14
Figure 14
Difference between the wound Raman spectra of all groups subtracting the healthy skin mean Raman spectrum in the 2700–3000 cm−1 spectral range. The Raman spectra are presented in terms of mean ± StD values. Black line—5ALA 1 J/cm2, black dashed line—5ALA 4 J/cm2, red line—MB 1 J/cm2, red dashed line—MB 4 J/cm2, blue line—control, green line—healthy skin (the number of processed Raman spectra was equal to 30 for each group).
Figure 15
Figure 15
Principal component analysis of the wound and healthy skin Raman spectra in the 2800–3000 cm−1 spectral range on different observation days in a subspace of PC2 and PC3: (a) 5-ALA 1 J/cm2 group, (b) 5-ALA 4 J/cm2 group, (c) MB 1 J/cm2 group, (d) MB 4 J/cm2 group, (e) the control group.

Similar articles

Cited by

References

    1. International Diabetes Federation . IDF Diabetes Atlas. 10th ed. International Diabetes Federation; Brussels, Belgium: 2021. [(accessed on 26 November 2022)]. Available online: https://diabetesatlas.org/
    1. Spampinato S.F., Caruso G.I., De Pasquale R., Sortino M.A., Merlo S. The Treatment of Impaired Wound Healing in Diabetes: Looking among Old Drugs. Pharmaceuticals. 2020;13:60. doi: 10.3390/ph13040060. - DOI - PMC - PubMed
    1. Ji J.-Y., Ren D.-Y., Weng Y.-Z. Efficiency of Multifunctional Antibacterial Hydrogels for Chronic Wound Healing in Diabetes: A Comprehensive Review. Int. J. Nanomed. 2022;17:3163–3176. doi: 10.2147/IJN.S363827. - DOI - PMC - PubMed
    1. Dinh T., Elder S., Veves A. Delayed Wound Healing in Diabetes: Considering Future Treatments. Diabetes Manag. 2011;1:509–519. doi: 10.2217/dmt.11.44. - DOI
    1. Patel S., Srivastava S., Singh M.R., Singh D. Mechanistic Insight into Diabetic Wounds: Pathogenesis, Molecular Targets and Treatment Strategies to Pace Wound Healing. Biomed. Pharmacother. 2019;112:108615. doi: 10.1016/j.biopha.2019.108615. - DOI - PubMed

LinkOut - more resources