. 2023 Feb;11(2):e776.
doi: 10.1002/iid3.776.

Ononin alleviates DSS-induced colitis through inhibiting NLRP3 inflammasome via triggering mitophagy

Affiliations

Ononin alleviates DSS-induced colitis through inhibiting NLRP3 inflammasome via triggering mitophagy

Ting Yu et al. Immun Inflamm Dis. 2023 Feb.

Abstract

Background: Ononin, a flavonoid isolated from Astragalus membranaceus root, is the active ingredient of A. membranaceus and has potential anti-inflammatory properties, but its effect on colitis is unclear.

Aims: This study aimed to explore the anticolitis effect of Ononin by establishing a colitis model in mice induced by dextran sulfate sodium (DSS).

Methods: Male C57BL/6 mice were provided DSS, then treated with Ononin (10, 20, 40 mg/kg) or 5-ASA (40 mg/kg). The colitis symptoms were observed, the disease activity index (DAI) score were recorded daily, and colonic inflammation was evaluted by histopathological scoring. The expression of cytokines, inflammatory mediators, and mitophagy/NLRP3 inflammasome-related proteins were measured.

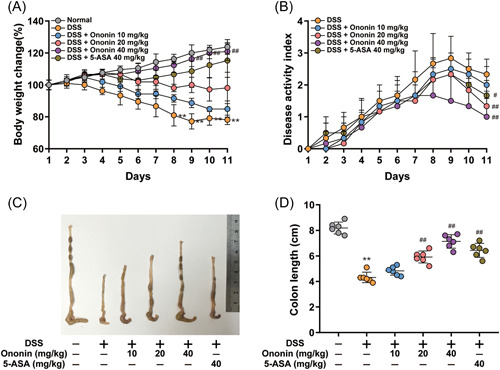
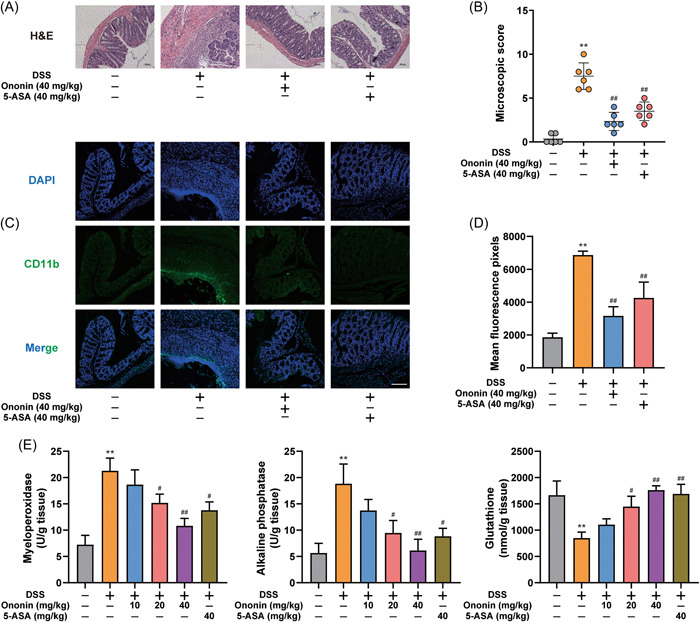
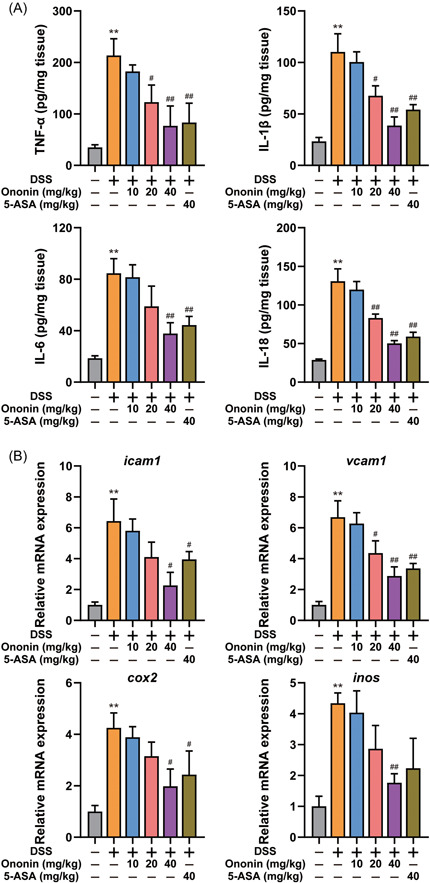
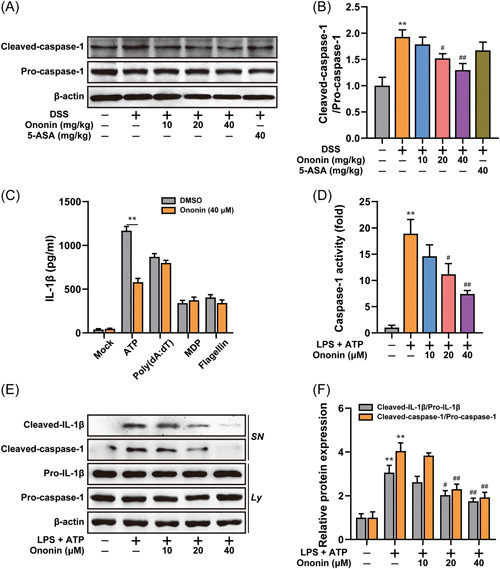
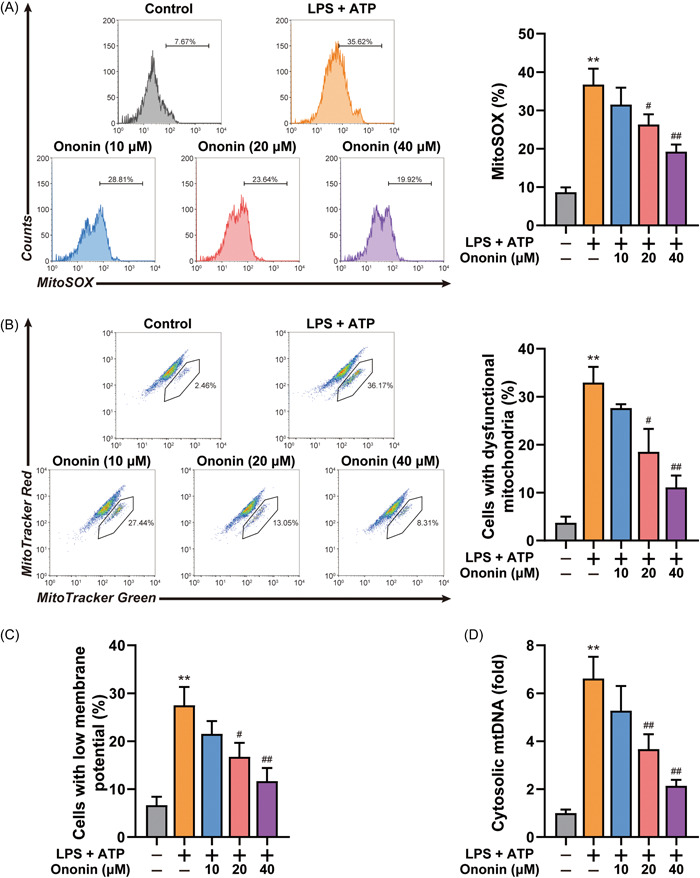
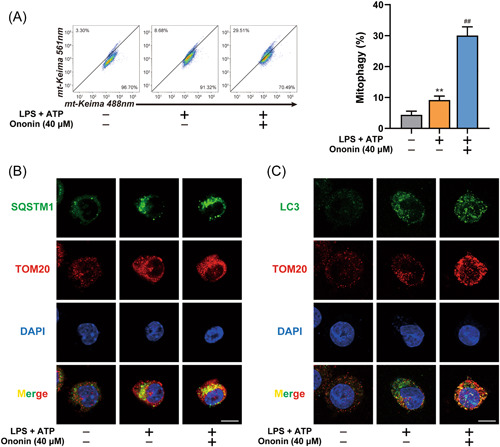
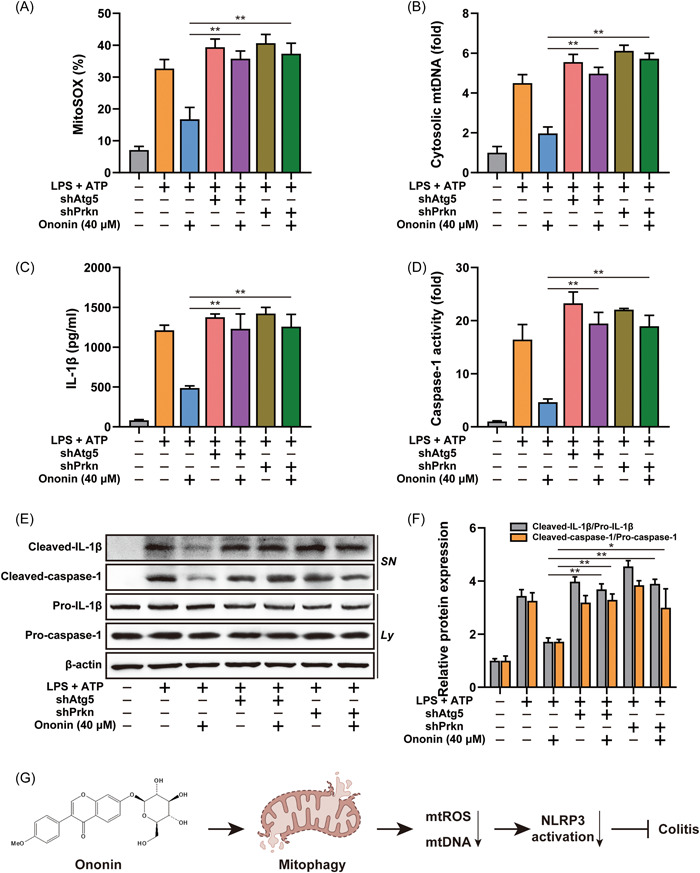
Results: Ononin significantly alleviated weight loss and colon shortening in mice with colitis (p < .01). Moreover, Ononin decreased the production of inflammatory cytokines and mediators associated with colitis (p < .05). In addition, Ononin inhibited macrophages infiltration and reduced caspase-1 activation in colitis mice. Caspase-1 activation is closely related to the NLRP3 inflammasome. Therefore, we investigated the effect of Ononin on NLRP3 inflammasome in vitro. The relevant results confirmed that Ononin inhibited NLRP3 inflammasome activation and inhibited mitochondrial damage (p < .05). Further studies revealed that Ononin inhibited mitochondrial damage through triggering mitophagy (p < .05).

Conclusion: Ononin alleviates DSS-induced colitis by activating mitophagy to inhibit NLRP3 inflammasome.

Keywords: NLRP3 inflammasome; Ononin; colitis; mitochondrial damage; mitophagy.


Conflict of interest statement

The authors declare no conflict of interest.

Figures

Figure 1
Figure 1
Ononin attenuated DSS‐induced experimental colitis. (A) Body weight changes of each group in DSS‐induced colitis mice. (B) Disease activity index of each group was calculated. (C) The macroscopic appearances and (D) length of colons from each group of mice were measured. Data are presented as mean ± SD. **p < .01 compared with normal group; # p < .05, ## p < .01 compared with DSS group. DSS, dextran sulfate sodium.
Figure 2
Figure 2
Ononin reduced colon damage in DSS‐induced colitis mice. (A) Serial sections of colon tissues were stained with H&E. (B) Colon histological damage score of each group was determined. (C) Sections of colon tissues were immunostained with DAPI (blue) and anti‐CD11b‐FITC (green) and observed by confocal laser‐scanning microscope. Representative images are shown. Scale bars = 100 µm. (D) Fluorescence intensity of each group was determined. (E) MPO, ALP, and GSH activity in colon samples were determined. Data are presented as mean ± SD. **p < .01 compared with normal group; # p < .05, ## p < .01 compared with DSS group. DAPI, diamidino‐phenyl‐indole; DSS, dextran sulfate sodium; H&E, hematoxylin and eosin.
Figure 3
Figure 3
Ononin suppressed proinflammatory cytokine production and reduced the expression of inflammation‐related proteins in colons from mice treated with DSS. (A) The expression levels of cytokines such as TNF‐α, IL‐1β, IL‐6, and IL‐18, in tissue homogenates were detected by ELISA kits. (B) The mRNA expression levels of ICAM1, VCAM1, COX2, and iNOS were determined by quantitative real‐time PCR. Data are presented as mean ± SD. **p < .01 compared with normal group; # p < .05, ## p < .01 compared with DSS group. COX2, cycloxygenase‐2; DSS, dextran sulfate sodium; ICAM1, intercellular adhesion molecule‐1; iNOS, inducible nitric oxide synthase; mRNA, messenger RNA; PCR, polymerase chain reaction; VCAM1, vascular cell adhesion molecule‐1.
Figure 4
Figure 4
Ononin inhibited activation of NLRP3 inflammasome. (A) Colon tissue protein levels of pro‐caspase‐1 and cleaved‐caspase‐1 were examined by western blot. (B) The quantification of cleaved‐caspase‐1/pro‐caspase‐1 was determined. (C) ELISA of IL‐1β in supernatants of LPS‐primed differentiated THP‐1 cells treated with 40 μM of Ononin, followed by incubation with ATP (5 mM) for 1 h, MDP (200 ng/ml) or flagellin (200 ng/ml) for 6 h, or transfection of poly(dA:dT). (D) The caspase‐1 activity was measured in LPS‐primed differentiated THP‐1 cells treated with Ononin, followed by incubation with ATP (5 mM) for 1 h. (E) Immunoblot analysis of IL‐1β in supernatants (SN) and caspase‐1 in lysate (Ly) of LPS‐primed differentiated THP‐1 cells treated with Ononin, followed by incubation with ATP (5 mM) for 1 h. (F) The quantification of cleaved‐caspase‐1/pro‐caspase‐1 and cleaved‐IL‐1β/pro‐IL‐1β were determined. Data are presented as mean ± SD (n = 3). **p < .01 compared with control group; # p < .05, ## p < .01 compared with DSS group or LPS plus ATP group. ATP, adenosine triphosphate; DMSO, dimethylsulfoxide; DSS, dextran sulfate sodium; LPS, lipopolysaccharide; MDP, muramyl dipeptide.
Figure 5
Figure 5
Ononin reduced accumulation of damaged mitochondria. (A) Flow cytometry analysis (left) and quantification (right) of mitochondrial ROS by MitoSOX staining in LPS‐primed differentiated THP‐1 cells treated with Ononin, followed by stimulation with ATP (5 mM) for 1 h. (B) Flow cytometry analysis (left) and quantification (right) of mitochondrial status in LPS‐primed differentiated THP‐1 cells treated as above. Gates represent cells with damaged mitochondria. *p < .05, **p < .01. (C) Flow cytometry analysis of mitochondrial membrane potential by JC‐1 staining in LPS‐primed differentiated THP‐1 cells treated as above. **p < .01. (D) Quantitative real‐time PCR analysis of mtDNA released from LPS‐primed differentiated THP‐1 cells treated as above. Data are presented as mean ± SD (n = 3). **p < .01 compared with control group; # p < .05, ## p < .01 compared with LPS plus ATP group. ATP, adenosine triphosphate; LPS, lipopolysaccharide; mtDNA, mitochondrial DNA; PCR, polymerase chain reaction.
Figure 6
Figure 6
Ononin triggered mitophagy to clear damaged mitochondria. (A) FACS analysis (left) and quantification (right) of LPS‐primed THP‐1 cells expressing mito‐Keima treated with 40 μM of Ononin, followed by stimulation with ATP (5 mM) for 1 h. (B, C) Intracellular distribution of SQSTM1 (B) or LC3 (C) and mitochondria (TOM20) in LPS‐primed THP‐1 cells treated with 40 μM of Ononin, followed by stimulation with ATP (5 mM) for 1 h, examined by confocal microscopy. Scale bars = 10 µm. Data are presented as mean ± SD (n = 3). **p < .01 compared with control group; ## p < .01 compared with LPS plus ATP group. ATP, adenosine triphosphate; LPS, lipopolysaccharide.
Figure 7
Figure 7
Mitophagy is involved in the inhibition of NLRP3 inflammasome mediated by Ononin. (A) Quantification of MitoSOX staining in LPS‐primed THP‐1 cells stably expressing Atg5 or Prkn shRNA, which was treated with 40 μM of Ononin, followed by stimulation with ATP (5 mM) for 1 h. (B) Quantitative real‐time PCR analysis of mtDNA released from LPS‐primed differentiated THP‐1 cells stably expressing Atg5 or Prkn shRNA treated as above. (C) ELISA of IL‐1β in supernatants of LPS‐primed differentiated THP‐1 cells stably expressing Atg5 or Prkn shRNA treated as above. (D) The caspase‐1 activity was measured in LPS‐primed differentiated THP‐1 cells stably expressing Atg5 or Prkn shRNA treated as above. (E) Immunoblot analysis of IL‐1β in supernatants (SN) and caspase‐1 in lysate (Ly) of LPS‐primed differentiated THP‐1 cells stably expressing Atg5 or Prkn shRNA treated as above. (F) The quantification of cleaved‐caspase‐1/pro‐caspase‐1 and cleaved‐IL‐1β/pro‐IL‐1β were determined. (G) The flowchart to show the whole experimental design. Data are presented as mean ± SD (n = 3). *p < .05, **p < .01. ATP, adenosine triphosphate; LPS, lipopolysaccharide; mtDNA, mitochondrial DNA; mtROS, mitochondrial reactive oxygen species; PCR, polymerase chain reaction; shRNA, short hairpin RNA.

References

    1. Bambo GM, Shiferaw E, Melku M. A mean platelet volume in inflammatory bowel disease: a systematic review and meta‐analysis. PLoS One. 2022;17(8):e0273417. 10.1371/journal.pone.0273417 - DOI - PMC - PubMed
    1. Bernard R, Hammami MB, Arnold FW, et al. Clostridioides difficile toxin is infrequently detected in inflammatory bowel disease and does not associate with clinical outcomes. Gut Pathog. 2022;14(1):36. 10.1186/s13099-022-00511-2 - DOI - PMC - PubMed
    1. Bourgonje AR, Wichers SJ, Hu S, et al. Proteomic analyses do not reveal subclinical inflammation in fatigued patients with clinically quiescent inflammatory bowel disease. Sci Rep. 2022;12(1):14581. 10.1038/s41598-022-17504-5 - DOI - PMC - PubMed
    1. Dai C, Jiang M, Huang Y. Suboptimal bowel preparation in patients with inflammatory bowel disease undergoing colonoscopy. Dig Dis Sci. 2022;67:5353‐5354. 10.1007/s10620-022-07648-9 - DOI - PubMed
    1. Jacobsen GE, Fernández I, Quintero MA, et al. Lamina propria phagocyte profiling reveals targetable signaling pathways in refractory inflammatory bowel disease. Gastro Hep Adv. 2022;1(3):380‐392. 10.1016/j.gastha.2022.01.005 - DOI - PMC - PubMed

Publication types