

Growth-defence trade-off in rice: fast-growing and acquisitive genotypes have lower expression of genes involved in immunity
- PMID: 36840921
- PMCID: PMC10199124
- DOI: 10.1093/jxb/erad071
Growth-defence trade-off in rice: fast-growing and acquisitive genotypes have lower expression of genes involved in immunity
Erratum in
-
Correction to: Growth-defence trade-off in rice: fast-growing and acquisitive genotypes have lower expression of genes involved in immunity.J Exp Bot. 2024 Jul 10;75(13):4165. doi: 10.1093/jxb/erae268. J Exp Bot. 2024. PMID: 38865363 Free PMC article. No abstract available.
Abstract
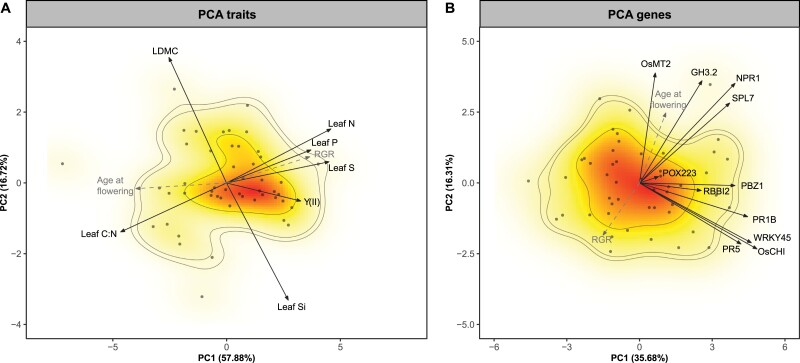
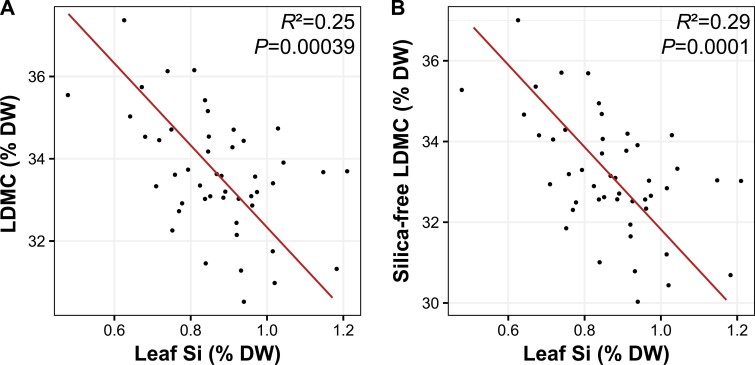
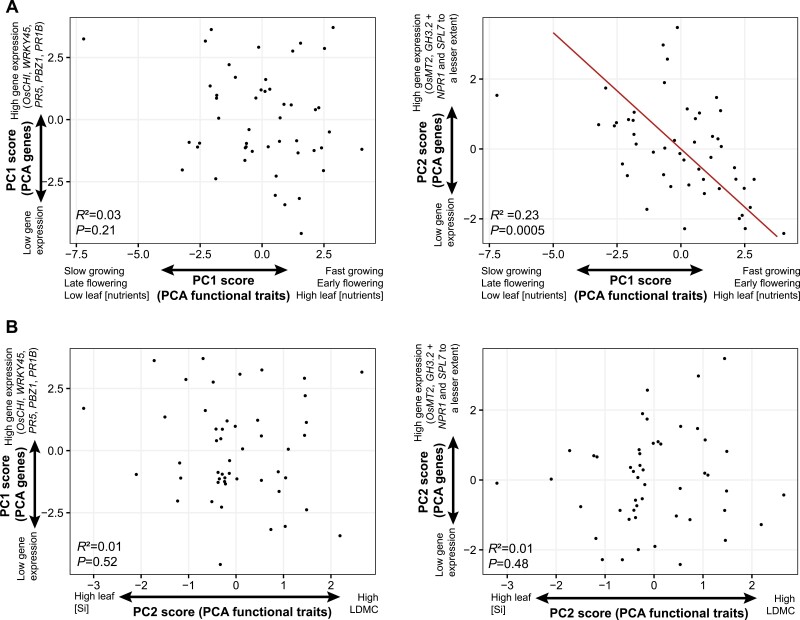
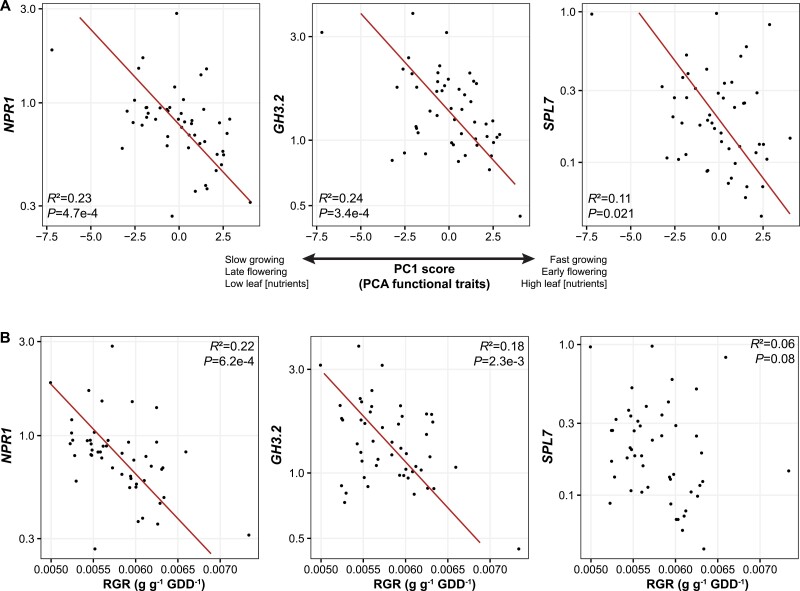
Plant ecologists and molecular biologists have long considered the hypothesis of a trade-off between plant growth and defence separately. In particular, how genes thought to control the growth-defence trade-off at the molecular level relate to trait-based frameworks in functional ecology, such as the slow-fast plant economics spectrum, is unknown. We grew 49 phenotypically diverse rice genotypes in pots under optimal conditions and measured growth-related functional traits and the constitutive expression of 11 genes involved in plant defence. We also quantified the concentration of silicon (Si) in leaves to estimate silica-based defences. Rice genotypes were aligned along a slow-fast continuum, with slow-growing, late-flowering genotypes versus fast-growing, early-flowering genotypes. Leaf dry matter content and leaf Si concentrations were not aligned with this axis and negatively correlated with each other. Live-fast genotypes exhibited greater expression of OsNPR1, a regulator of the salicylic acid pathway that promotes plant defence while suppressing plant growth. These genotypes also exhibited greater expression of SPL7 and GH3.2, which are also involved in both stress resistance and growth. Our results do not support the hypothesis of a growth-defence trade-off when leaf Si and leaf dry matter content are considered, but they do when hormonal pathway genes are considered. We demonstrate the benefits of combining ecological and molecular approaches to elucidate the growth-defence trade-off, opening new avenues for plant breeding and crop science.
Keywords: Defence gene; growth–defence trade-off; intraspecific variation; plant defence; plant economics spectrum; plant functional trait; plant immunity; rice (Oryza sativa); silica; silicon.
© The Author(s) 2023. Published by Oxford University Press on behalf of the Society for Experimental Biology.
Conflict of interest statement
All authors declare that they have no conflicts of interest.
Figures
References
-
- Agrawal AA. 2007. Macroevolution of plant defense strategies. Trends in Ecology and Evolution 22, 103–109. - PubMed
-
- Agrawal AA, Fishbein M.. 2006. Plant defense syndromes. Ecology 87, 132–149. - PubMed
-
- Ahammed GJ, Yang Y.. 2021. Mechanisms of silicon-induced fungal disease resistance in plants. Plant Physiology and Biochemistry 165, 200–206. - PubMed
-
- Albert CH, Grassein F, Schurr FM, Vieilledent G, Violle C.. 2011. When and how should intraspecific variability be considered in trait-based plant ecology? Perspectives in Plant Ecology, Evolution and Systematics 13, 217–225.
Publication types
MeSH terms
LinkOut - more resources
Full Text Sources
