. 2023 May 3;111(9):1440-1452.e5.
doi: 10.1016/j.neuron.2023.02.003. Epub 2023 Feb 24.

Hidden behavioral fingerprints in epilepsy

Affiliations

Hidden behavioral fingerprints in epilepsy

Tilo Gschwind et al. Neuron. .

Abstract

Epilepsy is a major disorder affecting millions of people. Although modern electrophysiological and imaging approaches provide high-resolution access to the multi-scale brain circuit malfunctions in epilepsy, our understanding of how behavior changes with epilepsy has remained rudimentary. As a result, screening for new therapies for children and adults with devastating epilepsies still relies on the inherently subjective, semi-quantitative assessment of a handful of pre-selected behavioral signs of epilepsy in animal models. Here, we use machine learning-assisted 3D video analysis to reveal hidden behavioral phenotypes in mice with acquired and genetic epilepsies and track their alterations during post-insult epileptogenesis and in response to anti-epileptic drugs. These results show the persistent reconfiguration of behavioral fingerprints in epilepsy and indicate that they can be employed for rapid, automated anti-epileptic drug testing at scale.

Keywords: 3D video; behavior; biomarkers; drug screening; epilepsy; machine learning; phenotyping.


Conflict of interest statement

Declaration of interests The authors declare no competing interests.

Figures

Figure 1.
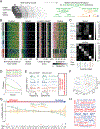
Figure 1.. Hidden behavioral phenotypes in mouse models of acquired and genetic epilepsies during inter-ictal periods.
(A) Experimental paradigm for artificial intelligence (AI)-guided behavioral phenotyping in epilepsy during inter-ictal periods. Mouse 3D pose dynamics (illustrated by point clouds) in an open field assay are captured with a depth camera and analyzed with MoSeq. Behavioral syllables identified by MoSeq reveal hidden behavioral phenotypes in two distinct well-established mouse models of epilepsy, distinguishing sham mice from animals injected with intrahippocampal kainic acid (IHKA), a model of temporal lobe epilepsy, and identifying a previously unreported sex-specific phenotype in Scn1b mice, a model linked to Dravet Syndrome. Note that syllable IDs are unique for each experiment and do not correspond to the same syllables across B, D, E. (B) Syllable usage in mice (top), obtained four weeks after intrahippocampal injection with either saline (CON; n=18) or kainic acid (IHKA; n=20), are ordered by differential usage (arrow) with the most IHKA-upregulated (“Up”) syllables on the left and IHKA-downregulated (“Down”) syllables on the right. A wordcloud (bottom) with syllable names color-coded (up and downregulated in IHKA, red and blue respectively) and sized by the relative difference in syllable usage. In a model of chronic acquired epilepsy, IHKA mice exhibit a distinct behavioral repertoire compared to CON mice, with selective up- and downregulation of syllables such as “dart” (ID 20) and “scrunch” (ID 12), respectively. Asterisks indicate significant change in syllable usage (Kruskal–Wallis and post hoc Dunn’s two-sided test with permutation with Benjamini–Hochberg false discovery rate of α = 0.05). Error bars indicate 95% bootstrap confidence intervals. See also Figure S1 and Video S1. (C) Normalized classification matrices (across rows and columns) showing the performance of a linear classifier in discriminating between epileptic (IHKA) and non-epileptic animals (CON). Left: “Machine”. Classifiers were trained using one of the following behavioral measures: position, speed, combined 2D measures (“scalars”) or MoSeq syllables. Right: “Human”. The classification matrix summarizes the performance of four experimenters tasked to distinguish epileptic and non-epileptic animals (see Results for details). The colorbar is shared between left (“Machine”) and right (“Human”). An ideal classifier performance corresponds to a diagonal white with otherwise black fields (classification rate of 1). (D) Same as in (B) but comparing female Scn1b+/− mice (n=10) and Scn1b+/+ littermates (n=20). In a genetic model of developmental and epileptic encephalopathy, Scn1b+/− mice exhibit a distinct behavioral repertoire compared to Scn1b+/+ littermates, with selective up- and downregulation of syllables such as “head up” and “dart”, respectively. Kruskal–Wallis and post hoc Dunn’s two-sided test with permutation were used, with Benjamini–Hochberg false discovery rate with α = 0.05. Error bars indicate 95% bootstrap confidence intervals. (E) Same as in (D) but comparing male Scn1b+/− mice (n=14) and Scn1b+/+ littermates (n=14). Unlike female Scn1b mice (D), male Scn1b mice do not exhibit a distinct behavioral repertoire compared to control male littermates. Kruskal–Wallis and post hoc Dunn’s two-sided test with permutation were used, with Benjamini–Hochberg false discovery rate with α = 0.05. Error bars indicate 95% bootstrap confidence intervals.
Figure 2.
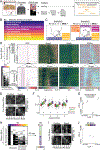
Figure 2.. Distinct behavioral phenotypes during epileptogenesis in a mouse model of temporal lobe epilepsy
(A) Sketch illustrating the experimental paradigm to use AI-guided behavioral phenotyping to monitor the pathogenesis in animal models of epilepsies. Here, a 60-min 3D video was recorded every week after induction of status epilepticus in the IHKA model of temporal lobe epilepsy over the period of a month, revealing distinct phenotypes in the first and later weeks. (B) Dendrogram of syllables indicating the MoSeq distance between syllables (top), and heatmap of syllable usage (bottom) in mice recorded 1 to 4 weeks after intrahippocampal injection with either saline (CON; n=10) or kainic acid (IHKA; n=10). (C) Normalized classification matrices (across rows and columns) summarizing the performance of a linear classifier in distinguishing experimental conditions (CON or IHKA) and timepoints (1 to 4 weeks) based on different behavioral measures (position, speed, combined scalar measures or MoSeq syllables). An ideal classifier performance corresponds to a diagonal white with otherwise black fields (classification rate of 1). (D) Normalized F statistic highlighting the relevance of each indicated syllable for discriminating timepoints after IHK from CON (“behavioral fingerprint”; see Methods for details). (E) F1 scores for linear classifiers distinguishing experimental conditions (CON or IHKA) and timepoints (1 to 4 weeks) based on different behavioral measures. Box plots represent the distribution across all cross-validation folds, with whiskers representing 1.5-times the inter-quartile range (P < 0.01, asterisks indicate significant differences between MoSeq and scalars, paired two-sided t-test corrected with Holm–Bonferroni step-down procedure). (F) Linear discrimination analysis (LDA) plot indicating the similarity of mean behavioral summaries of mice within conditions (CON or IHK) and within timepoints (1 to 4 weeks). Dashed lines highlight the separation between conditions (CON vs. IHK) and clusters of timepoints after IHKA (IHKA week 1 vs. IHKA weeks 2–4) along LDA-1- and LDA-2-axis, respectively. (G) Wordcloud with syllable names color-coded (up- and downregulated in IHKA, red and blue respectively) and sized by the normalized F statistics in one-vs-CON comparison (see Figure 2D). IHKA mice exhibit a distinct behavioral repertoire compared to CON mice during week 1 and for example week 3 (representative of later weeks 2 to 4), with selective upregulation of syllables such as “scrunch long” and “dart”, respectively. Asterisks indicate significant syllables (Holm-Bonferroni-corrected P < 0.01 from the two-sided F-test).
Figure 3.
Figure 3.. Hidden behavioral phenotypes in epilepsy for anti-epileptic drug screening at scale.
(A) Schematic illustrating the pipeline for anti-epileptic drug (AED) screening at scale. Multiple open field assays can be run in parallel (e.g., 4 setups in the current study). Deploying this pipeline identified unique behavioral phenotypes for different drug-dose pairs, including levetiracetam (LEV), phenytoin (PHT) and valproic acid (VAL) in wildtype mice, while revealing on- and off-target effects of LEV in the IHKA mouse model of TLE. See also Figure S2 and Table S1. (B) Behavioral summary for different AEDs. Wildtype mice were injected with either high or low dose of levetiracetam (LEV-H or LEV-L; n=12 each), phenytoin (PHT-H or PHT-L; n=12 each) and valproic acid (VAL-H or VAL-L; n=12 each) or control solution (CON; n=24; see Methods for details). From left to right, the position (normalized by the arena center position), velocity, length, and height, as well as MoSeq-identified syllable usages were computed for each mouse (rows). (C) Normalized classification matrices (across rows and columns) representing the performance of a linear classifier (i.e., means of all cross-validation folds) for discriminating different drug-dose pairs based on speed (top) or MoSeq-identified syllable usage (bottom). Both classifiers – trained on either MoSeq or speed (the best performing scalar measure; see Results) - showed high performance for high dose valproic acid (VAL-H), which is known to induce an overt behavioral phenotype. However, MoSeq-based classification outperformed those of scalar measures otherwise (see Results for details). (D) Mean precision-recall curves and F1 values (including standard error) for different behavioral measures across all drug treatments. The corresponding area under the curve (AUC) is 0.16 (Position), 0.39 (Speed), 0.35 (Scalars) and 0.76 (MoSeq). (E) Normalized F statistic (“behavioral fingerprints”; see Methods for details) highlighting the relevance of each indicated syllable for distinguishing a given drug-dose pair either from the control treatment (One vs CON) or all other treatments (One vs rest). The number of significant syllables is indicated in parentheses (Holm-Bonferroni-corrected P<0.01 from the two-sided F-test). As an example, the text bubble names the three significantly upregulated syllables for LEV-H in the one-vs-rest comparison that distinguish LEV-H from all other drugs. (F) LDA plot indicating the similarity between the mean behavioral summaries of mice across drug-dose pairs. (G) Difference in syllable usage between non-epileptic (CON) and chronically epileptic (IHKA) mice, which were intraperitoneally injected with either saline or high dose levetiracetam (LEV-H; see Methods for details). Values are normalized to the difference between CONSaline and IHKASaline, which are aligned at zero (orange-shaded rectangles indicate the error bars). The syllables are ordered by change in usage (arrow), where syllables usages in IHKALEV-H that diverge even more from controls (“off-target” effect) are on the left and those which get closer to those of CON (“on-target” effect) are on the right. Kruskal–Wallis and post hoc Dunn’s two-sided test with permutation were used, with Benjamini–Hochberg false discovery rate with α = 0.05. Error bars indicate 95% bootstrap confidence intervals. (H) Wordcloud for data in (G), with syllable names color-coded (up and downregulated with red and blue, respectively) and sized by the relative difference in syllable usage. High dose levetiracetam treatment in IHKA mice leads to an upregulation of syllables such as “move forward” (off-target effect) and to a downregulation of syllables related to “dart” (e.g., “short dart left” or “dart right”; on-target effect). Asterisks indicate significant syllables (see (G)).
Figure 4.
Figure 4.. Automated seizure assessment through unsupervised segmentation of behavior
(A) Experimental setup for assessing seizure behavior with AI-guided behavioral phenotyping. In a hippocampal kindling assay, intrahippocampal stimulation was combined with the synchronous acquisition of electroencephalographic (EEG) data and RGB-D data (i.e., red, green, blue color data for manual analysis and depth data for MoSeq analysis). For manual analysis, an experimenter identified all behavior associated with different Racine scores (RS), which for each seizure is commonly reported by selecting only the maximum Racine scores (MRS; see Results for details). Comparing MoSeq to manual analysis revealed that the syllable composition during seizures captures the aggravating nature of repeated kindling across sessions and can be used to identify different groups that share a similar composition of seizure behavior. (B) Behavioral description of different seizure stages adapting a version of the traditional Racine scoring system. (C) Example of two seizures with the same maximum Racine score but a different composition of observed behavior. For each seizure, all seizure-associated behavior was manually summarized in a set of observed Racine score behaviors (“RS set”). In Example A, a human observer summarizes the behavior during a seizure with an RS set (1,7), which denotes behavioral arrest and violent running and jumping (see B), and would commonly only report the MRS value, which is 7. Similarly, in Example B, another animal displaying a combination of behavioral arrest, myoclonic jerks, bilateral forearm clonus, repeated rearing and falling as well as violent running and jumping (i.e., an RS set of (1, 3, 4, 6, 7)) would also be reported as having a MRS of 7. (D) EEG, speed, height and MoSeq-identified syllables during kindling sessions. Top: Each row represents the data of one 5-min recording session (total of 125 sessions in 7 mice; illustrative example shown for session 4 with mice 1 to 7 stacked on top of each other). Sessions are grouped into session blocks 1 to 4 for further analysis (see E-G below). Bottom: A zoomed in 60-second window around the stimulation. On the left is a list of the RS sets for each of the 125 seizures, with observed Racine scores in black and not-observed ones in white. Two example RS sets are written out (same examples as in C). Note: a log scale was chosen for data “speed” due to the increase during seizures to improve the visualization for both ictal and inter-ictal periods. (E) Normalized classification matrices (across rows and columns) representing the performance of a linear classifier for distinguishing different session blocks. Each classifier was trained on different behavioral measures (position, speed, combined scalar measures or MoSeq syllables). An ideal classifier performance corresponds to a diagonal white with otherwise black fields (classification rate of 1). (F) F1 scores for linear classifiers discriminating between session blocks based on different behavioral measures (whiskers represent 1.5-times the inter-quartile range). Asterisks indicate significant differences between MoSeq and scalars (P < 0.01; paired two-sided t-test corrected with Holm–Bonferroni step-down procedure). (G) Linear discrimination analysis (LDA) plot indicating the similarity of mean MoSeq summaries (i.e., syllable usages) of mice within the same session block. (H) Grouping RS sets into RS blocks for classification (see Results). (I) Same as (E), but to distinguish different RS blocks. See also Figure S3. (J) Same as (G), but to distinguish different RS blocks.

Comment in

  • AI-nalyzing Mouse Behavior to Combat Epilepsy.
    Voskobiynyk Y, Paz JT. Voskobiynyk Y, et al. Epilepsy Curr. 2023 Jul 7;23(5):315-317. doi: 10.1177/15357597231185215. eCollection 2023 Sep-Oct. Epilepsy Curr. 2023. PMID: 37901783 Free PMC article. No abstract available.

References

    1. England MJ, Liverman CT, Schultz AM, and Strawbridge LM (2012). Epilepsy across the spectrum: promoting health and understanding. A summary of the Institute of Medicine report. Epilepsy Behav 25, 266–276. 10.1016/j.yebeh.2012.06.016. - DOI - PMC - PubMed
    1. Quigg M, Straume M, Menaker M, and Bertram EH (1998). Temporal distribution of partial seizures: Comparison of an animal model with human partial epilepsy. Ann. Neurol. 43, 748–755. 10.1002/ana.410430609. - DOI - PubMed
    1. Kim HK, Gschwind T, Nguyen TM, Bui AD, Felong S, Ampig K, Suh D, Ciernia AV, Wood MA, and Soltesz I (2020). Optogenetic intervention of seizures improves spatial memory in a mouse model of chronic temporal lobe epilepsy. Epilepsia 61, 561–571. 10.1111/epi.16445. - DOI - PMC - PubMed
    1. Williams PA, White AM, Clark S, Ferraro DJ, Swiercz W, Staley KJ, and Dudek FE (2009). Development of spontaneous recurrent seizures after kainate-induced status epilepticus. J Neurosci 29, 2103–2112. 10.1523/jneurosci.0980-08.2009. - DOI - PMC - PubMed
    1. Racine RJ (1972). Modification of seizure activity by electrical stimulation. II. Motor seizure. Electroencephalogr Clin Neurophysiol 32, 281–294. 10.1016/0013-4694(72)90177-0. - DOI - PubMed

Publication types