. 2023 Mar 7;35(3):487-503.e7.
doi: 10.1016/j.cmet.2023.01.012. Epub 2023 Feb 24.

NRF2 activation induces NADH-reductive stress, providing a metabolic vulnerability in lung cancer

Affiliations

NRF2 activation induces NADH-reductive stress, providing a metabolic vulnerability in lung cancer

Tommy Weiss-Sadan et al. Cell Metab. .

Erratum in

  • NRF2 activation induces NADH-reductive stress, providing a metabolic vulnerability in lung cancer.
    Weiss-Sadan T, Ge M, Hayashi M, Gohar M, Yao CH, de Groot A, Harry S, Carlin A, Fischer H, Shi L, Wei TY, Adelmann CH, Wolf K, Vornbäumen T, Dürr BR, Takahashi M, Richter M, Zhang J, Yang TY, Vijay V, Fisher DE, Hata AN, Haigis MC, Mostoslavsky R, Bardeesy N, Papagiannakopoulos T, Bar-Peled L. Weiss-Sadan T, et al. Cell Metab. 2023 Apr 4;35(4):722. doi: 10.1016/j.cmet.2023.03.011. Cell Metab. 2023. PMID: 37019082 Free PMC article. No abstract available.

Abstract

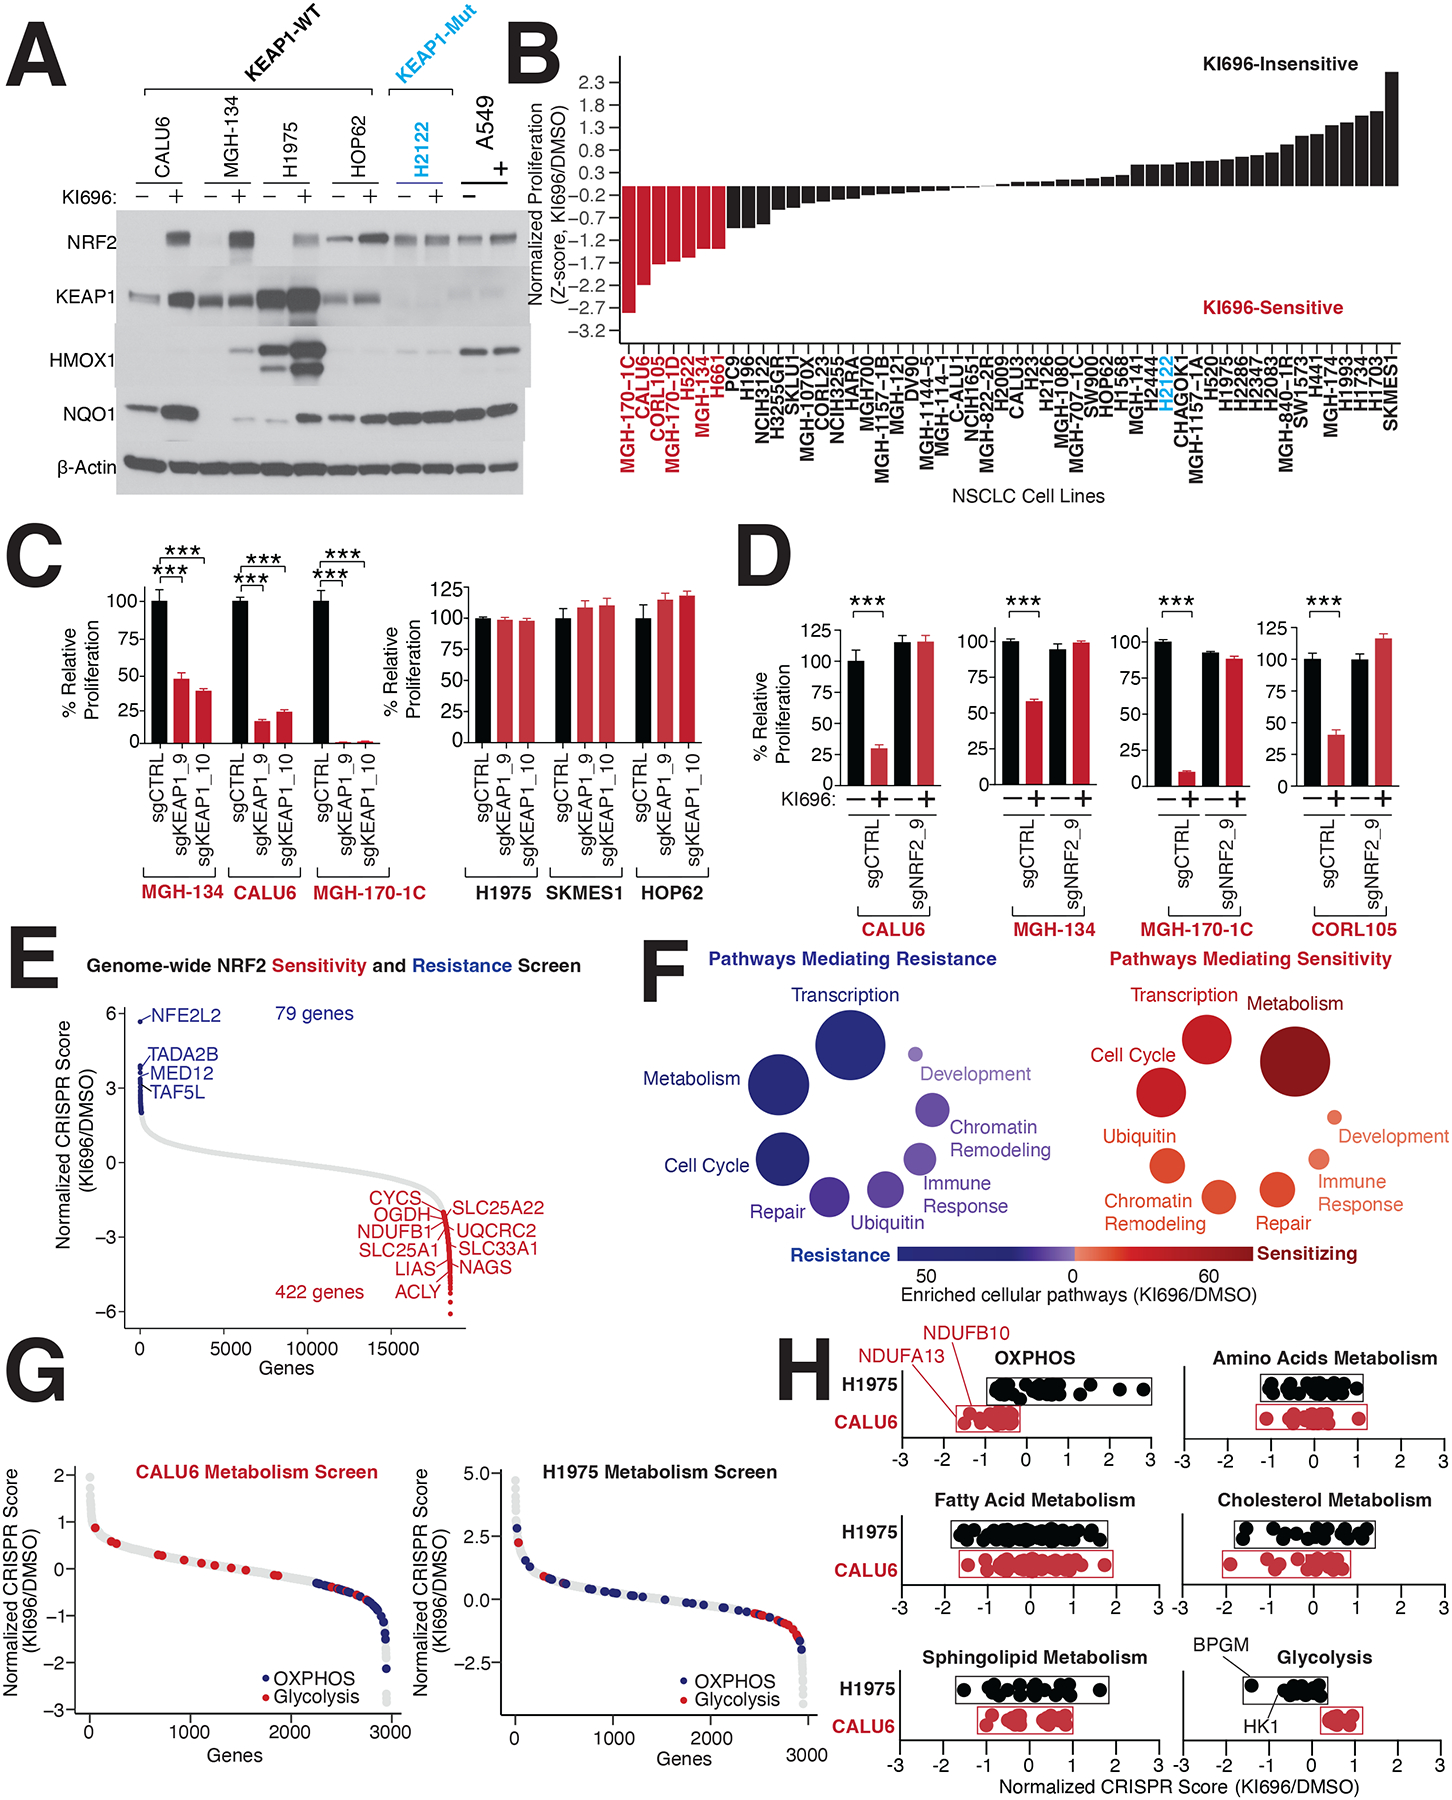
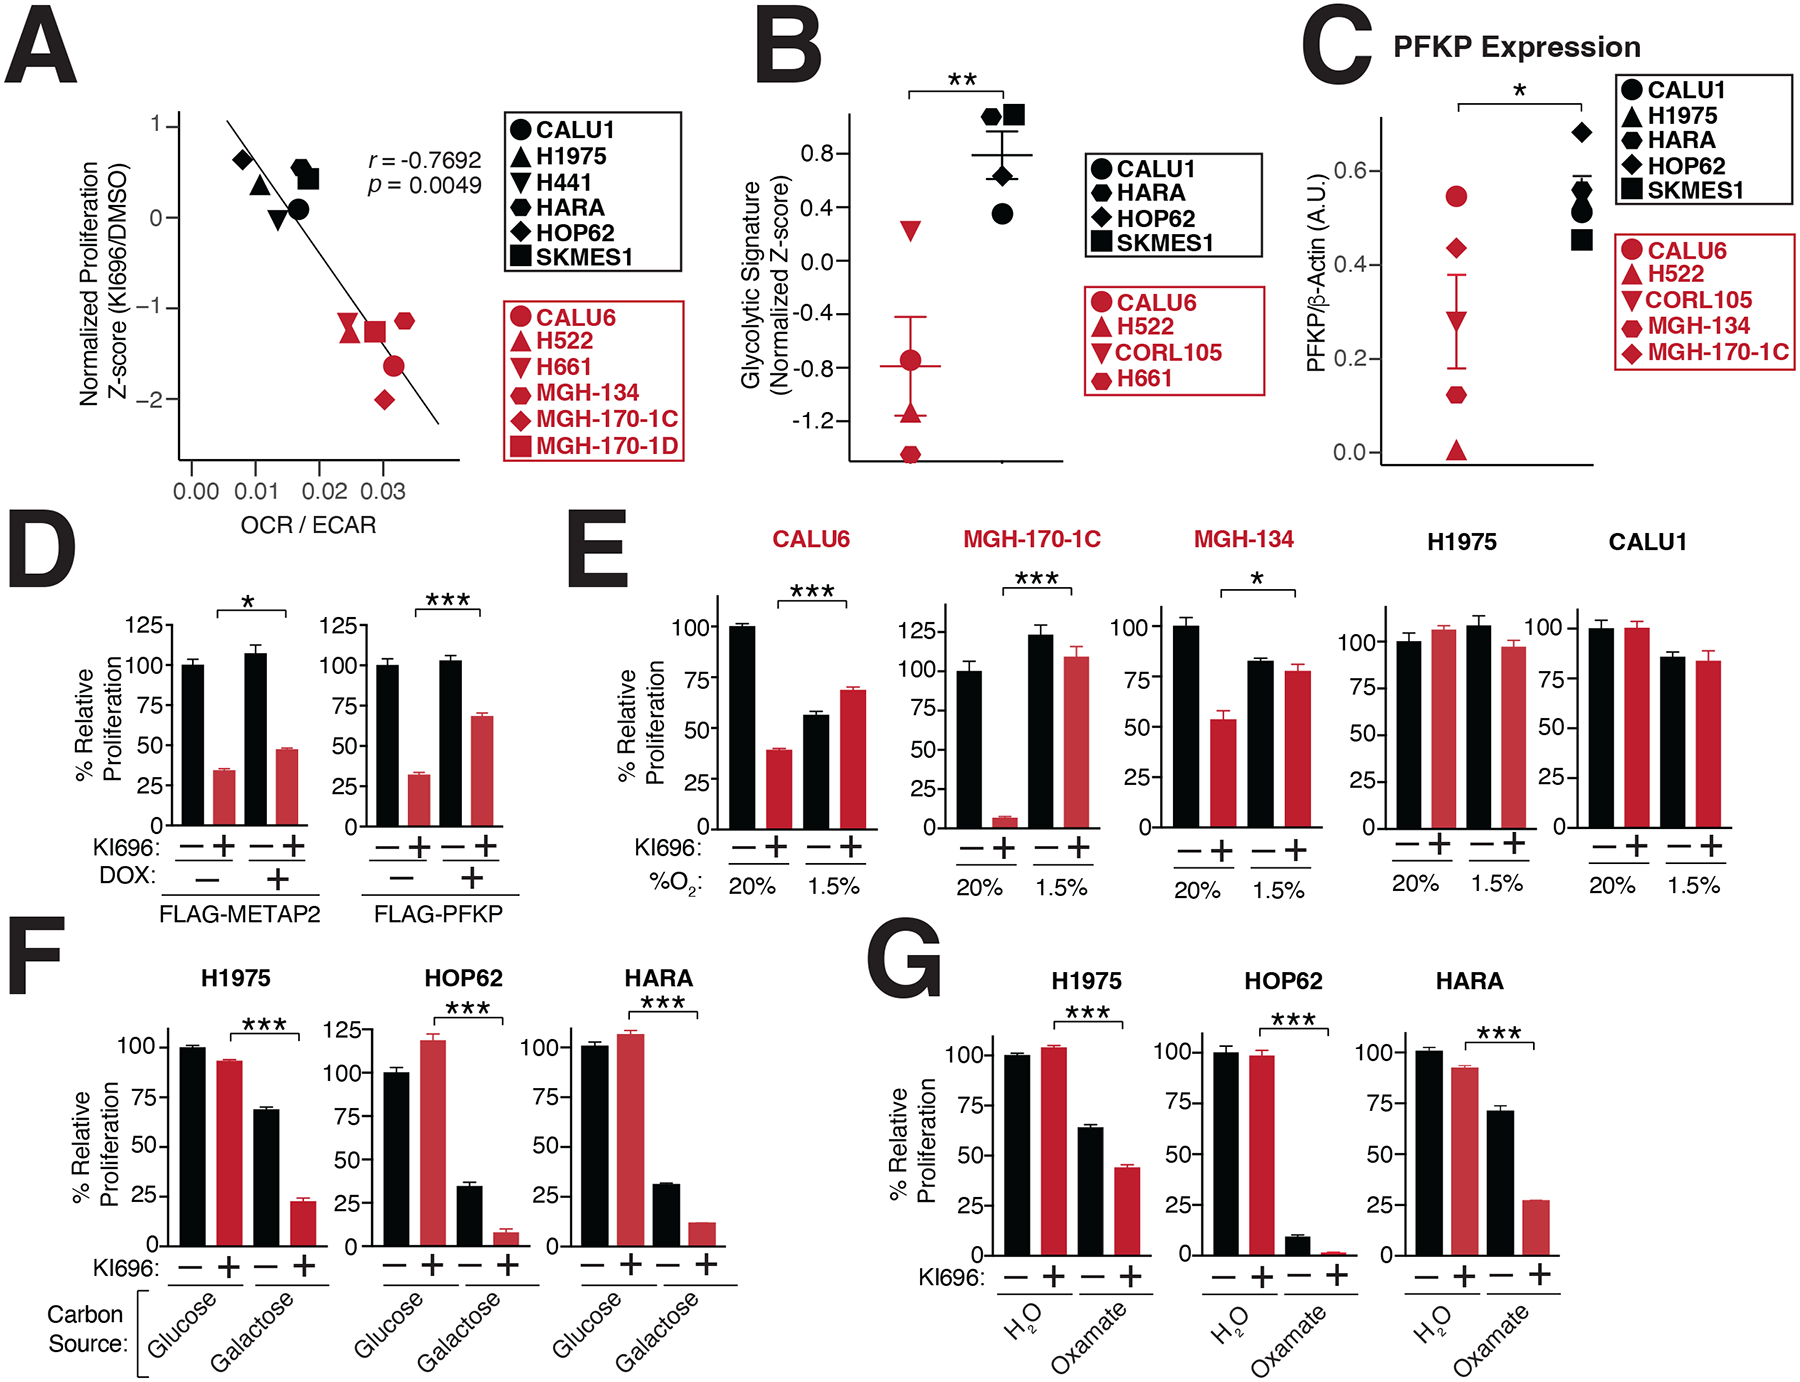
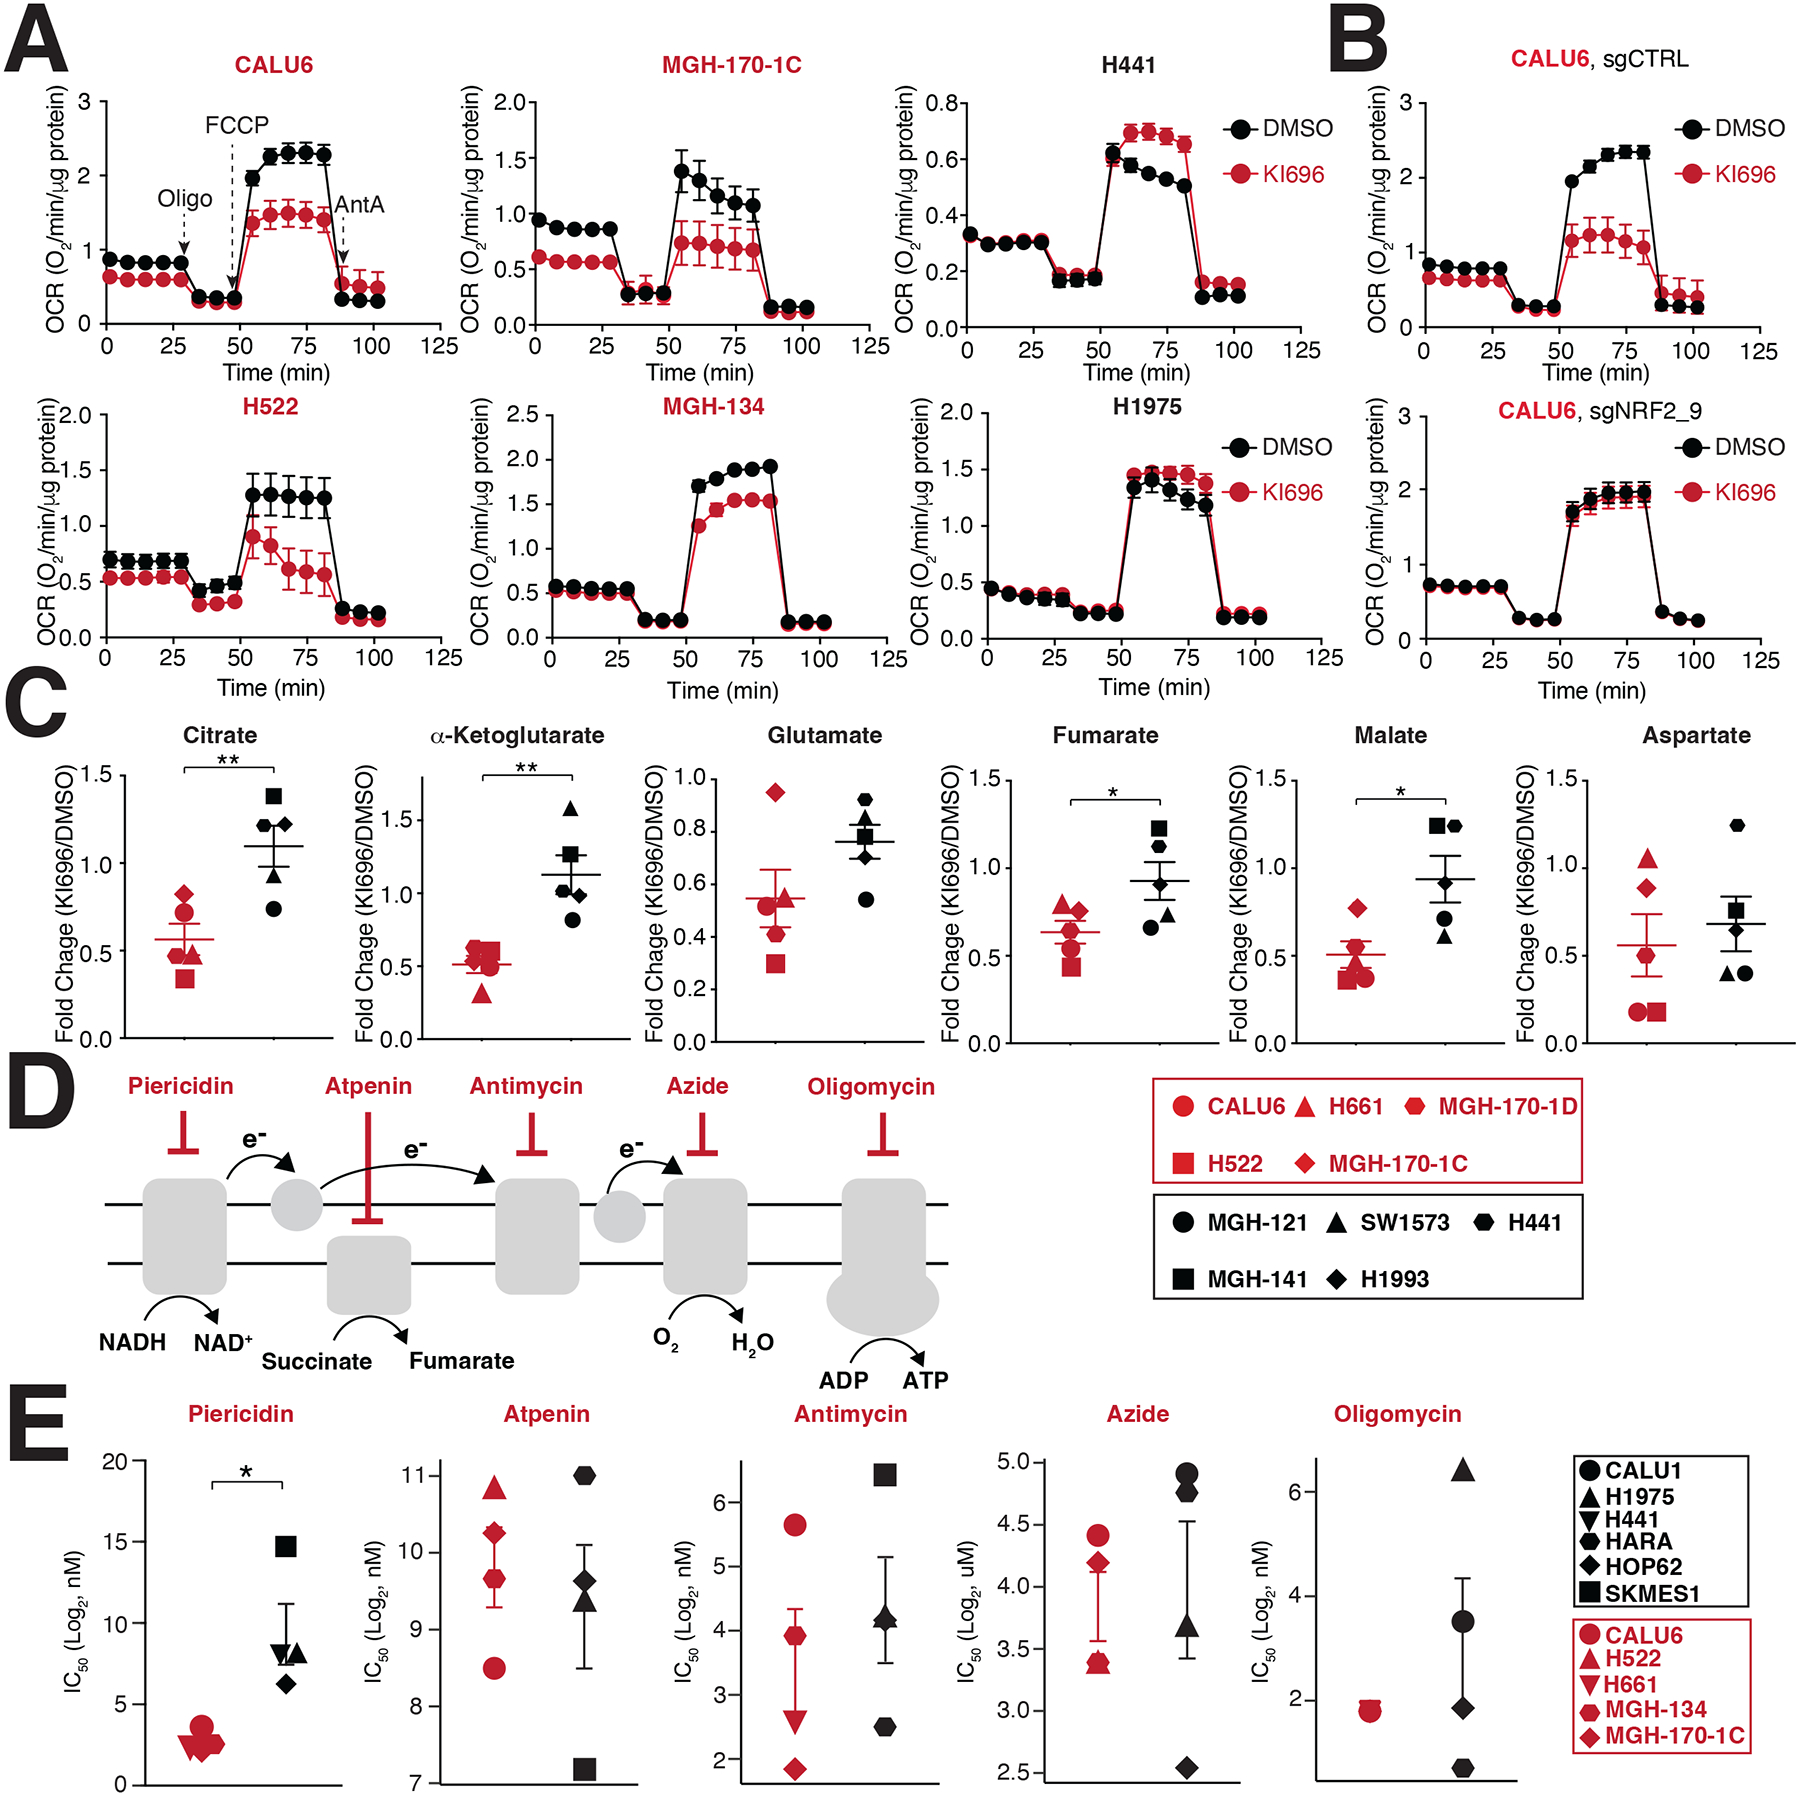
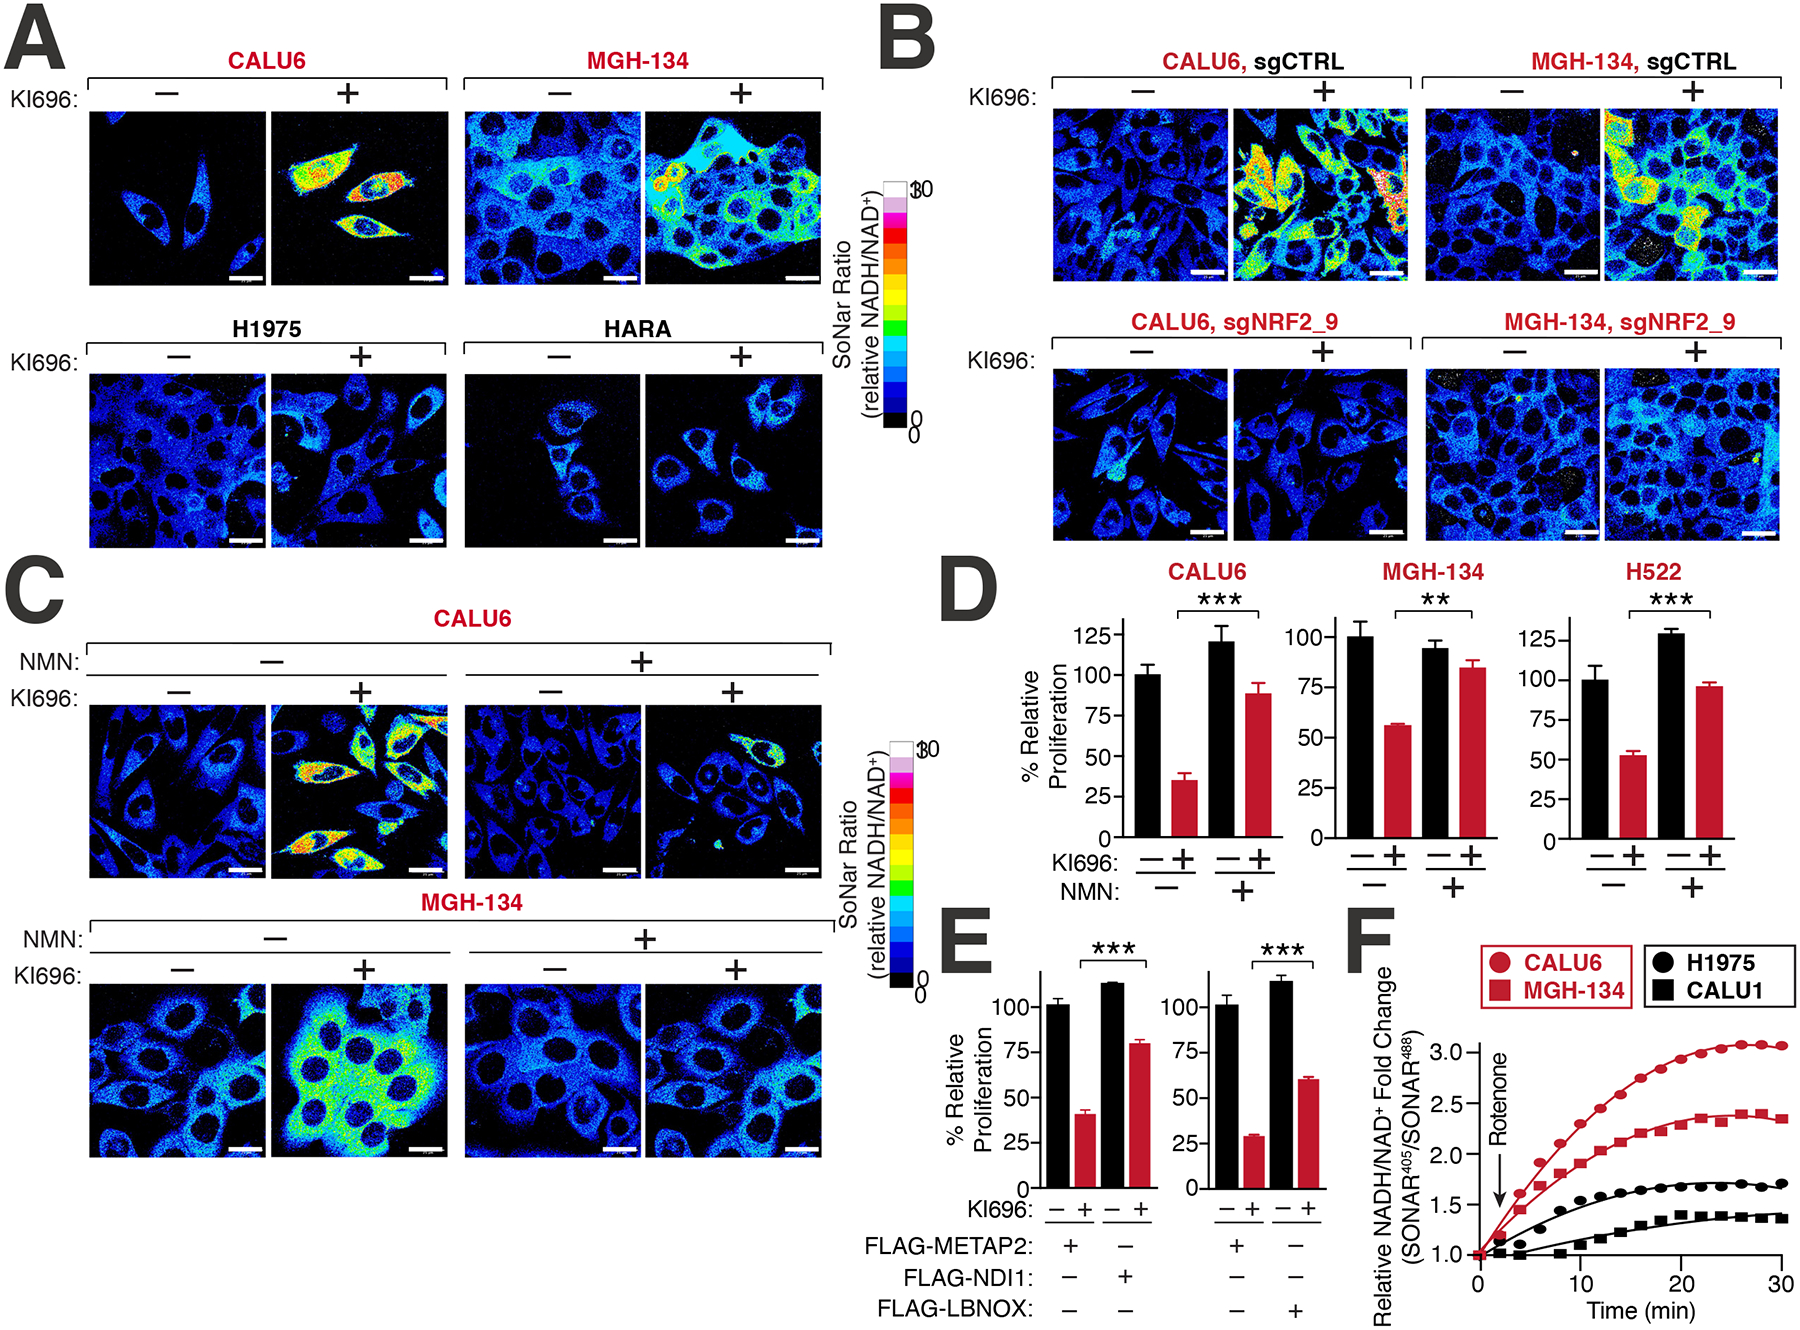
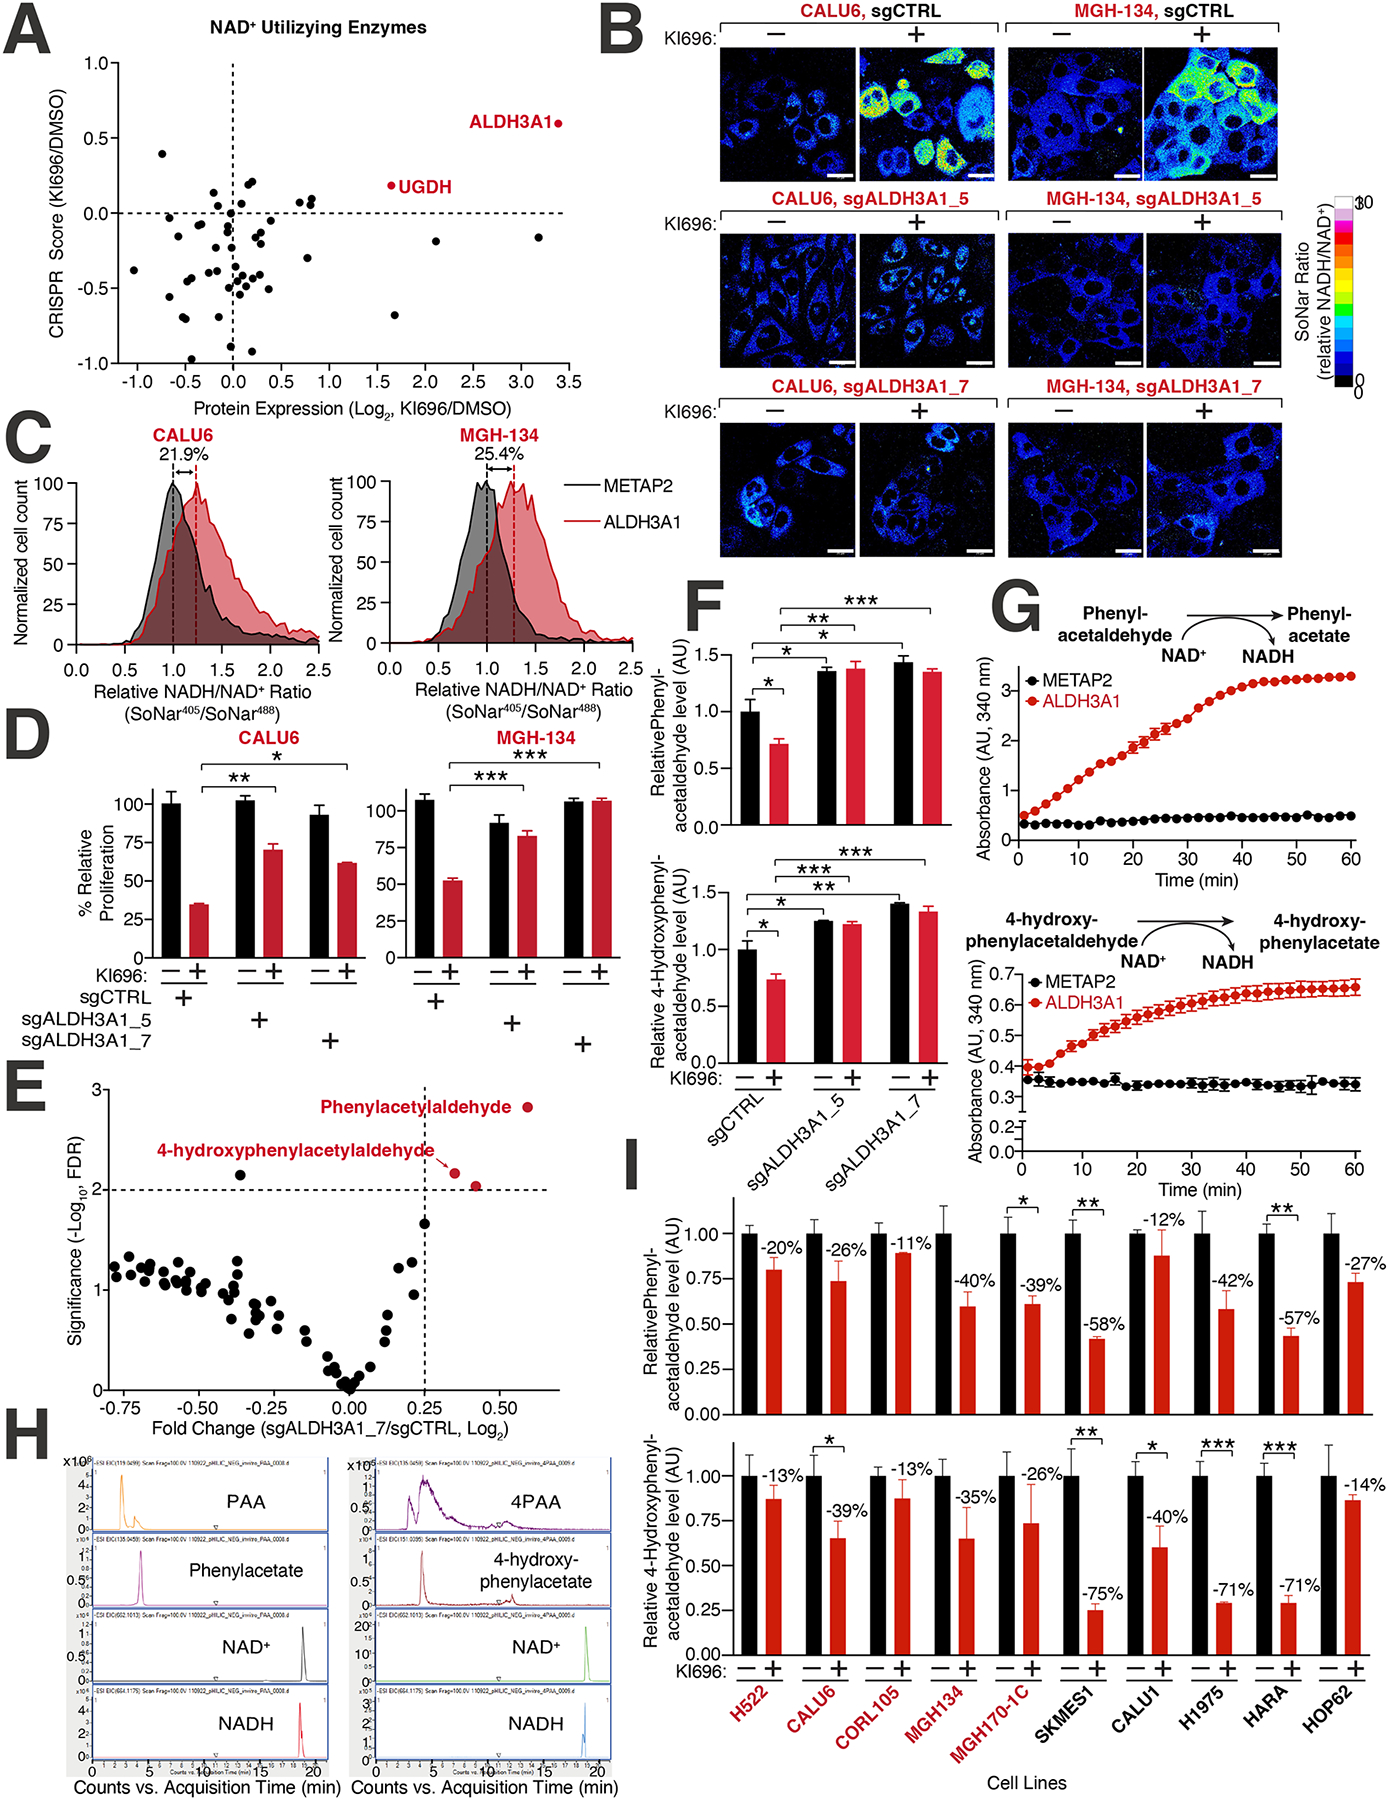
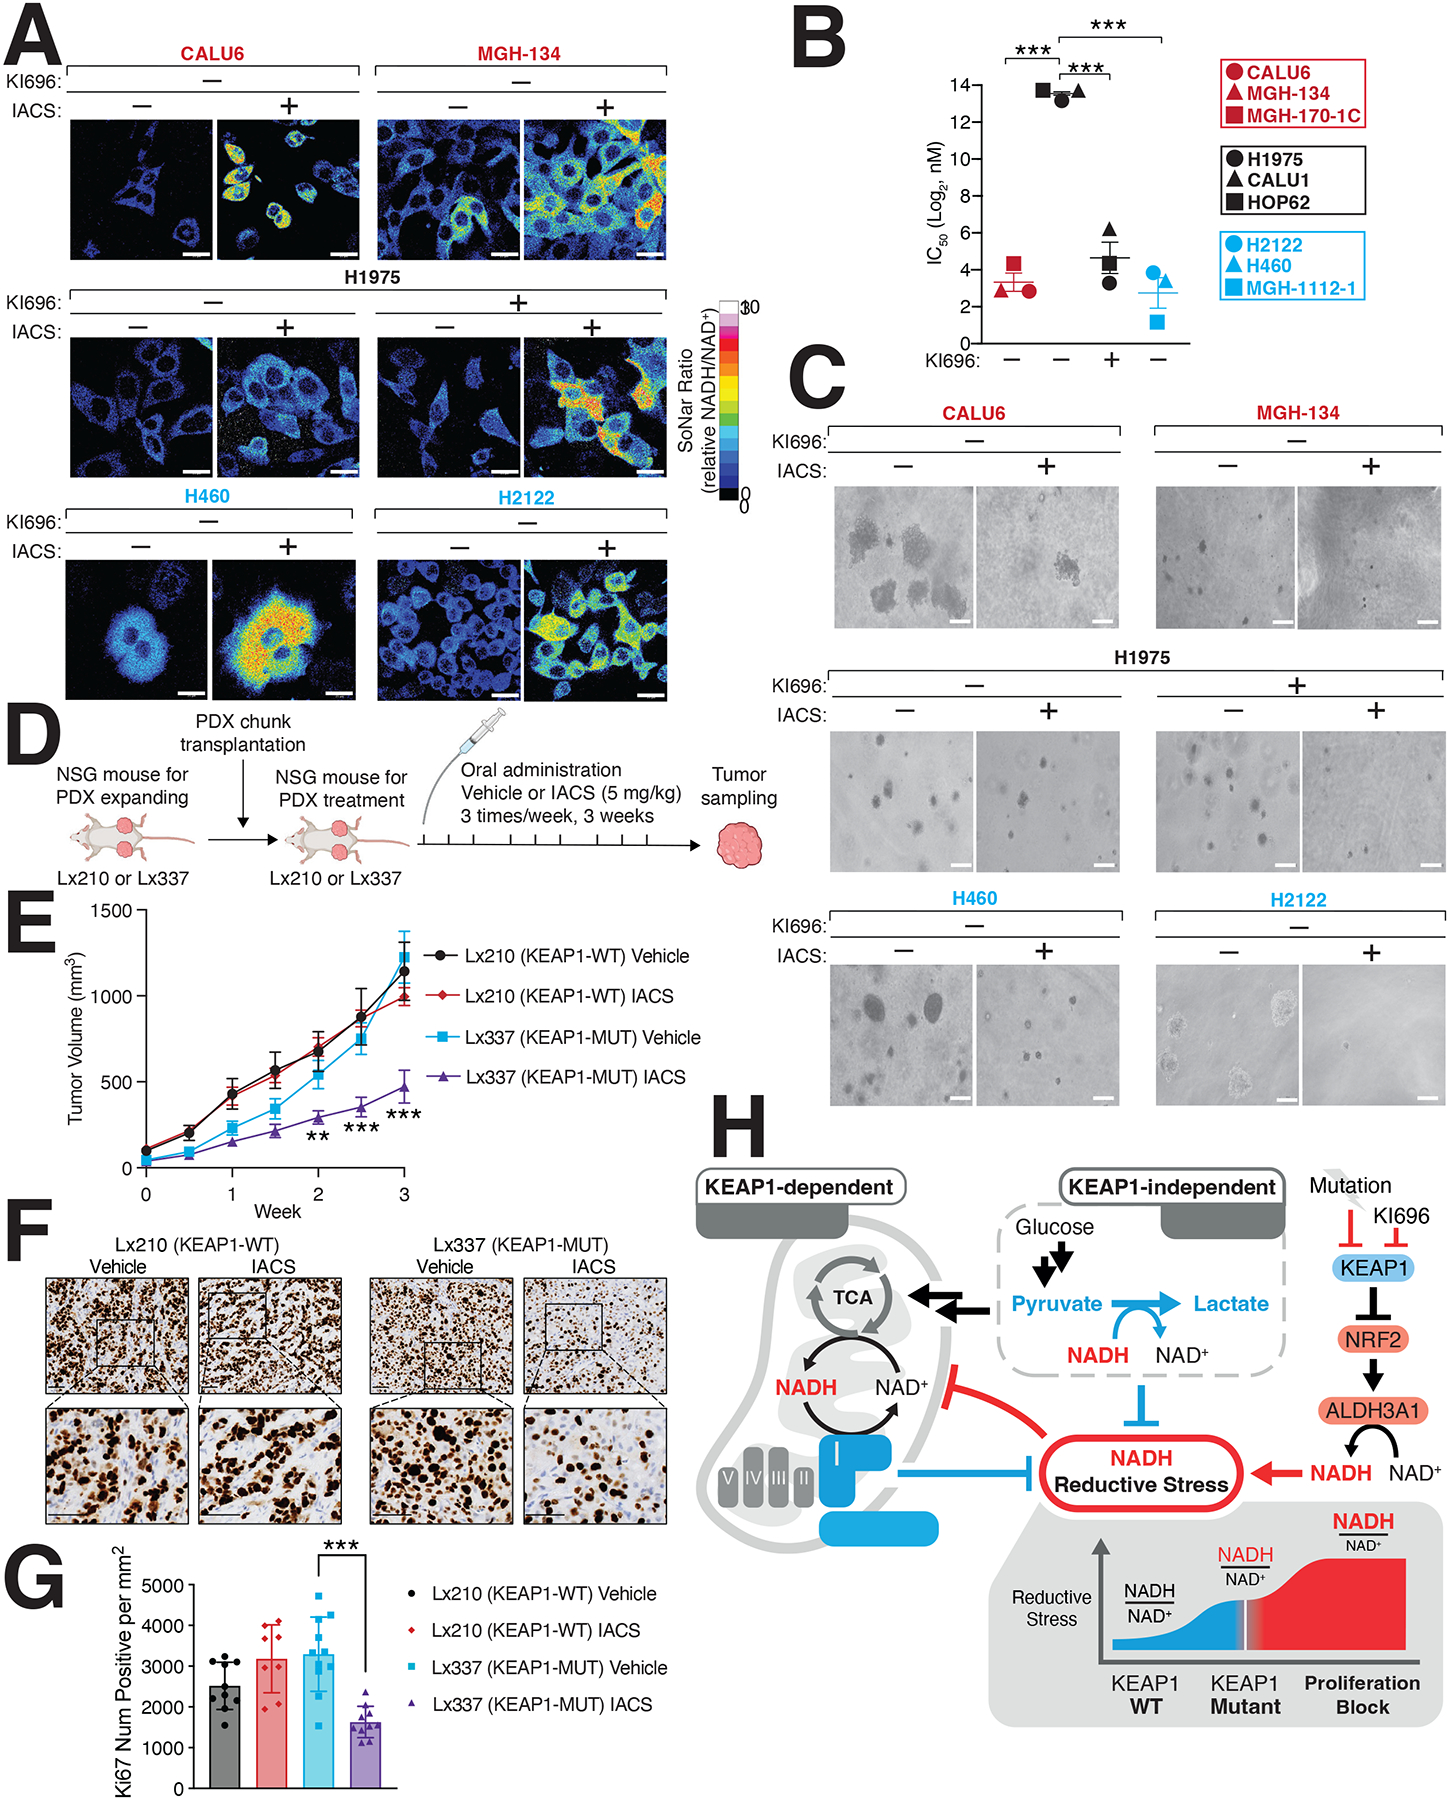
Multiple cancers regulate oxidative stress by activating the transcription factor NRF2 through mutation of its negative regulator, KEAP1. NRF2 has been studied extensively in KEAP1-mutant cancers; however, the role of this pathway in cancers with wild-type KEAP1 remains poorly understood. To answer this question, we induced NRF2 via pharmacological inactivation of KEAP1 in a panel of 50+ non-small cell lung cancer cell lines. Unexpectedly, marked decreases in viability were observed in >13% of the cell lines-an effect that was rescued by NRF2 ablation. Genome-wide and targeted CRISPR screens revealed that NRF2 induces NADH-reductive stress, through the upregulation of the NAD+-consuming enzyme ALDH3A1. Leveraging these findings, we show that cells treated with KEAP1 inhibitors or those with endogenous KEAP1 mutations are selectively vulnerable to Complex I inhibition, which impairs NADH oxidation capacity and potentiates reductive stress. Thus, we identify reductive stress as a metabolic vulnerability in NRF2-activated lung cancers.

Keywords: NADH/NAD(+); NRF2-KEAP1 pathway; functional genomic; non-small cell lung cancer; oxidative phosphorylation; reductive stress.


Conflict of interest statement

Declaration of interests L.B-P is a founder, consultant, and holds privately held equity in Scorpion Therapeutics. D.E.F. has a financial interest in Soltego, a company developing salt-inducible kinase inhibitors for topical skin-darkening treatments that might be used for a broad set of human applications. The interests of L.B-P and D.E.F. were reviewed and are managed by Massachusetts General Hospital and Partners HealthCare in accordance with their conflict-of-interest policies. M.C.H. is on the SAB and holds equity in Alixia Therapeutics and is on the SAB of Minovia. T. P. is on the SAB of Faeth Therapeutics and consults for Dracen Pharmaceuticals. A.N.H receives research funding from Amgen, Blueprint Medicines, BridgeBio, Bristol-Myers Sqiub, C4 Therapeutics, Eli Lilly, Novartis, Nuvalent, Pfizer, Roche/Genentech, and Scorpion Therapeutics, and consults for Engine Biosciences, Nuvalent, TigaTx, and Tolremo Therapeutics.

Figures

Figure 1:
Figure 1:. Identification of KEAP1-dependent NSCLC cell lines.
(A) Representative immunoblot analysis of NSCLC cell lines following treatment with the NRF2-activator KI696 (1μM) for 48 hrs. (B) NRF2 activation in a panel of 50+ NSCLC cell lines identifies KI696-sensitive cell lines. Cells were pre-treated with KI696 (1 μM) for 48 hrs and proliferation was determined by crystal violet staining following another 6 days of treatment. (C) Depletion of KEAP1 blocks proliferation of KI696-sensitive cell lines. KI696-sensitive (herein referred to as KEAP-dependent) and KI696-insensitive (KEAP1-independent) cell lines expressing sgRNAs targeting KEAP1 or a non-targeting control were analyzed for proliferation defects as described in (B) (Data are represented as a mean ± SEM, n=5 biological replicates). (D) Depletion of NRF2 rescues KI696-sensitivity. NSCLC cell lines expressing the indicated sgRNAs were treated with KI696 (1 μM) and proliferation was determined as described in (B) (Data are represented as a mean ± SEM, n=5 biological replicates). (E) Genome-wide CRISPR screen identifies genes mediating resistance and sensitivity to KEAP1-dependency. Highlighted genes are key mediators of sensitivity (red) or resistance (blue) (see also Table S1). (F) Genes localized to metabolic pathways function as key mediators of sensitivity to NRF2 activation in CALU6 cells (see also Table S1). (G) Metabolism-focused CRISPR screen identifies metabolic regulators of NRF2 sensitivity. KEAP1-dependent CALU6 (red) and KEAP1-Independent (black) H1975 cells were infected with a metabolism-focused sgRNA library and treated as described in (E) (see also Table S2). (H) Inactivation of oxidative phosphorylation (OXPHOS) sensitizes KEAP1-dependent cells to NRF2 activation whereas blockage of glycolysis sensitizes KEAP1-independent cells to NRF2 (see also Figure S2E). Statistical significance was determined by One-way ANOVA with Sidak’s corrections for multiple comparisons. *** indicates p-values < 0.0001.
Figure 2:
Figure 2:. Metabolic requirements for NRF2 sensitivity.
(A) NRF2 sensitivity correlates with higher levels of oxidative metabolism. Oxygen consumption rate (OCR) and extracellular acidification (ECAR) were measured in a panel of NSCLC cells and the OCR/ECAR for each cell line was plotted against its corresponding sensitivity to NRF2 activation (Data are represented as a mean ± SEM, n=6–8 biological replicates). (B) KEAP1-dependent cells have a lower glycolytic gene signature (see also Table S3). (C) The rate-limiting glycolytic enzyme phosphofructokinase, platelet isoform (PFKP), is highly expressed in KEAP1-dependent cells. Quantification of PFKP levels relative to β-actin (see also Figure S2G). (D) PFKP overexpression restores proliferation following NRF2 activation. Relative proliferation of CALU6 cells expressing FLAG-PFKP or FLAG-METAP2 (control) was determined by crystal violet staining following doxycycline (DOX) (100 nM) and KI696 (1 μM) treatment (Data are represented as a mean ± SEM, n=5 biological replicates). (E) Hypoxia rescues NRF2 sensitivity. Relative proliferation in a panel of NSCLC cell lines following treatment with KI696 (1 μM) and culture in normoxic (20% O2) or hypoxic conditions (1.5% O2) was determined as in (D) (Data are represented as a mean ± SEM, n= 5 biological replicates). (F-G) Glycolytic inhibition sensitizes cells to NRF2 activation. KEAP1-independent cells were treated with KI696 (1 μM) and cultured in media containing glucose (10 mM) or galactose (10 mM) (F) or co-treated with sodium oxamate (10 mM) (G) and relative proliferation was determined as in (D) (Data are represented as a mean ± SEM, n=5 biological replicates). (H) NRF2 activation decreases maximal respiration in KEAP1-dependent cells. Maximal respiration was determined in a panel of NSCLC lines following treatment with KI696 (1 μM) for 48 hrs (Data are represented as a mean ± SEM, n=6–8 biological replicates). * indicates p-values < 0.05, *** indicates p-values < 0.0001. One-way ANOVA with Sidak’s post-hoc correction and two-tailed student’s t-test were used to determine statistical significance.
Figure 3:
Figure 3:. NRF2 activation decreases mitochondrial activity in KEAP1-dependent cells.
(A) NSCLC cell lines were treated with KI696 (1 μM) for 48 hrs and the oxygen consumption rate (OCR) was determined using a Seahorse Bioflux analyzer (Data are represented as a mean ± SEM, n= 6–8 biological replicates). (B) NRF2 regulates OCR in KEAP1-dependent cells. CALU6 cells expressing the indicated sgRNA targeting NRF2 or a control, were treated with KI696 (1 μM) for 48 hrs and OCR was determined as described in (A) (Data are represented as a mean ± SEM, n=6–8 biological replicates). (C) NRF2 activation decreases TCA metabolites in KEAP1-dependent cell lines. NSCLC cell lines were treated with KI696 (1 μM) for 48 hrs and the levels of the indicated metabolites were determined by GCMS (see methods). Fold change (KI696/DMSO) is depicted in the plots (Data are represented as a mean, n= 5 samples per group with 4 biological replicates per sample). (D-E) Complex I inhibition is selectively toxic to KEAP1-dependent cell lines. Schematic of different ETC inhibitors used in this study (D). IC50-values (E) were determined for a panel of NSCLC cell lines (Data are represented as a mean ± SEM, n= 4–5 samples/group measured in 4–6 biological replicates). * indicates p-values < 0.05, ** indicates p-values < 0.01, *** indicates p-values < 0.0001. Statistical significance was determined by Student’s t-test and corrected for multiple hypotheses by False Discovery Rate (FDR), see Methods.
Figure 4:
Figure 4:. NRF2 induces NADH-reductive stress in KEAP1-dependent cells.
(A) NRF2 activation increases the NADH/NAD+ ratio in KEAP1-dependent but not KEAP1-independent cells. Immunofluorescence analysis of NSCLC cell lines stably expressing the NADH/NAD+ reporter SoNar following treatment with KI696 (1 μM) for 48 hrs. The representative NADH/NAD+ ratiometric image was constructed by taking the ratio of the emission intensity of 405 (NADH binding) vs 488 (NAD+ binding) for SONAR (see also Figures S4D–E). (B) NRF2 depletion rescues KI696-mediated NADH/NAD+ increase. NSCLC cells expressing SoNar as in (A) and corresponding sgRNAs targeting NRF2 or a control were treated with KI696 and cells were analyzed as in (A) (see also Figure S4J). (C-D) Supplementation with NMN restores the NADH/NAD+ ratio following NRF2 activation and rescues proliferation in KEAP1-dependent cells. KEAP1-dependent NSCLCs were treated with KI696 and NMN (1mM) where indicated and analyzed as in (A) or assayed for a change in proliferation by crystal violet staining 6 days post treatment (D) (Data are represented as a mean ± SEM, n= 4–5 biological replicates) (see also Figure S4K). (E) Over-expression of NADH oxidizing enzymes partially rescues NRF2 activation. CALU6 cells stably expressing NDI1, LbNOX or METAP2 (control) were treated with KI696 and assayed for proliferation as described in (D) (Data are represented as a mean ± SEM, n= 5 biological replicates). (F) KEAP1-dependent cells have a higher rate of Complex I NADH oxidation compared to KEAP1-independent NSCLCs. NSCLC cell lines stably expressing SoNar were treated with rotenone (0.5 μM) and analyzed by flow cytometry taking the ratio of the emission intensity at λem 530nm after excitation at λex 405 nm (NADH binding) or λex 488 nm (NAD+ binding).
Figure 5:
Figure 5:. Identification of ALDH3A1 as a mediator of NRF2 reductive stress.
(A) Expression and dependency of NAD+ utilizing enzymes following NRF2 activation in CALU6 cells. Scatter plot of NAD+-utilizing enzymes identified in metabolism-focused CRISPR screen (see also Table S2) and proteomics (see also Figure S3C) following KI696 treatment. (B) ALDH3A1 depletion rescues high NADH levels following NRF2 activation. CALU6 and MGH-134 cells stable expressing SoNar and the indicated sgRNAs were treated with KI696 for 48 hrs. The representative NADH/NAD+ ratiometric image was constructed by taking the ratio of the emission intensity of 405 nm (NADH binding) vs 488 nm (NAD+ binding) for SoNar (see also Figure S5G). (C) ALDH3A1 is sufficient to increase NADH/NAD+ ratio in KEAP1-dependent cells. The NADH/NAD+ ratio CALU6 or MGH-134 cells expressing SoNar and over-expressing ALDH3A1 or Metap2 (control) was determined by flow cytometry. (D) Loss of ALDH3A1 rescues proliferation following NRF2 activation. KEAP1-dependent NSCLC cells expressing the indicated sgRNAs were treated with KI696 (1 μM) and proliferation was determined as described in (D) (Data are represented as a mean ± SEM, n= 5 biological replicates per condition). (E) ALDH3A1 regulates aldehyde levels in KEAP1-dependent cells. Plot compares fold change with corresponding significance for mass spectrometry analysis of CALU6 cells expressing the indicated sgRNAs. Each data point corresponds to an m/z value consistent with an aldehyde identified in human cells (see also Table S5, Methods). (F) PAA and 4PAA are regulated by ALDH3A1. CALU6 cells expressing the indicated sgRNAs were treated with KI696 for 48 hrs and the relative levels of metabolites consistent with PAA and 4PAA were analyzed as described in (E) (Data are represented as a mean ± SEM, n= 3 biological replicates). (G) PAA and 4PAA are ALDH3A1 substrates. PAA and 4PAA and NAD+ were added to highly purified ALDH3A1 or a control protein (METAP2) and NADH accumulation was determined in vitro by monitoring its absorbance at 340 nm (Data are represented as a mean ± SEM, n= 3 biological replicates). (H) Liquid chromatography mass spectrometry (LCMS)-based fragmentation corresponding to substrates (NAD+, PAA, 4PAA) and products (NADH, phenylacetate, 4-hydroxyphenylacetate) from ALDH3A1 reaction conducted in (G) (see also Methods). (I) PAA and 4PAA levels are regulated by NRF2. The indicated cell lines were treated with KI696 for 48 hrs and metabolites consistent with PAA or 4PAA were determined as described in (E) (Data are represented as a mean ± SEM, n= 3 biological replicates and normalized to DMSO treated samples) * indicates p-values < 0.05, ** indicates p-values < 0.01, *** indicates p-values < 0.0001. One-way ANOVA with Sidak’s post-hoc correction was used to determine statistical significance. Scale bar: 25 μm.
Figure 6:
Figure 6:. Inducing NADH-reductive stress selectively blocks proliferation of NRF2-activated NSCLCs.
(A) IACS-010759 (IACS) a Complex-I inhibitor, selectively increases NADH/NAD+ ratio in KEAP1-dependent (red) and KEAP1-mutant cells (blue) but not KEAP1-independent cells. NSCLC cells stably expressing SoNar were treated with IACS and analyzed by immunofluorescence. The representative NADH/NAD+ ratiometric image was constructed by taking the ratio of the emission intensity of 405 nm (NADH binding) vs 488 nm (NAD+ binding) for SoNar (see also Figure S6A). (B) IACS selectively blocks NSCLC proliferation following NRF2 activation. IC50 values were calculated for each cell line and where indicated cells were also treated with KI696 (1 μM) (Data are represented as a mean ± SEM, n= 6 biological replicates). (C) IACS selectively inhibits the anchorage-independent growth of NSCLCs with hyperactivate NRF2 signaling. Representative images of NSCLC cell lines grown in soft agar following treatment with IACS-017509 (200 nM) or co-treated with KI696 (1 μM) as indicated (Data are represented as a mean ± SEM, n= 6–8 biological replicates) (see also Figure S6C). (D) Schematic for in vivo study. (E) IACS selectively blocks the growth of KEAP1-mutant tumors. Relative tumor growth of subcutaneous patient-derived xenografts (PDX) WT or mutant (MUT) for KEAP1 receiving vehicle or IACS (5 mg/kg) (Data are normalized to first treatment, n=10 KEAP1-WT, Vehicle; 12 KEAP1-WT IACS, 14 KEAP1-MUT Vehicle, 18 KEAP1-MUT IACS (see also Figure S6E). (F-G) Representative immunohistochemistry staining (F) and quantification of Ki67 serial sections taken from KEAP1-WT and KEAP1-MUT PDX tumors treated with IACS or vehicle. (H) Model. NRF2 activation following pharmacologic inhibition or mutation of KEAP1 increases ALHD3A1 resulting in NADH reductive stress. KEAP1-dependent and -independent cells utilize different NADH oxidation pathways to counter reductive stress. * indicates p-values < 0.05, ** indicates p-values < 0.01, *** indicates p-values < 0.0001. One-way ANOVA with Sidak’s post-hoc correction was used to determine statistical significance. Scale-bar: 25 μm for immunofluorescence and 50 μM for soft agar and immunohistochemistry.

References

    1. Kerk SA, Papagiannakopoulos T, Shah YM & Lyssiotis CA (2021). Metabolic networks in mutant KRAS-driven tumours: tissue specificities and the microenvironment. Nat Rev Cancer 21, 510–525, doi:10.1038/s41568-021-00375-9. - DOI - PMC - PubMed
    1. Martinez-Reyes I & Chandel NS (2021). Cancer metabolism: looking forward. Nat Rev Cancer 21, 669–680, doi:10.1038/s41568-021-00378-6. - DOI - PubMed
    1. Cantor JR & Sabatini DM (2012). Cancer cell metabolism: one hallmark, many faces. Cancer Discov 2, 881–898, doi:10.1158/2159-8290.CD-12-0345. - DOI - PMC - PubMed
    1. Vander Heiden MG & DeBerardinis RJ (2017). Understanding the Intersections between Metabolism and Cancer Biology. Cell 168, 657–669, doi:10.1016/j.cell.2016.12.039. - DOI - PMC - PubMed
    1. Elia I & Haigis MC (2021). Metabolites and the tumour microenvironment: from cellular mechanisms to systemic metabolism. Nat Metab 3, 21–32, doi:10.1038/s42255-020-00317-z. - DOI - PMC - PubMed

Publication types

MeSH terms