. 2023 Feb 25;14(1):1089.
doi: 10.1038/s41467-023-36628-4.

A density functional theory for ecology across scales

Affiliations

A density functional theory for ecology across scales

Martin-I Trappe et al. Nat Commun. .

Abstract

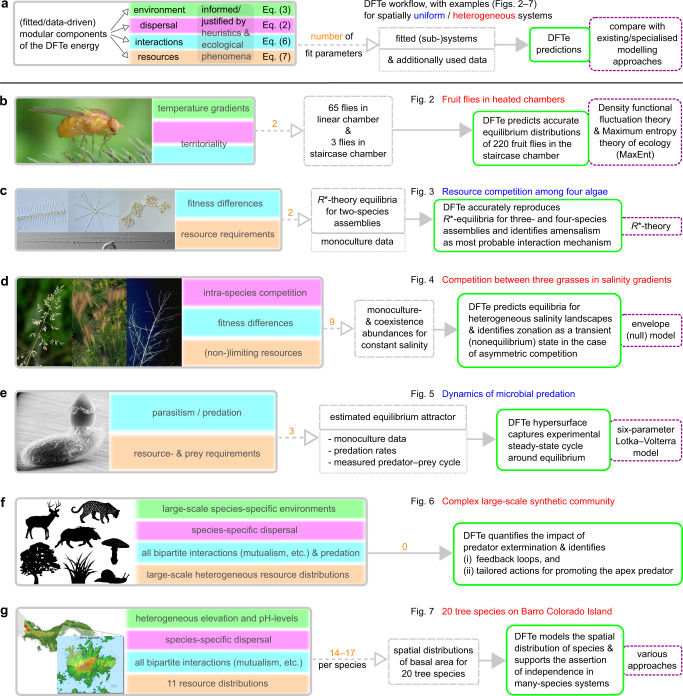
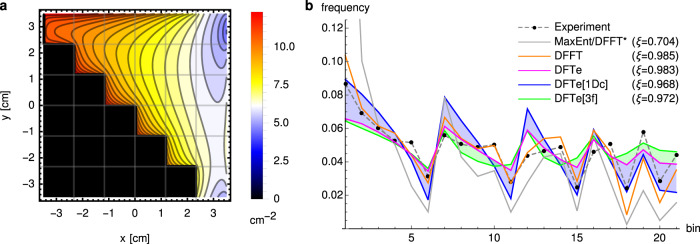
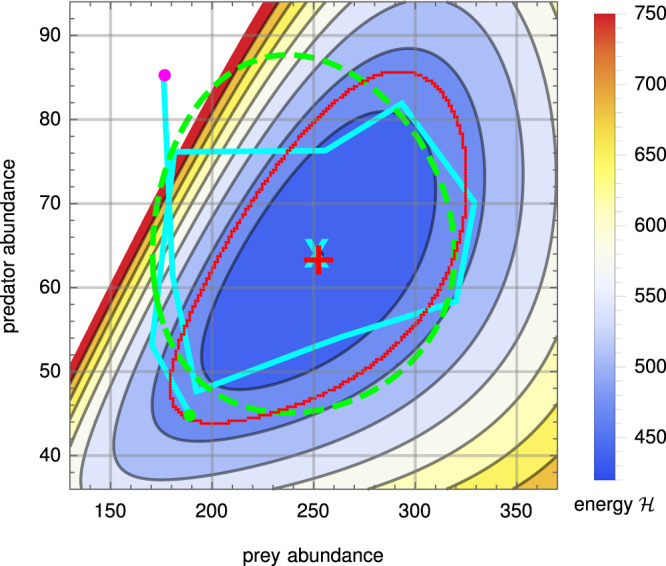
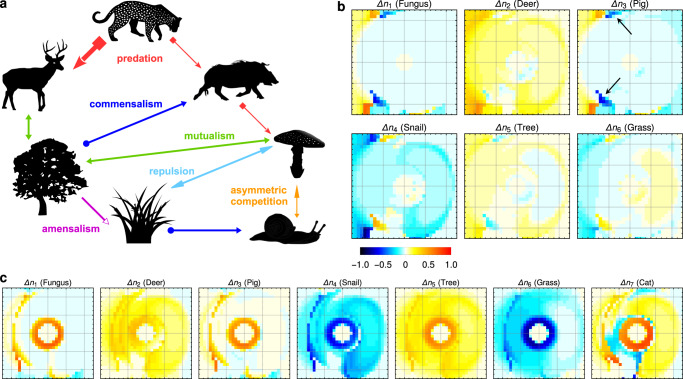
Ecology lacks a holistic approach that can model phenomena across temporal and spatial scales, largely because of the challenges in modelling systems with a large number of interacting constituents. This hampers our understanding of complex ecosystems and the impact that human interventions (e.g., deforestation, wildlife harvesting and climate change) have on them. Here we use density functional theory, a computational method for many-body problems in physics, to develop a computational framework for ecosystem modelling. Our methods accurately fit experimental and synthetic data of interacting multi-species communities across spatial scales and can project to unseen data. As the key concept we establish and validate a cost function that encodes the trade-offs between the various ecosystem components. We show how this single general modelling framework delivers predictions on par with established, but specialised, approaches for systems from predatory microbes to territorial flies to tropical tree communities. Our density functional framework thus provides a promising avenue for advancing our understanding of ecological systems.


Conflict of interest statement

The authors declare no competing interests.

Figures

Fig. 1
Fig. 1. Framework for establishing, validating, and applying DFTe.
a The workflow for extracting DFTe predictions from ecosystems whose properties justify and inform our choices for the components of the DFTe energy functional E (see Methods). Fitting the resulting explicit parameterisations of E to less complex subsystems, we created problem-adjusted tools for addressing the complete systems and their modifications and extensions. We compared DFTe quantitatively with the alternative approaches specified in the violet boxes. bg We highlight our main results for six experimental and synthetic systems (Figs. 2–7), which cover a broad range of taxa, interactions, and environmental settings. The successful modelling of these varied setups gives hope that our DFTe framework can address a much broader range of ecological systems, and that it is the first stepping stone towards a universal density functional theory for ecology as a whole. In view of the conceptual disparity between DFTe and existing ecological theories, it is expedient to make connections at the level of predictions rather than the basic equations: the DFTe framework’s strength is that it brings generality to ecosystem modelling, though it may be outperformed by specialised modelling approaches in specific cases. Details on the parameterisation of each example are given in ‘Results’ and ‘Methods’. We appreciate the photographs of the diatoms, provided by Jason Oyadomari (Fig. 1c, top) and Don Charles (Fig. 1c, bottom); see Supplementary Notes for further details on image sources.
Fig. 2
Fig. 2. An application to confined fruit flies demonstrates how DFTe can predict the spatial distribution of a population given fixed total abundance.
a The DFTe prediction of the spatial density distribution of 220 interacting flies in a staircase chamber with heat source at x = 3.5 cm. The model was parameterised with two datasets: one with 65 flies in a heterogeneously heated elongated chamber [1Dc]; and one with three flies in the staircase chamber [3f]. b, The DFTe prediction closely matches the experimental data (each point shows one of the 21 grid cells accessible to flies, in row-major order starting from the top left bin of a; overlap of predictions p and data d is measured with the least-squares correlator ξ = 2p ⋅ d/(p2 + d2)). The accuracy of DFTe (ξ ≈ 0.98) is essentially equivalent to DFFT—using the same data for fitting. As expected, DFTe performs more poorly if parameterised based only on the high-density chamber data (DFTe[1Dc]) or only on the low-density staircase data (DFTe[3f]), but any DFTe approach outperforms the naive prediction of maximum entropy theory (MaxEnt/DFFT*).
Fig. 3
Fig. 3. An application to Tilman’s algae competition experiments demonstrates DFTe’s ability to handle resource constraints.
Without exception, we found that DFTe delivers the R*-equilibria of (i) the four-species assemblage (F∣A∣S∣T) of Fragilaria crotonensis (F), Asterionella formosa (A), Synedra filiformis (S), and Tabellaria flocculosa (T), and (ii) the three-species subsets accurately (ξ ≈ 1; the colour legend applies to all graphs). Each of the five columns of graphs represents 100 randomly drawn resource combinations and shows the resulting DFTe abundances Ns (s ∈ {F, A, S, T}; given per micro-litre of suspension) relative to R*-predictions. The DFTe abundances are represented by coloured points, each associated with one resource combination. If both DFTe and R*-theory predict the same abundance of one of the system’s species, then the coloured point falls on the diagonal grey line of the corresponding graph, while its colour reports the overlap ξ of all (three or four) abundances with the R*-predictions for the associated resource combination. We do not show results for T, which is competitively excluded in all 500 cases within both R*-theory and DFTe. The framed box within each graph displays the number of resource cases (out of 100) for which the species was excluded in (i) both R*-theory and DFTe, and (ii) in R*-theory but not in DFTe [in square brackets; the percentage gives the (on-average) abundance of the minority species relative to the majority species, that is, the minority species was almost excluded]. We observed the latter case only if both F and A, which have similar competitive abilities (see Supplementary Notes), were part of the assemblage. Supplementary Fig. 3 shows a summarising histogram in terms of ξ.
Fig. 4
Fig. 4. An application to plants in salinity gradients demonstrates how DFTe can extrapolate scarce experimental data into novel more-complex settings.
a We fitted the DFTe functional (Eq. (29) in Methods) with asymmetric repulsive contact interactions between the three grass species Poa pratensis (Poa), Hordeum jubatum (Hord), and Puccinellia nuttalliana (Pucc) to experimental above-ground biomass data. These data are reported in ref. for monoculture and mixture setups at spatially uniform salinity levels. We used the parameterised model to predict spatial distributions of the hypothetical, but data-informed, limiting resources ρlim for each species in a synthetic landscape with heterogeneous salinity (square area A = 1). bd This then allows prediction of the spatial distributions of the densities of the three species. Panels bd also approximate time-dependent dynamics by showing snapshots of density distributions along the linear trajectory in the space of abundances from an initial state where Poa is in monoculture (N = (2.499, 0.0, 0.0) (see Supplementary Fig. 4a) to the global equilibrium at N=N^=(1.006,3.069,1.738), as indicated by the red dots in the sketches. The model predicts a rich zoo of phases (see Methods and Supplementary Fig. 4), including zonation as a transient state (c) on the way to the smooth equilibrated mixture (d). The large relative deviations of DFTe densities from those of a generic envelope model (Nnm = (0.872, 3.056, 1.881)), which in this case represents a null model, reveal the substantial impact of heterogeneity on the grass distributions (e).
Fig. 5
Fig. 5. An application to a predator–prey system demonstrates the ability of DFTe to capture non-equilibrium steady-state dynamics.
The DFTe hypersurface H(N) is a platform for ecosystem dynamics, much like the analogous energy surface of classical physics is for Kepler orbits in a gravitational field. The cyclic DFTe equipotential line (red curve) probes H away from equilibrium (red plus sign) and captures the empirically measured cycle (cyan curve, starting at the magenta dot and ending at the green dot) centred on the cyan cross, which represents the average measured abundances and anchors the DFTe fit. Strong excitations on H permit predator extinction along noncyclic trajectories: the high-energy equipotential lines terminate at the abscissa, but not at the ordinate (H exceeds 750 in the white region and diverges towards the ordinate; see also Supplementary Fig. 8b for an overview plot of H). The DFTe trajectory lacks information on the time-resolved rates of abundance changes and, thus, does not translate unambiguously into a time series that would allow point-wise comparison with predictions from dynamic models—see Supplementary Notes for ways to augment DFTe with explicit Newtonian-type time evolution based on H. However, we compute the DFTe trajectory by fitting only three parameters and find it to be of similar quality to a fitted trajectory from the standard six-parameter Lotka–Volterra model (dashed green; see Supplementary Notes), as judged by aLV=ALV/Aexp149% and aDFTe=ADFTe/Aexp151%, which quantify the excess of the areas ALV and ADFTe, enclosed by the corresponding predicted trajectories, over Aexp, enclosed by the experimental cycle.
Fig. 6
Fig. 6. An application to a hypothetical food web demonstrates DFTe’s abilities to make predictions about the effects of perturbations on complex ecosystems.
a The cartoon illustrates the food web involving seven hypothetical species on a synthetic landscape with heterogeneous environmental suitability and resource availability (Supplementary Table 4 and Supplementary Fig. 11). b The six sub-panels depict the relative changes of species distributions following the extermination of the Cat (see graphical legend; redder colours indicate increasing populations; bluer colours indicate decreasing populations). While density surges of the Cat’s prey (the Cat requires both Deer and Pig) are to be expected, the absence of the apex predator has repercussions throughout the entire community—evidently, the interaction-mediated links in the community are strong enough to induce major distortions of the density distributions of all species. This includes effects that may come as a surprise prior to our quantitative simulation, such as regionally declining Pig populations. Two such enclaves are indicated with arrows. We found the main effect of removing the Cat to be a re-equilibration of the whole ecosystem through feedback loops that promote Fungus, Deer, and Tree, but penalise Grass and Snail. We gained confidence in these DFTe predictions by successively building the complete community from simpler subsystems that permit an intuitive understanding of the relations between the model ingredients and the equilibrated density distributions (see Methods, Supplementary Figs. 12 and 13, and Supplementary Notes). For a real system, we could then use the quantitative knowledge obtained from the perturbation simulation to promote the Cat through informed actions: c Cutting the Tree’s deforestation stress in half, we increased the Cat population by 36% and created new Cat habitat, especially in the central ring region (see Methods and Supplementary Fig. 14).
Fig. 7
Fig. 7. An application to the tropical-forest data from Barro Colorado Island demonstrates the scalability of DFTe towards many-species systems.
a We obtained the DFTe densities n~sn~s0, which represent the spatially resolved fractional basal area of species s averaged over all available censuses, in the top (centre) row of charts by simultaneously fitting the general DFTe energy functional E with (without) inter-species interactions to the reference densities nsref in the bottom charts; see Methods. Both n~s and n~s0 are an adequate fit (ξ ≈ 0.79) to nsref for all twenty species; see also Supplementary Fig. 15 and Supplementary Table 5. In the three charts for each of the species shown (s = 1, 4, 8, 12, 16, 20) we report the density values relative to maxrn~s(r),n~s0(r),nsref(r). Complementing measures of the quality of n~ are the species-resolved variability in density (b) and the (sorted) least-squares overlaps ξ of abundances N(Q) with Nref(Q), viz. the overlaps of local species-abundance distributions (SAD) for each of the 45 quadrats Q (c). d The fit parameters associated with altitude, pH-level, and dispersal, with and without bipartite interactions. e, The fit results for the bipartite interaction kernels (see Methods); each sub-panel is normalised to its respective maximum value.

Similar articles

Cited by

References

    1. Tilman D. Tests of resource competition theory using four species of Lake Michigan Algae. Ecology. 1981;62:802. doi: 10.2307/1937747. - DOI
    1. Pacala SW, et al. Forest models defined by field measurements: estimation, error analysis and dynamics. Ecol. Monogr. 1996;66:1. doi: 10.2307/2963479. - DOI
    1. Cabral JS, Valente L, Hartig F. Mechanistic simulation models in macroecology and biogeography: state-of-art and prospects. Ecography. 2017;40:267. doi: 10.1111/ecog.02480. - DOI
    1. Levin SA. The problem of pattern and scale in ecology: the Robert H. MacArthur award lecture. Ecology. 1992;73:1943. doi: 10.2307/1941447. - DOI
    1. Leibold MA, et al. The metacommunity concept: a framework for multi-scale community ecology. Ecol. Lett. 2004;7:601. doi: 10.1111/j.1461-0248.2004.00608.x. - DOI

Publication types