

On the potential of transauricular electrical stimulation to reduce visually induced motion sickness
- PMID: 36841838
- PMCID: PMC9968344
- DOI: 10.1038/s41598-023-29765-9
On the potential of transauricular electrical stimulation to reduce visually induced motion sickness
Abstract
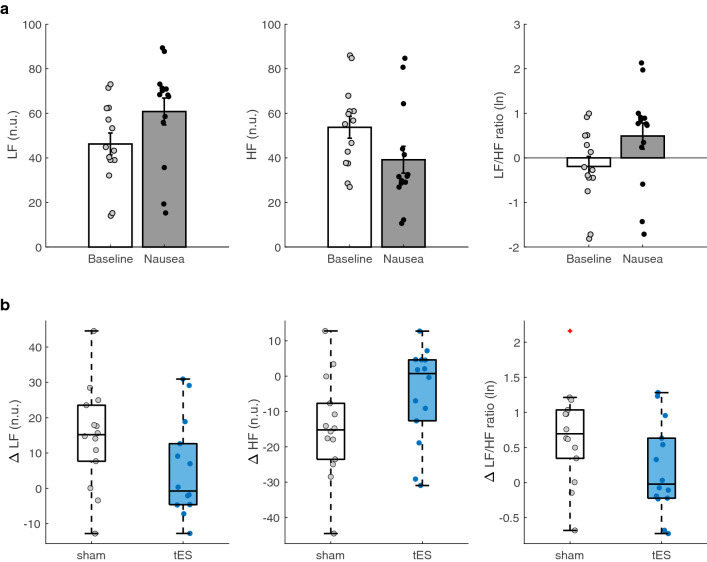
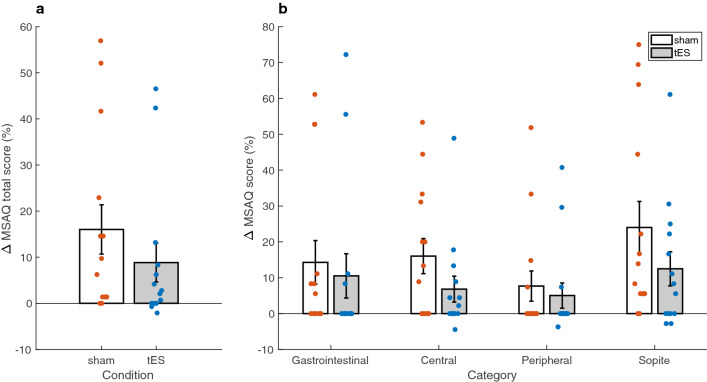
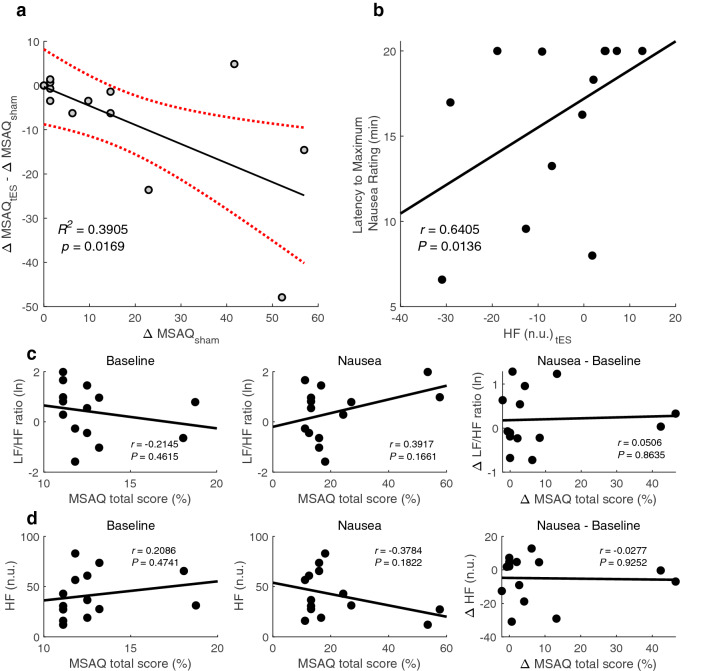
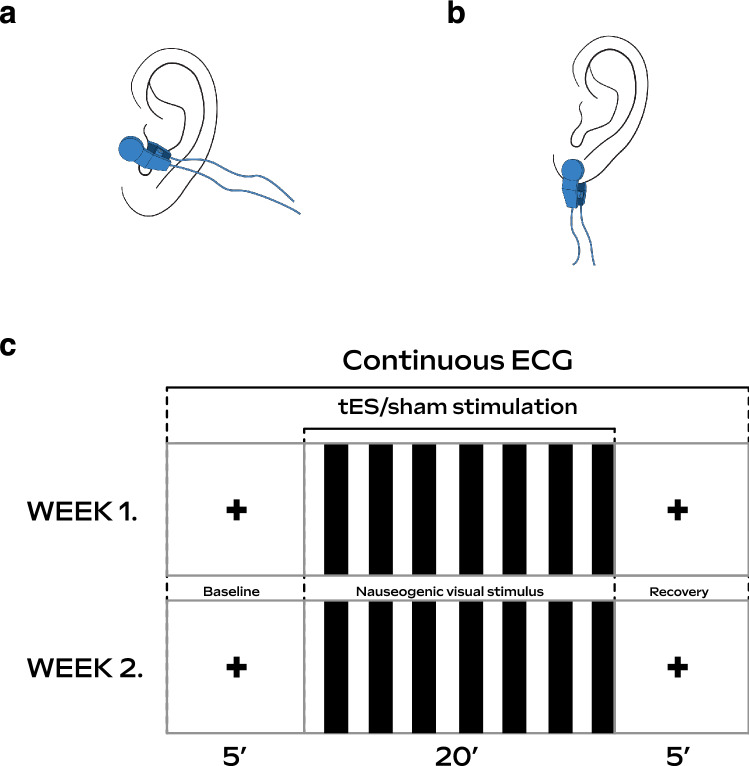
Perturbations in the autonomic nervous system occur in individuals experiencing increasing levels of motion sickness. Here, we investigated the effects of transauricular electrical stimulation (tES) on autonomic function during visually induced motion sickness, through the analysis of spectral and time-frequency heart rate variability. To determine the efficacy of tES, we compared sham and tES conditions in a randomized, within-subjects, cross-over design in 14 healthy participants. We found that tES reduced motion sickness symptoms by significantly increasing normalized high-frequency (HF) power and decreasing both normalized low-frequency (LF) power and the power ratio of LF and HF components (LF/HF ratio). Furthermore, behavioral data recorded using the motion sickness assessment questionnaire (MSAQ) showed significant differences in decreased symptoms during tES compared to sham condition for the total MSAQ scores and, central and sopite categories of the MSAQ. Our preliminary findings suggest that by administering tES, parasympathetic modulation is increased, and autonomic imbalance induced by motion sickness is restored. This study provides first evidence that tES may have potential as a non-pharmacological neuromodulation tool to keep motion sickness at bay. Thus, these findings may have implications towards protecting people from becoming motion sick and possible accelerated recovery from the malady.
© 2023. The Author(s).
Conflict of interest statement
The authors declare no competing interests.
Figures
Similar articles
-
Transcutaneous Auricular Vagus Nerve Stimulation towards Visually Induced Motion Sickness Reduction: A Pilot Study.Annu Int Conf IEEE Eng Med Biol Soc. 2023 Jul;2023:1-4. doi: 10.1109/EMBC40787.2023.10340374. Annu Int Conf IEEE Eng Med Biol Soc. 2023. PMID: 38083234 Clinical Trial.
-
Motion sickness susceptibility associated with visually induced postural instability and cardiac autonomic responses in healthy subjects.Acta Otolaryngol. 2005 Mar;125(3):280-5. doi: 10.1080/00016480510003192. Acta Otolaryngol. 2005. PMID: 15966698
-
Yawning as a behavioral marker of mild motion sickness and sopite syndrome.Aviat Space Environ Med. 2014 Jun;85(6):658-61. doi: 10.3357/asem.3897.2014. Aviat Space Environ Med. 2014. PMID: 24919388
-
Heart rate variability and autonomic activity at rest and during exercise in various physiological conditions.Eur J Appl Physiol. 2003 Oct;90(3-4):317-25. doi: 10.1007/s00421-003-0953-9. Epub 2003 Sep 12. Eur J Appl Physiol. 2003. PMID: 13680241 Review.
-
Motion and space sickness: intestinal and autonomic correlates.Auton Neurosci. 2006 Oct 30;129(1-2):58-66. doi: 10.1016/j.autneu.2006.07.020. Epub 2006 Sep 6. Auton Neurosci. 2006. PMID: 16950658 Review.
Cited by
-
Effects of two kinds of vestibular function training on reducing motion sickness in college students.Front Neurol. 2025 Feb 6;16:1433065. doi: 10.3389/fneur.2025.1433065. eCollection 2025. Front Neurol. 2025. PMID: 39980635 Free PMC article.
-
Quantitative study on objective indicators for assessing motion sickness susceptibility based on Vestibulo-Ocular Reflex experiments.Sci Rep. 2024 Nov 20;14(1):28782. doi: 10.1038/s41598-024-80233-4. Sci Rep. 2024. PMID: 39567728 Free PMC article.
-
Transcutaneous Auricular Vagus Nerve Stimulation for Visually Induced Motion Sickness: An eLORETA Study.Brain Topogr. 2024 Nov 2;38(1):11. doi: 10.1007/s10548-024-01088-6. Brain Topogr. 2024. PMID: 39487878 Free PMC article. Clinical Trial.
References
-
- Reason, J. & Brand, J. Motion Sickness (Academic Press, 1975).
-
- Lackner, J. R. Motion sickness: Our evolving understanding and problems. in Reference Module in Neuroscience and Biobehavioral Psychology. 10.1016/B978-0-12-809324-5.21621-0 (Elsevier, 2019).
-
- Keshavarz B, Hecht H. Stereoscopic viewing enhances visually induced motion sickness but sound does not. Presence. 2012;21:213–228. doi: 10.1162/PRES_a_00102. - DOI
Publication types
MeSH terms
LinkOut - more resources
Full Text Sources
Other Literature Sources
Medical
Research Materials
Miscellaneous
