. 2023 Feb 25;14(1):1078.
doi: 10.1038/s41467-023-36826-0.

Long non-coding RNA-derived peptides are immunogenic and drive a potent anti-tumour response

Affiliations

Long non-coding RNA-derived peptides are immunogenic and drive a potent anti-tumour response

Wojciech Barczak et al. Nat Commun. .

Abstract

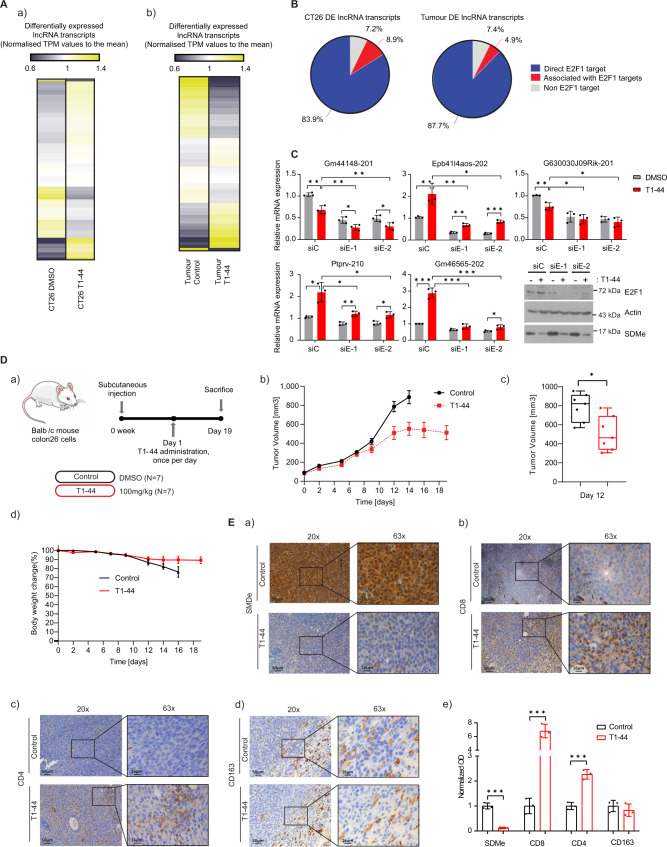
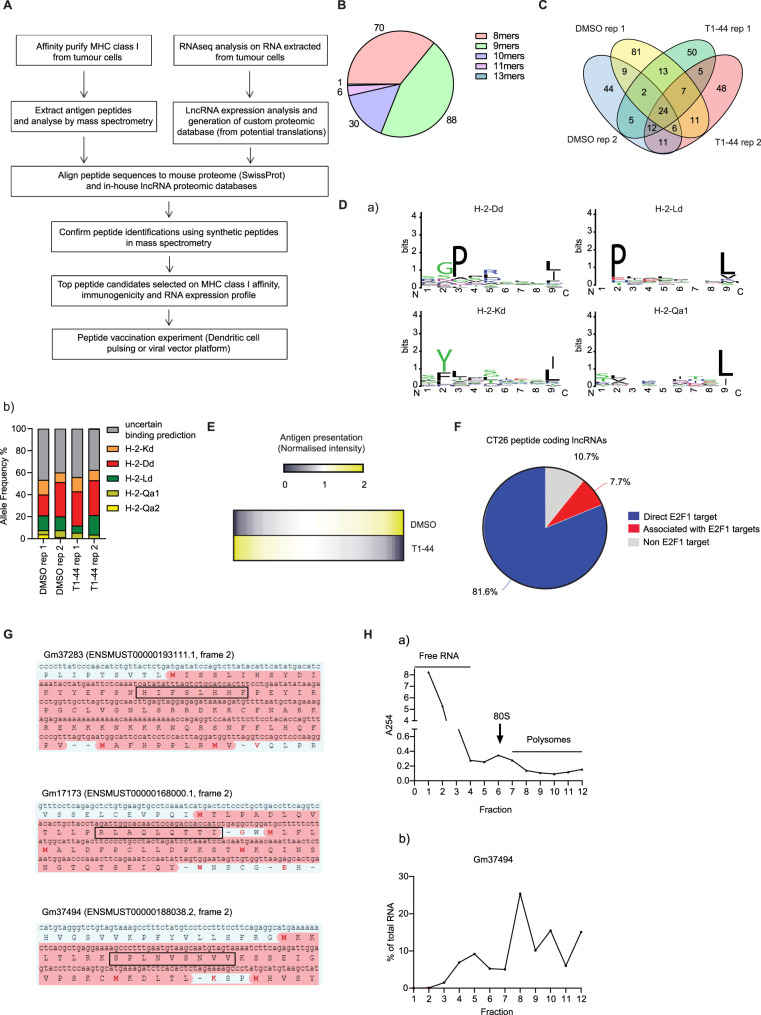
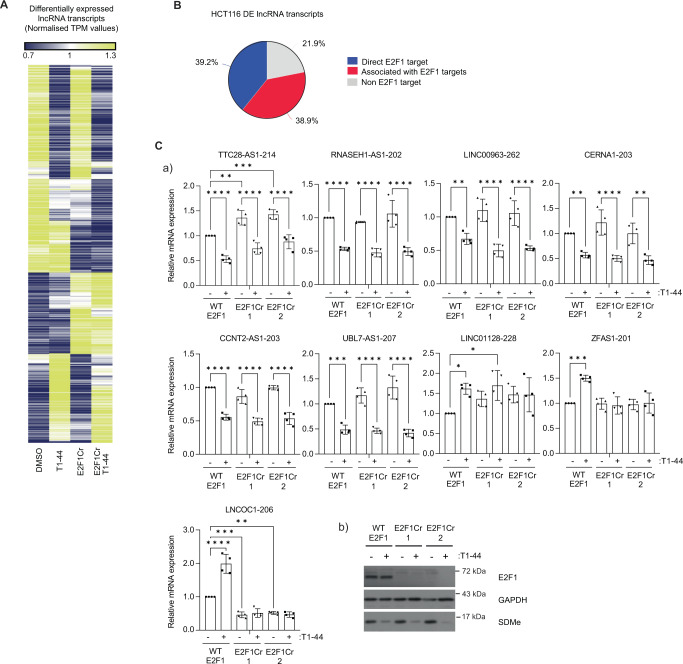
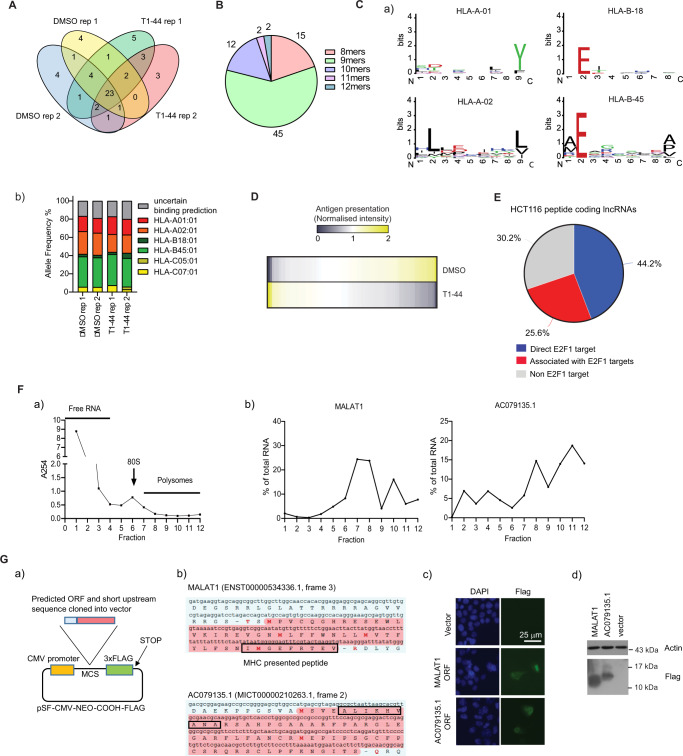
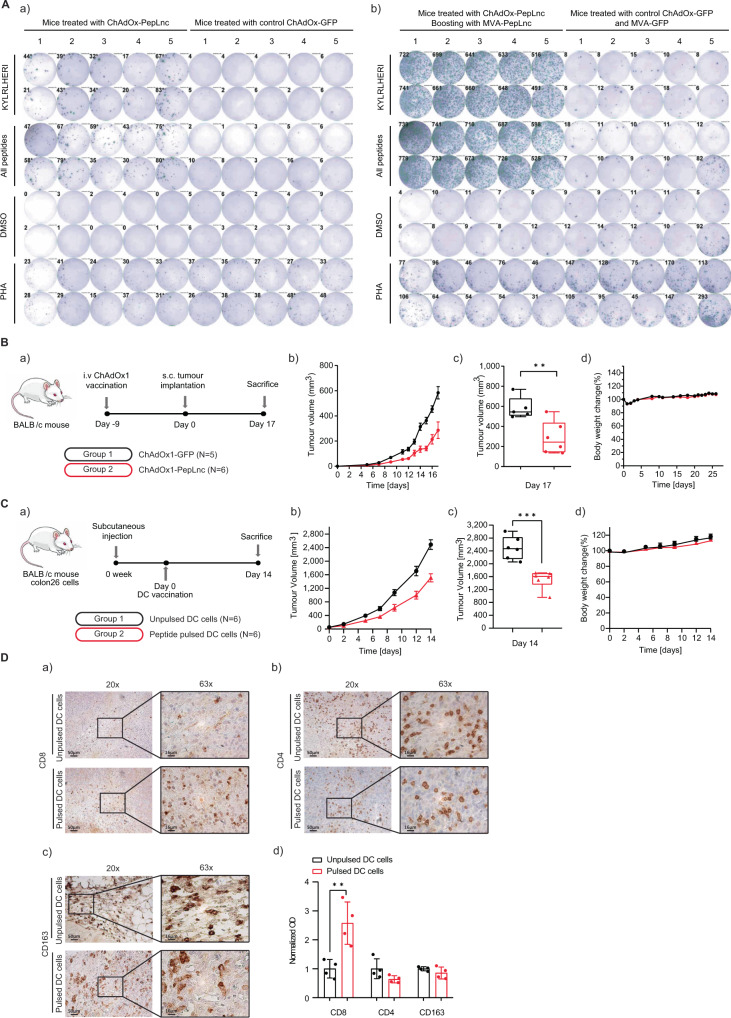
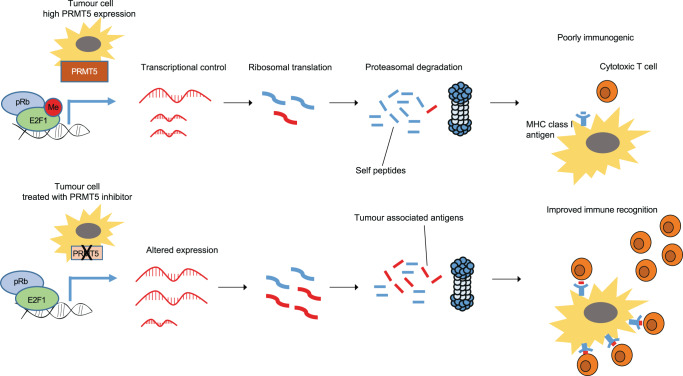
Protein arginine methyltransferase (PRMT) 5 is over-expressed in a variety of cancers and the master transcription regulator E2F1 is an important methylation target. We have explored the role of PRMT5 and E2F1 in regulating the non-coding genome and report here a striking effect on long non-coding (lnc) RNA gene expression. Moreover, many MHC class I protein-associated peptides were derived from small open reading frames in the lncRNA genes. Pharmacological inhibition of PRMT5 or adjusting E2F1 levels qualitatively altered the repertoire of lncRNA-derived peptide antigens displayed by tumour cells. When presented to the immune system as either ex vivo-loaded dendritic cells or expressed from a viral vector, lncRNA-derived peptides drove a potent antigen-specific CD8 T lymphocyte response, which translated into a significant delay in tumour growth. Thus, lncRNA genes encode immunogenic peptides that can be deployed as a cancer vaccine.


Conflict of interest statement

The authors declare no conflict of interests.

Figures

Fig. 1
Fig. 1. Differential expression analysis of lncRNA transcripts in CT26 cells and mouse tumours.
A (a) Differential expression changes in lncRNA transcripts in T1-44 treated CT26 (q < 0.05) cells with respect to DMSO treatment. Transcript Per Million (TPM) expression values were normalised to the mean. Yellow, up-regulation; blue, down-regulation; ivory, minimal change. Expression data was derived from three independent experiments (each with one technical sample). (b) As above, but displaying differential expression in lncRNA transcripts in T1-44-treated colon26 tumours (p < 0.05) with respect to control. Expression data were derived from tumours collected from three mice (from one experiment). B Percentage of lncRNA genes differentially regulated at a statistically significant level in CT26 cells (left) or Colon26 tumours (right) that score as potential direct E2F1 target genes, or are associated with other potential E2F1 target genes. C RT-qPCR analysis of CT26 cells transfected with E2F1 siRNAs and treated with 1 µM T1-44 (indicated lncRNA transcripts are labelled with their ENSEMBL transcript name). An immunoblot to display input protein levels is included. SDMe was used as a marker for T1-44 activity; n = 3 independent experiments (each with three technical replicates). Results are mean values ± SD; one-way ANOVA with Tukey’s multiple comparisons test; * adjusted P value < 0.05, ** adjusted P value < 0.01, *** adjusted P value <0.001. D (a) Colon26-bearing BALB/c mice received T1-44 orally at 100 mg/kg for 19 days with respect to vehicle only control; n = 7 mice per group; experiment was performed twice; (b) Absolute tumour volume presented as a mean ± SEM, n = 7. (c) Absolute tumour volume of individual mice at day 12 (two-tailed Student’s t test; * p  =  0.0143), n = 7; box and whiskers are defined as minimum, first quartile, median, third quartile, and maximum of data. (d) Relative body weight presented as a mean value ± SEM, n = 7. E Immunohistochemical staining of SDMe (a), anti-CD8 (b), anti-CD4 (c), or anti-CD163 (d) in Colon26 tumours collected at 19 days post treatment with T1-44, or at day 14 from non-treated controls. Original magnification: 20×, scale bar, 50 μm; and 63×; scale bar, 16 μm. n = 4 mice from Fig. 1D; (e) Optical density is presented as mean ± SD; two-tailed Student’s t test; n = 4 independent experiments (each performed on two separate slides); *** adjusted P value <0.001.
Fig. 2
Fig. 2. Immunopeptidomics analysis of CT26 cells.
A Workflow of the immunopeptidomics platform. B Peptide length of each murine lncRNA-derived peptide is displayed as pie chart. 195 quantifiable peptides in total (pooled from two independent experiments) were detected (data derived from an immunopeptidomics experiment performed in biological independent replicate. C Immunopeptidomics analysis in T1-44 treated (1 µM for 72 h) or DMSO treated CT26 cells. The experiment was performed in biological replicate (rep1, rep2). Indicated is the overlap of MHC-bound lncRNA-derived peptides identified from the qualitative immunopeptidomics analysis. 328 peptides were detected. D (a) Sequence logos of amino acid conservation in lncRNA-derived peptides for each of the indicated MHC alleles; (b) Predicted MHC allele frequency for identified lncRNA-derived peptides are displayed, represented as a percentage of total. E Heatmap of lncRNA derived peptide abundance from the quantitative immunopeptidomics analysis (195 peptides) (both up- and down-regulated in T1-44 treatment with respect to DMSO). Relative abundance values were converted by normalisation to the mean. Yellow colour represents up-regulation, whilst blue colour represents down-regulation. Ivory colour represents no change in abundance. n = 2 independent experiments (each with two technical replicates); F The percentage of lncRNA genes giving rise to MHC class I bound peptides that score as potential direct E2F1 target genes or are associated with other potential E2F1 target genes. The analysis was performed on all unique peptide coding lncRNA genes identified in our immunopeptidomics analyses. G Part of the Gm37283, Gm17173, and Gm37494 lncRNA transcripts are displayed, with the predicted ORF (shown in red) giving rise to the identified MHC class I bound peptide (boxed in black). Potential start methionine residues are highlighted in red text. H (a) Example polysome profiling assay from CT26 cells, indicating total RNA quantity detected in each collected fraction (by absorbance reading at 254 nm). (b) Polysome profiling assay for Gm37494 is displayed. Data are presented as percentage of total RNA in each fraction; n = 3 independent experiments (each with three technical replicates).
Fig. 3
Fig. 3. Differential expression analysis of lncRNA transcripts present in HCT116 cells.
A Differential expression changes in lncRNA transcripts (q < 0.05) in WT E2F1 and E2F1Cr cells treated with T1-44 for 48 h, with respect to WT E2F1 DMSO treatment. Transcript Per Million (TPM) expression values were converted by normalisation to the mean. Yellow colour represents up-regulation, whilst blue colour represents down-regulation. Ivory colour represents minimal change. Expression data were derived from three independent experiments. B Percentage of lncRNA genes differentially regulated at a statistically significant level (q < 0.05) in HCT116 cells that score as potential direct E2F1 target genes or are associated with other potential E2F1 target genes. C (a) WT E2F1 and two separate E2F1 Cr cell line clones were treated with 1 µM T1-44 for 48 h prior to RT-qPCR analysis to determine the expression of the indicated lncRNA transcripts (labelled with their ENSEMBL transcript name). n = 4 biologically independent experiments (each performed in technical triplicate), results presented as mean values ± SD; one-way ANOVA with Tukey’s multiple comparisons tests and * adjusted P value <0.05, ** adjusted P value <0.01, *** adjusted P value <0.001, **** adjusted P value <0.0001; (b) An immunoblot to display input protein levels. SDMe was used as a marker for T1-44 activity.
Fig. 4
Fig. 4. Immunopeptidomic analysis of HCT116 cells.
A Immunopeptidomics analysis in T1-44 (1 µM for 48 h) or DMSO-treated HCT116 cells. The experiment was performed in biological duplicate. Indicated is the overlap of MHC-bound lncRNA-derived peptides identified from the qualitative analysis. 55 peptides were identified. B Peptide length of each human lncRNA-derived peptide is displayed as pie chart. 76 quantifiable peptides in total (pooled from two independent experiments) were detected (data derived from an immunopeptidomics experiment performed in biological independent replicate, each with 2 technical replicates. C (a) Sequence logos of amino acid conservation in lncRNA-derived peptides for each MHC allele; b) Predicted MHC allele frequency for identified lncRNA-derived peptides is displayed as a percentage of total. D Heatmap of lncRNA-derived peptide abundance from the quantitative immunopeptidomics analysis (76 peptides) (both up- and down-regulated in T1-44 treatment vs. DMSO). Relative abundance values were converted by normalisation to the mean. Yellow, up-regulation; blue, down-regulation; ivory, no change in abundance. n = 2 independent experiments (each with two technical replicates); E The percentage of lncRNA genes giving rise to MHC class I-bound peptides that score as potential direct E2F1 target genes, or are associated with other potential E2F1 target genes. Analysis was performed on all unique peptide-coding lncRNA genes identified. F (a) Example polysome profiling assay from HCT116 cells, indicating total RNA quantity detected in each collected fraction. (b) Polysome profiling assays for MALAT1 and AC079135.1 lncRNAs are displayed. Data are presented as percentage of total RNA in each fraction; n = 3 independent experiments (each with three technical replicates); G (a) Diagram of lncRNA ORF cloning strategy. The predicted ORF and potential endogenous ribosome binding site were inserted in frame with a 3xFLAG tag. A ribosome binding site is not provided in the vector itself. (b) Part of the MALAT1 and AC079135.1 lncRNA transcripts are displayed, with the predicted ORF (shown in red) giving rise to the identified MHC class I-bound peptide (boxed in black). Potential start residues are highlighted in red text. (c) Immune-fluorescence of HCT116 cells transfected with MALAT1 and AC079135.1 ORF-Flag plasmids. n = 2 independent experiments (d) Transfected HCT116 cells analysed by immunoblot. n = 3 independent experiments.
Fig. 5
Fig. 5. LncRNA derived MHC class I peptides as cancer vaccines in a colon26 tumour model.
A Groups of 10 BALB/c mice were vaccinated with ChAdOx1-PepLnc adenoviral vectors expressing a poly-antigen cassette containing 20 lncRNA-derived peptides, or a control ChAdOx1-GFP adenoviral vector. At 9 days post vaccination, half the mice were sacrificed and their splenocytes collected for ELISpot assay (a). The other half received a booster vaccination 4 weeks later with MVA-PepLnc or MVA-GFP as indicated, for a further 9 days (b). Splenocytes were stimulated with the indicated peptide, or a pool of peptides contained within the poly-antigen cassette, and activity was measured in interferon-γ-based ELISpot. DMSO and PHA were used as negative and positive controls respectively; n = 2 independent experiments. B (a) BALB/c mice were vaccinated with ChAdOx1-PepLnc or ChAdOx1-GFP adenoviral vectors. At day 9, post-vaccination mice were challenged with CT26 cells; n = 5 ChAdOx1-GFP, n = 6 ChAdOx1-PepLnc. (b) Absolute tumour volume is presented as mean ± SEM, n = 5 ChAdOx1-GFP, n = 6 ChAdOx1-PepLnc; (c) Absolute tumour volume of individual mice at day 17 (two-tailed Student’s t test; ** p  =  0.0067), n = 5 ChAdOx1-GFP, n = 6 ChAdOx1-PepLnc; box and whiskers are defined as minimum, first quartile, median, third quartile, and maximum of data. (d) Relative body weight of BALB/c mice presented as a mean value, n = 5 ChAdOx1-GFP, n = 6 ChAdOx1-PepLnc. C (a) Colon26-bearing BALB/c mice were vaccinated with DCs pulsed with pools of 15 lncRNA derived peptides at Day 0. As a control, unpulsed dendritic cells were used; n = 6 mice per treatment. (b) Absolute tumour volume in BALB/c mice presented as mean ± SEM, n = 6 mice per treatment; (c) Absolute tumour volume of individual mice at day 12 (two-tailed Student’s t test; *** p  = 0.0004), n = 6 mice per treatment; box and whiskers are defined as minimum, first quartile, median, third quartile, and maximum of data. (d) Relative body weight of BALB/c mice presented as a mean value ± SEM, n = 6 mice per treatment. D Immunohistochemical staining of anti-CD8 (a), anti-CD4 (b), or anti-CD163 (c) in colon26 tumours at 14 days post vaccination with pulsed DCs (see Fig. 5C). Original magnification, 20x, scale bar, 50 μm; and 63x; scale bar, 16 μm. n = 4 independent experiments; d) Optical density is presented as mean ± SD; two-tailed Student’s t test; n = 4 independent experiments (each performed on two separate slides); ** adjusted P value < 0.01.
Fig. 6
Fig. 6. Model diagram to indicate regulation of lncRNA-derived antigen presentation by E2F1 and PRMT5.
It is proposed that PRMT5 enzyme activity and E2F1 transcriptional activity influences the expression of many lncRNAs, which are subsequently translated into polypeptides that can be processed to generate epitopes for presentation on MHC class I protein complexes. Pharmacological manipulation of PRMT5 activity with compound T1-44 results in altered expression of several lncRNA transcripts encoding immunogenic peptides. We propose that subsequent presentation of these immunogenic peptides by MHC class I complexes contributes to the increased immune cell infiltration of the tumour micro-environment observed.

Comment in

References

    1. Gebert LFR, MacRae IJ. Regulation of microRNA function in animals. Nat. Rev. Mol. Cell Biol. 2019;20:21–37. doi: 10.1038/s41580-018-0045-7. - DOI - PMC - PubMed
    1. Statello L, Guo CJ, Chen LL, Huarte M. Gene regulation by long non-coding RNAs and its biological functions (vol 22, pg 96, 2021) Nat. Rev. Mol. Cell Biol. 2021;22:159–159. doi: 10.1038/s41580-021-00330-4. - DOI - PMC - PubMed
    1. Ji P, et al. MALAT-1, a novel noncoding RNA, and thymosin beta4 predict metastasis and survival in early-stage non-small cell lung cancer. Oncogene. 2003;22:8031–8041. doi: 10.1038/sj.onc.1206928. - DOI - PubMed
    1. Gutschner T, et al. The noncoding RNA MALAT1 is a critical regulator of the metastasis phenotype of lung cancer cells. Cancer Res. 2013;73:1180–1189. doi: 10.1158/0008-5472.CAN-12-2850. - DOI - PMC - PubMed
    1. Wang ZW, et al. High expression of long non-coding RNA MALAT1 in breast cancer is associated with poor relapse-free survival. Breast Cancer Res. Treat. 2018;171:261–271. doi: 10.1007/s10549-018-4839-2. - DOI - PMC - PubMed

Publication types

MeSH terms