. 2023 Feb 25;14(1):1098.
doi: 10.1038/s41467-023-36681-z.

Intra-pituitary follicle-stimulating hormone signaling regulates hepatic lipid metabolism in mice

Affiliations

Intra-pituitary follicle-stimulating hormone signaling regulates hepatic lipid metabolism in mice

Sen Qiao et al. Nat Commun. .

Abstract

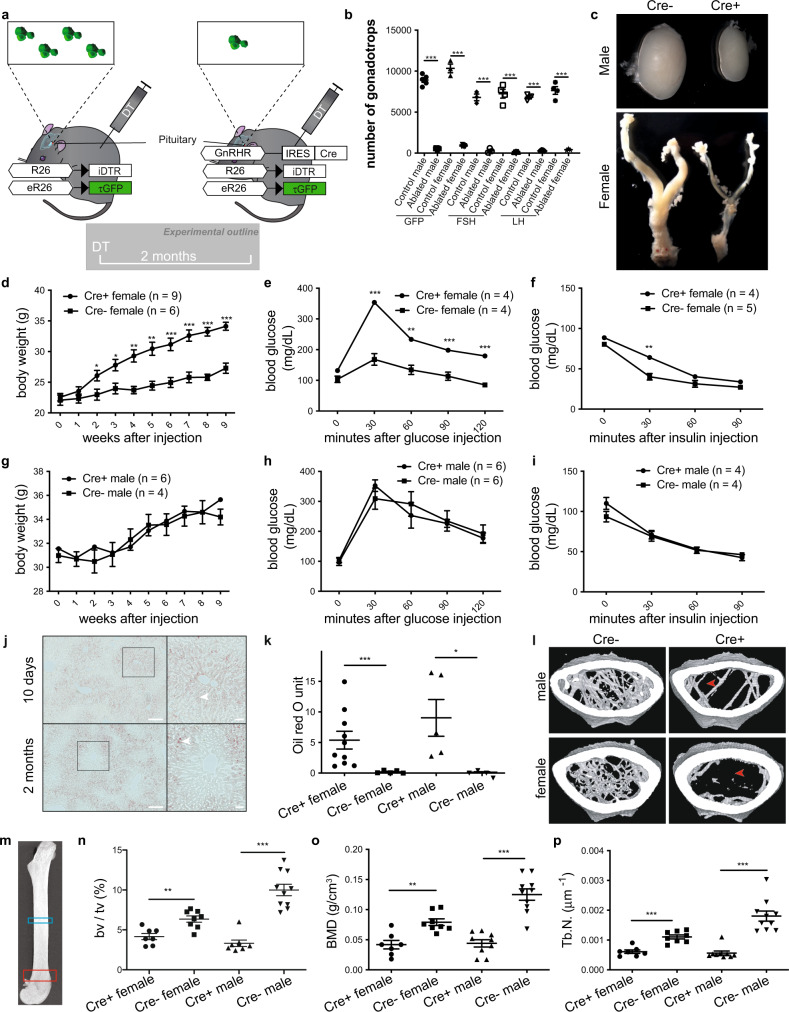
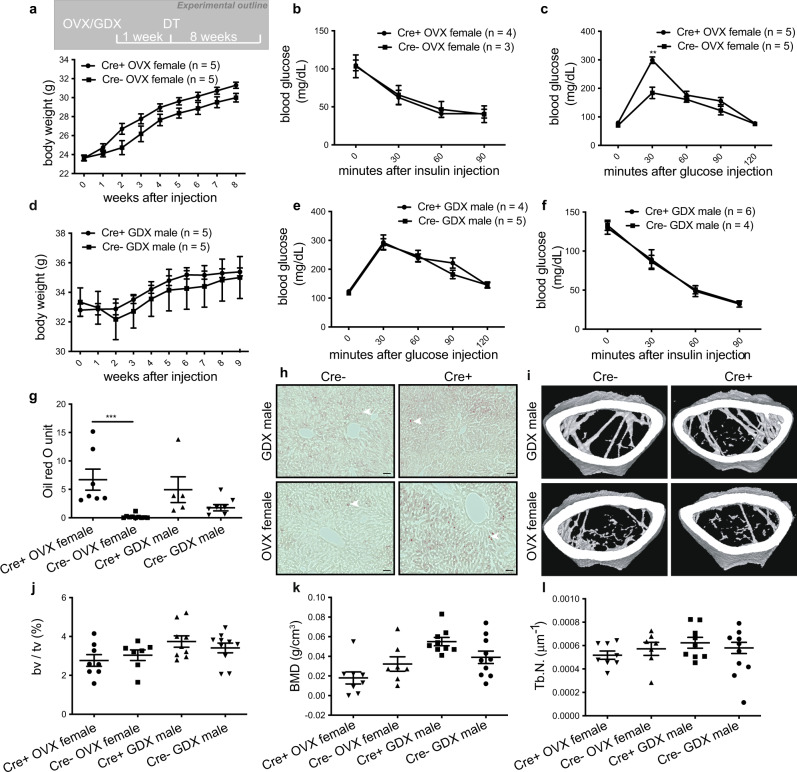
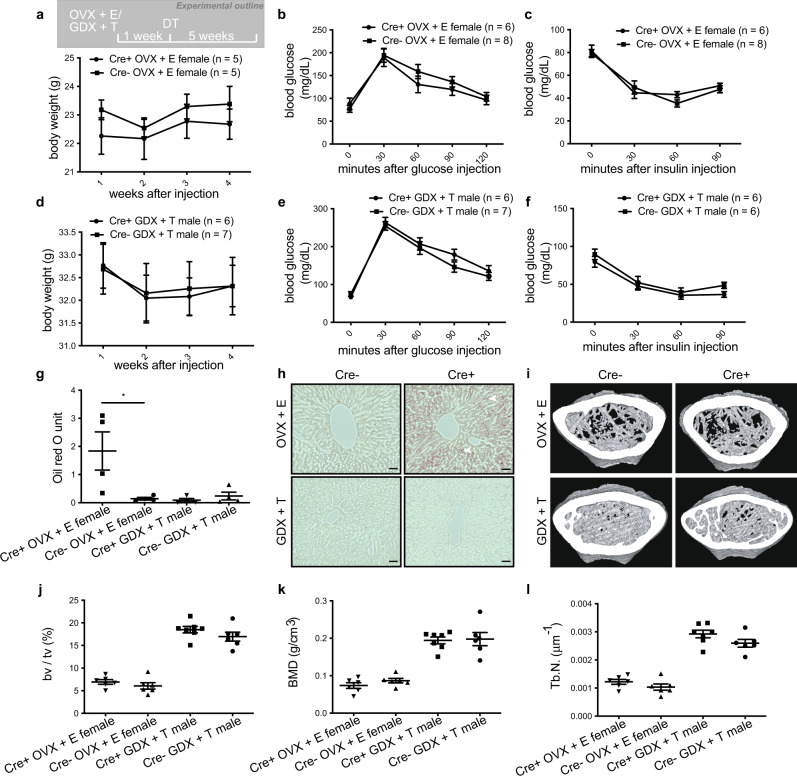
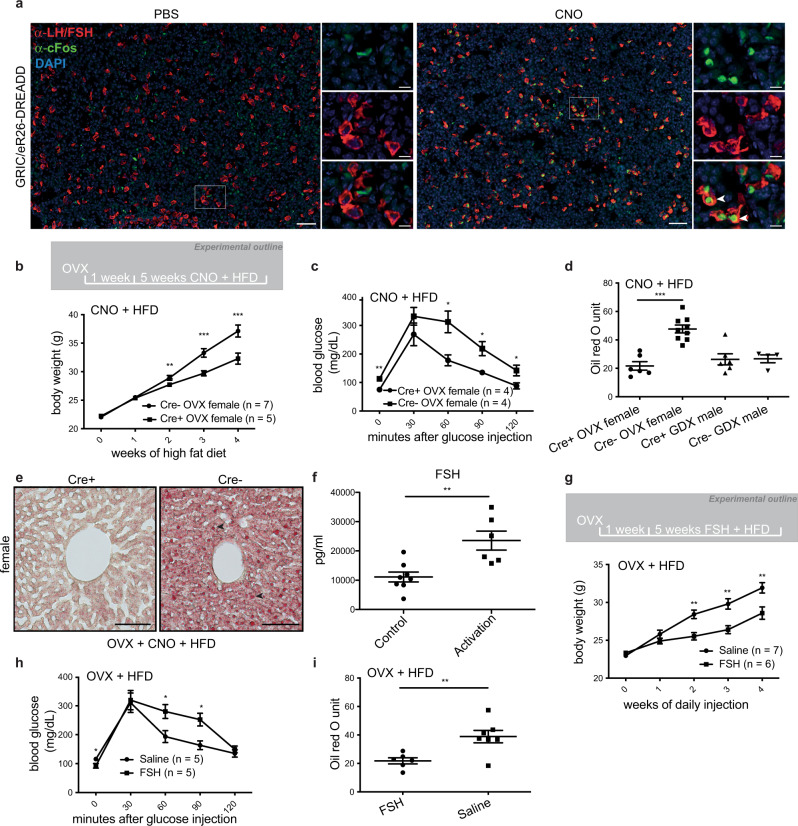
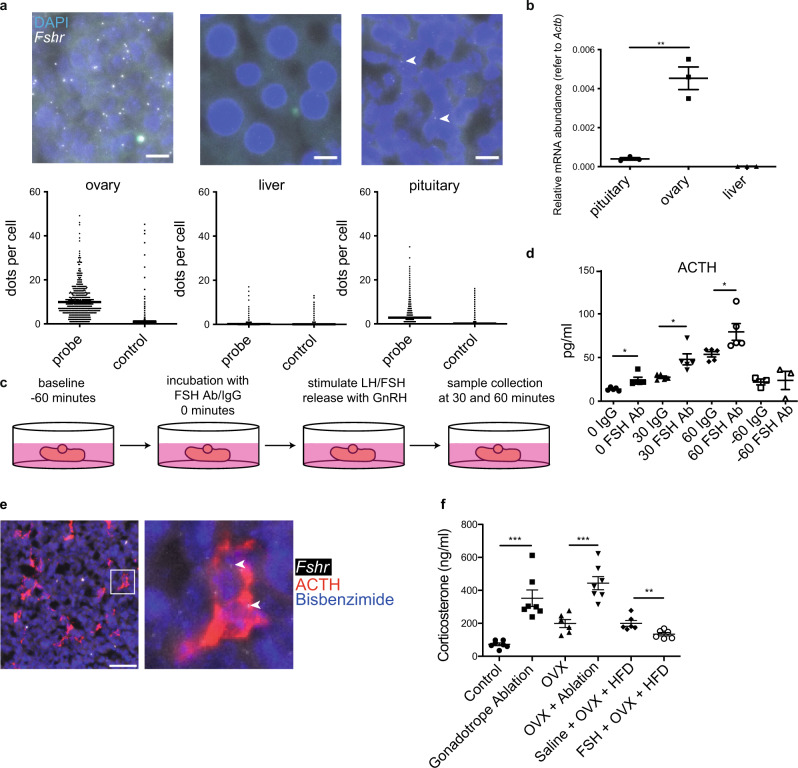
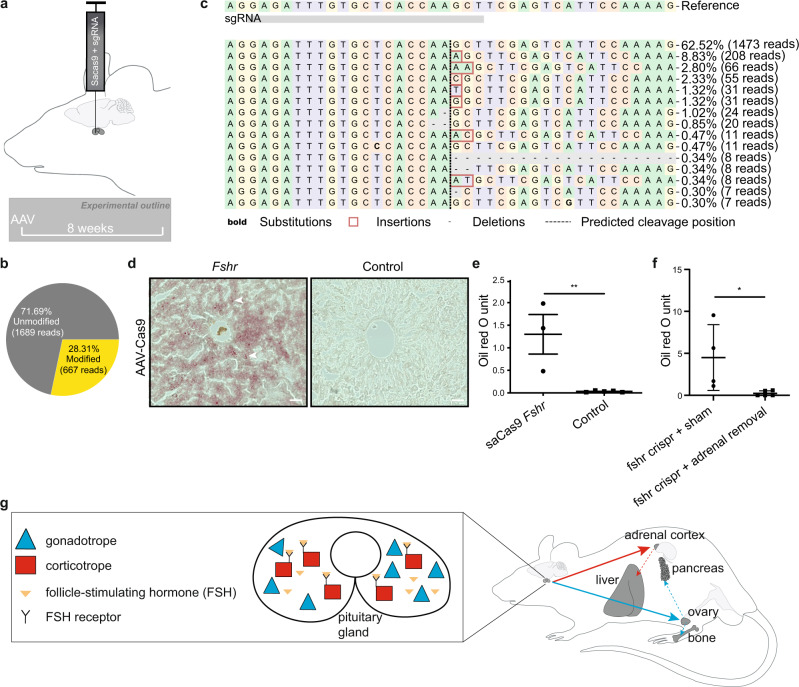
Inter-organ communication is a major hallmark of health and is often orchestrated by hormones released by the anterior pituitary gland. Pituitary gonadotropes secrete follicle-stimulating hormone (FSH) and luteinizing hormone (LH) to regulate gonadal function and control fertility. Whether FSH and LH also act on organs other than the gonads is debated. Here, we find that gonadotrope depletion in adult female mice triggers profound hypogonadism, obesity, glucose intolerance, fatty liver, and bone loss. The absence of sex steroids precipitates these phenotypes, with the notable exception of fatty liver, which results from ovary-independent actions of FSH. We uncover paracrine FSH action on pituitary corticotropes as a mechanism to restrain the production of corticosterone and prevent hepatic steatosis. Our data demonstrate that functional communication of two distinct hormone-secreting cell populations in the pituitary regulates hepatic lipid metabolism.


Conflict of interest statement

The authors declare no competing interests.

Figures

Fig. 1
Fig. 1. Acute gonadotrope ablation induces metabolic disorders in female mice.
a Illustration depicting the strategy to acutely ablate gonadotropes via the injection of diphtheria toxin (DT) in mice selectively expressing the diphtheria toxin receptor in gonadotropes. b Number of GFP-positive cells within the pituitaries of DT- or saline-injected GRIC/R26-iDTR/eR26-τGFP mice and a number of follicle-stimulating hormone (FSH) or luteinizing hormone (LH) positive cells within the pituitaries of DT-injected Cre+ and Cre− (control) GRIC/R26-iDTR/eR26-τGFP mice. c Representative images of testes and female reproductive tracts from Cre+ and Cre− (control) GRIC/R26-iDTR/eR26-τGFP mice 2 months after DT injection. Body weight (d, g), glucose tolerance (e, h), insulin tolerance (f, i), and liver oil red O staining quantification (k) from gonadotrope-ablated (Cre+) and control (Cre−) female and male mice. j Representative images of liver oil red O staining from Cre+ GRIC/R26-iDTR/eR26-τGFP female mice 10 days or 2 months after DT injection (scale bars = 200 μm. Insets highlight the distribution of lipid droplets (filled arrowheads)). l Representative micro-computed tomography (μCT) images from gonadotrope-ablated (Cre+) and control (Cre−) female and male mice (filled arrowheads indicate lack of trabecular bone). m Anatomic sites for μCT bone measurements are indicated as blue (cortical bone) and red (trabecular bone) rectangles. Fractional bone volume (n), bone mineral density (o), and trabecular number (p) of trabecular bone from gonadotrope-ablated (Cre+) and control (Cre−) female and male mice. Error bars represent standard error mean. * = P < 0.05, ** = P < 0.01 and *** = P < 0.001. For statistical details, including individual p-values, see Supplementary Data 1. Source data are provided as a Source Data file.
Fig. 2
Fig. 2. Gonadal loss in females mimics metabolic syndrome but does not trigger hepatic steatosis.
a, d Body weight, glucose tolerance (b, e), insulin tolerance (c, f), and liver oil red O staining quantification (g) and representative images (h scale bars = 50 μm, filled arrowheads indicate lipid droplets.) in gonadotrope-ablated (Cre+) and control (Cre−) ovariectomized (OVX) female and gonadectomized (GDX) male mice. Representative μCT images (i), fractional bone volume (j), bone mineral density (k), and trabecular number (l) of trabecular bone from gonadotrope-ablated (Cre+) and control (Cre−) ovariectomized (OVX) female and gonadectomized (GDX) male mice. Error bars represent the standard error of the mean. ** = P < 0.01 and *** = P < 0.001. For statistical details, including individual p-values, see Supplementary Data 1. Source data are provided as a Source Data file.
Fig. 3
Fig. 3. Sex-steroid replacement abolishes metabolic disorders but does not improve hepatic steatosis in gonadotrope-ablated female mice.
a, d Body weight (a, d), glucose tolerance (b, e), insulin tolerance (c, f), and liver oil red O staining quantification (g) and representative images (h; scale bars = 50 μm, filled arrowheads indicate lipid droplets.) in gonadotrope-ablated (Cre+) and control (Cre−) ovariectomized (OVX) female and gonadectomized (GDX) male mice with estradiol (E) or testosterone (T) replacement, respectively. Representative μCT images (i), fractional bone volume (j), bone mineral density (k), and trabecular number (l) of trabecular bone from gonadotrope-ablated (Cre+) and control (Cre−) ovariectomized (OVX) female and gonadectomized (GDX) male mice with estradiol (E) or testosterone (T) replacement, respectively. Error bars represent standard error mean. * = P < 0.05. For statistical details, including individual p-values, see Supplementary Data 1. Source data are provided as a Source Data file.
Fig. 4
Fig. 4. Gonadotrope activation or FSH administration is sufficient to improve metabolic disorders including hepatic steatosis in female mice.
a Representative images of pituitaries from PBS (left) and clozapine-N-oxide (right) i.p. injected GRIC/eR26-DREADD mice. The expression of cFos (shown in green) was used as a marker for cellular activation. Gonadotropes are shown in red, corresponding to the expression of LH and FSH. DAPI is shown in blue (scale bars = 50 μm in full-size images, 20 μm in insets, and filled arrowheads indicate activated gonadotropes.). b Body weight, c glucose tolerance, d liver oil red O staining quantification, and e representative images (scale bars = 100 μm, filled arrowheads indicate lipid droplets) in clozapine-N-oxide (CNO) treated Cre+ (chemogenetically-activated) and Cre− (control) gonadectomized mice on a high-fat diet (HFD). f Plasma FSH levels from CNO-injected Cre+ (chemogenetically activated) and Cre− (control) OVX mice on HFD. g Body weight, h glucose tolerance, and i liver oil red O staining quantification in FSH-treated and saline-treated OVX mice on HFD. Error bars represent standard error mean. * = P < 0.05, ** = P < 0.01 and *** = P < 0.001. For statistical details, including individual P-values, see Supplementary Data 1. Source data are provided as a Source Data file.
Fig. 5
Fig. 5. Paracrine FSH action in pituitary corticotropes in female mice.
a Expression levels of Fshr in the pituitary, ovary and liver from adult female mice were measured using RNA scope (scale bars = 10 μm, filled arrowheads indicate positive signals) and b RT-qPCR. c Schematic representation of in vitro pituitary assay. d ACTH levels quantified from in vitro GnRH-stimulated pituitaries incubated with an anti-FSH antibody or IgG (control). e Colocalization of Fshr mRNA (RNAscope, filled arrowhead) and ACTH (IF) (scale bar = 100 μm). f Plasma corticosterone levels from control and experimental female mice. Error bars represent the standard error of the mean. * = P < 0.05, ** = P < 0.01 and *** = P < 0.001. For statistical details, including individual P-values, see Supplementary Data 1. Source data are provided as a Source Data file.
Fig. 6
Fig. 6. FSH receptor knock-out in the pituitary induces hepatic steatosis in females.
a Illustration depicting the strategy to specifically disrupt FSH receptor expression in the pituitary via stereotaxic delivery of an adeno-associated virus (AAV) encoding Cas9 and a guide RNA targeting Fshr into the pituitary. b Percentage of unmodified and modified alleles and c distribution of identified alleles around the predicted cleavage site determined by CRISPResso2 of the pituitary DNA from an AAV5-saCas9-Fshr injected mouse. d Representative images (scale bars = 50 μm) and e quantification of liver oil red O staining from AAV-Cas9 (with (n = 3 mice) or without (n = 5 mice) guide RNA against follicle-stimulating hormone receptor; Fshr) pituitary-injected mice. f Liver oil red O staining quantification in AAV-Cas9 (with guide RNA against follicle-stimulating hormone receptor; Fshr) pituitary-injected adrenalectomized or sham-operated female mice. g Model of gonadotrope actions on the gonads and the pituitary (filled blue arrow illustrates gonadotrope actions on the gonads; dashed blue arrows indicate indirect gonadotrope effects on pancreas and bone via sex steroids released by the gonads; filled red arrow indicates corticotrope action on the adrenal cortex (via paracrine FSH intra-pituitary action); dashed red arrow indicates the effect of elevated corticosterone levels on the liver). Error bars represent the standard error of the mean. ** = P < 0.01. For statistical details, including individual P-values, see Supplementary Data 1. Source data are provided as a Source Data file.

References

    1. Friesen H, Astwood EB. Hormones of the anterior pituitary body. N. Engl. J. Med. 1965;272:1328–1335. doi: 10.1056/NEJM196506242722506. - DOI - PubMed
    1. Dingman JF. Pituitary function. N. Engl. J. Med. 1971;285:617–619. doi: 10.1056/NEJM197109092851107. - DOI - PubMed
    1. Hodson DJ, Molino F, Fontanaud P, Bonnefont X, Mollard P. Investigating and modelling pituitary endocrine network function. J. Neuroendocrinol. 2010;22:1217–1225. doi: 10.1111/j.1365-2826.2010.02052.x. - DOI - PubMed
    1. Le Tissier P, et al. An updated view of hypothalamic-vascular-pituitary unit function and plasticity. Nat. Rev. Endocrinol. 2017;13:257–267. doi: 10.1038/nrendo.2016.193. - DOI - PubMed
    1. Gromada J, Chabosseau P, Rutter GA. The alpha-cell in diabetes mellitus. Nat. Rev. Endocrinol. 2018;14:694–704. doi: 10.1038/s41574-018-0097-y. - DOI - PubMed

Publication types

Substances