. 2023 Feb 25;14(1):1077.
doi: 10.1038/s41467-023-36765-w.

Membrane phospholipids control gating of the mechanosensitive potassium leak channel TREK1

Affiliations

Membrane phospholipids control gating of the mechanosensitive potassium leak channel TREK1

Philipp A M Schmidpeter et al. Nat Commun. .

Abstract

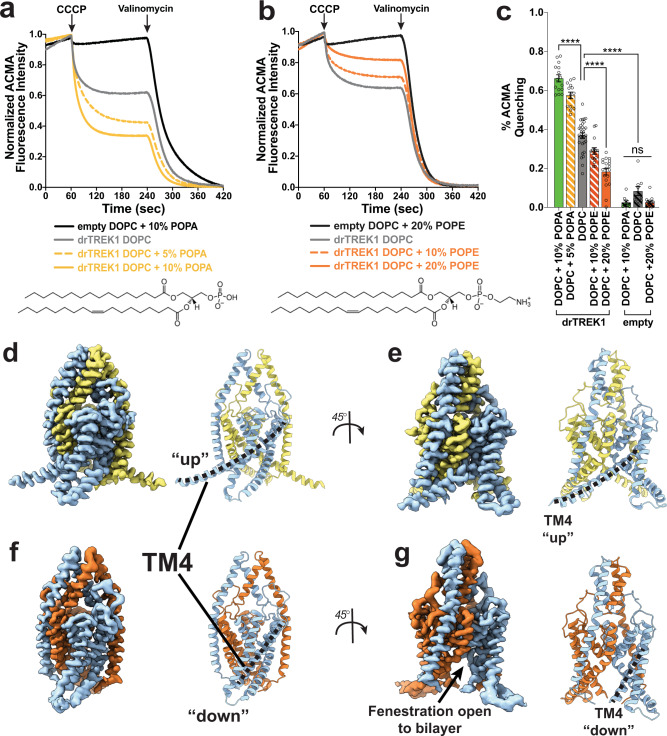
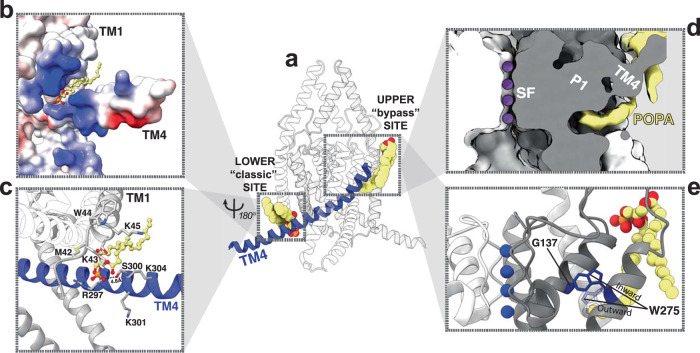
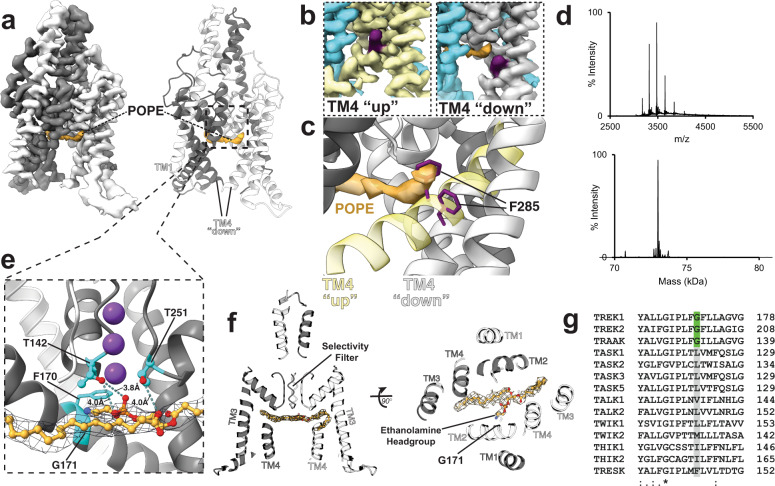
Tandem pore domain (K2P) potassium channels modulate resting membrane potentials and shape cellular excitability. For the mechanosensitive subfamily of K2Ps, the composition of phospholipids within the bilayer strongly influences channel activity. To examine the molecular details of K2P lipid modulation, we solved cryo-EM structures of the TREK1 K2P channel bound to either the anionic lipid phosphatidic acid (PA) or the zwitterionic lipid phosphatidylethanolamine (PE). At the extracellular face of TREK1, a PA lipid inserts its hydrocarbon tail into a pocket behind the selectivity filter, causing a structural rearrangement that recapitulates mutations and pharmacology known to activate TREK1. At the cytoplasmic face, PA and PE lipids compete to modulate the conformation of the TREK1 TM4 gating helix. Our findings demonstrate two distinct pathways by which anionic lipids enhance TREK1 activity and provide a framework for a model that integrates lipid gating with the effects of other mechanosensitive K2P modulators.


Conflict of interest statement

The authors declare no competing interests.

Figures

Fig. 1
Fig. 1. Subunit asymmetry in the TREK1 apo cryo-EM structure.
a Cryo-EM density map of the apo state of the TREK1 channel and b a structural model of the channel, with the potassium ion selectivity filter (SF), extracellular cap domain, and four transmembrane domains labeled. c A superposition of the two apo TREK1 subunits, showing asymmetric positioning of TM4a (blue) relative to TM4b (purple), due to an 11° tilt in the distal portion of TM4. Transparent views of the TREK1 cryo-EM density map d side view and e bottom view, with density outside of the TREK1 map near the TM4b helix highlighted (pink). Magnified views (f), showing that this central density occludes the pore, sterically prevents TM4b from moving into the “up” state, and can be well modeled by a molecule of DDM (also shown in Supplementary Fig. 4). DDM density derived from the final unsharpened TREK1 apo map, visualized at a contour threshold of 0.0065 (g). Native mass spectrum of TREK1 dimer (20+ charge state is labeled), with deconvoluted spectrum (h), showing no evidence of phospholipid bound to TREK1.
Fig. 2
Fig. 2. Functional and structural effects of phospholipids on the TREK1 channel.
ACMA fluorescence quenching assays to study the function of purified TREK1 protein in varied lipid compositions (ac). Quenching was initiated by the addition of the proton ionophore CCCP and allowed to proceed to completion by the addition of the potassium ionophore valinomycin. Signals were normalized to the final baseline value prior to the addition of CCCP (time t = 59 s) and the final fluorescence value in the tracings (time t = 420 s). Averaged composite traces of all quenching reaction measurements are shown in (a) and (b), with liposome compositions indicated. TREK1-dependent ACMA quenching was measured as (1 - Normalized ACMA fluorescence intensity at time t = 239 s) and is shown in (c). Data values for all individual measurements are shown and bars represent mean ± SEM. For all conditions, n = 11–31 independent measurements derived from 2–7 separate proteoliposome reconstitutions. Source data are available as a source data file. Statistical analysis was performed by one-way ANOVA with a Dunnett’s multiple comparison test with results indicated, ns not significant, ****p < 0.0005. df Cryo-EM density maps and matching structural models of TREK1 channels in DDM micelles supplemented with POPA (d, e) or POPE (f, g). In the POPA structure, both TM4 are in the “up” conformation (d) and the membrane facing fenestration is closed (e). In the presence of POPE, both TM4 are in the “down” conformation (f) and the membrane facing fenestration is open (g).
Fig. 3
Fig. 3. Identification of POPA lipid binding sites in the TREK1 channel structure.
Cryo-EM density map of TREK1 solubilized in DDM detergent supplemented with POPA lipids (a), highlighting locations of bound POPA molecules (yellow). (b) Native mass spectrum of TREK1 dimer with POPA (left), and deconvoluted spectrum (right) showing multiple peaks corresponding to TREK1 dimer with up to eight bound POPA molecules (numbers above peaks indicate the number of bound POPA). Under more activating MS conditions (c), the number of bound POPA lipids is reduced to four, suggestive of two relatively higher affinity binding sites per subunit in the TREK1 dimer. d, e Zoomed-in views of two POPA binding sites identified in the cryo-EM density map where the POPA lipid interacts with the core of the TREK1 protein. Visualized lipid densities are derived from the final unsharpened C2 symmetrized TREK1 POPA map, visualized at a contour threshold of 0.0086.
Fig. 4
Fig. 4. Molecular details of the POPA lipids binding sites.
The upper and lower POPA binding sites identified in the cryo-EM density map flank the TM4 helix (a). At the lower site (b, c), the well-resolved POPA headgroup sits in a groove between TM1 and TM4. A coulombic potential surface representation of the lower site (b) with a molecular representation shown in (c), demonstrates the strong electropositive nature of the lower binding site. At the upper site (d, e), the cryo-EM density for a lipid acyl tail can be seen inserting itself underneath TM4 to sit behind the selectivity filter pore helices. A molecular representation of this lipid binding site (e) shows that the lipid tail displaces the W275 residue from its outward-facing position in the TM4 down state (transparent) to an inward-facing orientation, bringing W275 close to the G137 residue.
Fig. 5
Fig. 5. Headfirst pore block by POPE lipids.
Cryo-EM map and matching structural model of TREK1 in DDM supplemented with POPE (a), highlighting the location of a single POPE lipid (orange) bound within the pore. The lipid density shown is derived from the sharpened map of the final refinement before C2 symmetry was applied, visualized at a contour threshold of 0.0402. A zoomed-in representation of the POPE binding site (b), highlighting the movement of the TM4 F285 residue (purple) when the POPE acyl chain tail occupies the pore site to shift TM4 from the “up” conformation (yellow, left panel) to the TM4 “down” conformation (white, right panel). Overlaying these two structural models (c) shows how the POPE molecule and the TM4 F285 residue would overlap if TM4 remained in the “up” conformation in the presence of POPE. d Native mass spectrum of TREK1 dimer with POPE (upper panel), and deconvoluted spectrum (lower panel), showing no POPE bound to TREK1. e A zoomed-in view of the interactions between the POPE headgroup and the TREK1 pore. f A structural model of TREK1 with the cryo-EM density of the POPE lipid shown in mesh, highlighting the position of the two lipid tails and the ethanolamine headgroup of the lipid. Each of the lipid tails are directed toward opposing fenestrations, and the position of TREK1 G171 is noted. g Sequence alignment of the TM2 helix from all human K2P channels, highlighting the alignment at the TREK1 G171 position.
Fig. 6
Fig. 6. An integrated model of TREK1 lower pore gating.
Comparison of the POPA and POPE bound TREK1 structures. In the POPA structure (a), the lipid pathway is closed, with no lipid occluding the ion-conducting pore and positively charged residues (blue) in the distal end of TM4 enveloping the anionic POPA headgroup. In the POPE structure (b), hydrophobic residues (green) on TM2, TM3, TM4, and pore helix 2 line the open lipid pathway. c A cartoon schematic describing the proposed integrated model of lower pore gating in TREK1 channels. In the leftmost panel, iso represents the binding site position of the volatile anesthetic isoflurane.

Similar articles

Cited by

References

    1. Plant LD. A role for K2P channels in the operation of somatosensory nociceptors. Front. Mol. Neurosci. 2012;5:21. doi: 10.3389/fnmol.2012.00021. - DOI - PMC - PubMed
    1. Honore E. The neuronal background K2P channels: focus on TREK1. Nat. Rev. Neurosci. 2007;8:251–261. doi: 10.1038/nrn2117. - DOI - PubMed
    1. Heurteaux C, et al. TREK-1, a K+ channel involved in neuroprotection and general anesthesia. EMBO J. 2004;23:2684–2695. doi: 10.1038/sj.emboj.7600234. - DOI - PMC - PubMed
    1. Enyedi P, Czirjak G. Molecular background of leak K+ currents: two-pore domain potassium channels. Physiol. Rev. 2010;90:559–605. doi: 10.1152/physrev.00029.2009. - DOI - PubMed
    1. Lolicato M, Riegelhaupt PM, Arrigoni C, Clark KA, Minor DL., Jr Transmembrane helix straightening and buckling underlies activation of mechanosensitive and thermosensitive K(2P) channels. Neuron. 2014;84:1198–1212. doi: 10.1016/j.neuron.2014.11.017. - DOI - PMC - PubMed

Publication types

MeSH terms

LinkOut - more resources