. 2023 Feb 25;14(1):1074.
doi: 10.1038/s41467-023-36790-9.

A variational algorithm to detect the clonal copy number substructure of tumors from scRNA-seq data

Affiliations

A variational algorithm to detect the clonal copy number substructure of tumors from scRNA-seq data

Antonio De Falco et al. Nat Commun. .

Abstract

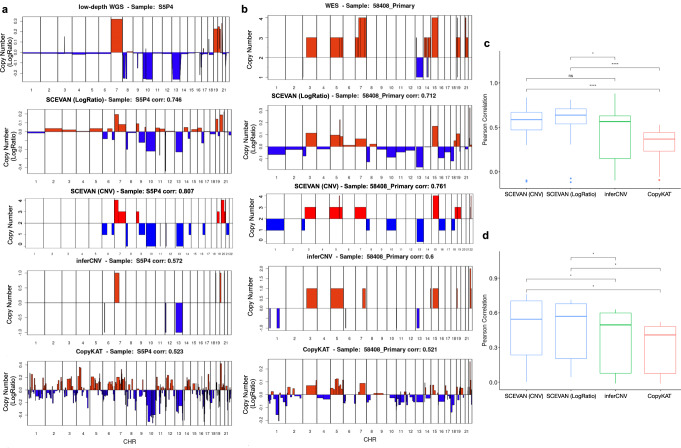
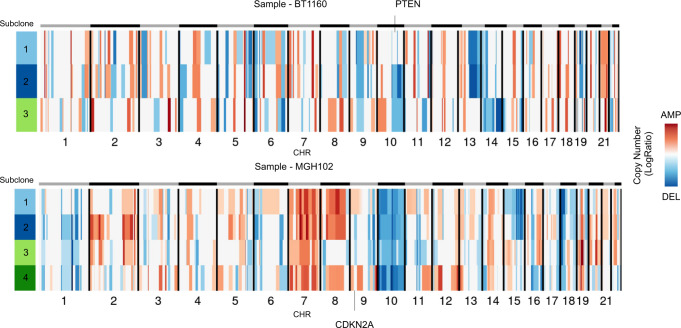
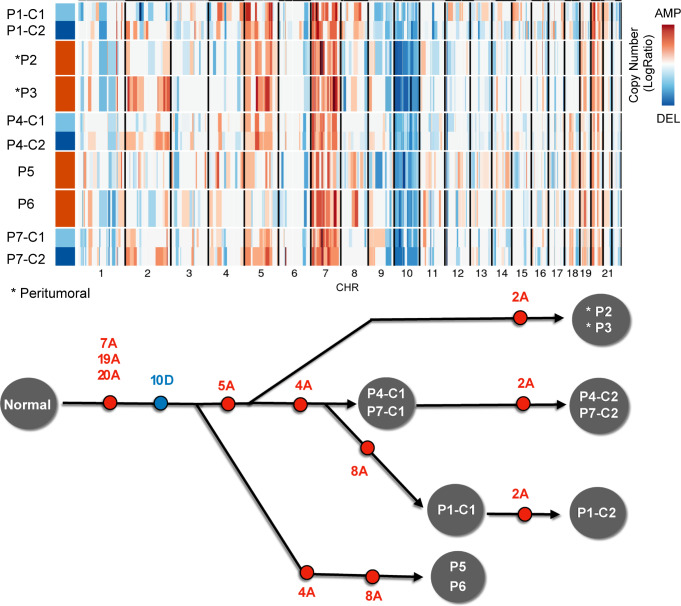
Single-cell RNA sequencing is the reference technology to characterize the composition of the tumor microenvironment and to study tumor heterogeneity at high resolution. Here we report Single CEll Variational ANeuploidy analysis (SCEVAN), a fast variational algorithm for the deconvolution of the clonal substructure of tumors from single-cell RNA-seq data. It uses a multichannel segmentation algorithm exploiting the assumption that all the cells in a given copy number clone share the same breakpoints. Thus, the smoothed expression profile of every individual cell constitutes part of the evidence of the copy number profile in each subclone. SCEVAN can automatically and accurately discriminate between malignant and non-malignant cells, resulting in a practical framework to analyze tumors and their microenvironment. We apply SCEVAN to datasets encompassing 106 samples and 93,322 cells from different tumor types and technologies. We demonstrate its application to characterize the intratumor heterogeneity and geographic evolution of malignant brain tumors.


Conflict of interest statement

A.I. received sponsored research funding from AstraZeneca and Taiho Pharmaceutical and has served as a paid consultant/advisor to AIMEDBIO. The remaining authors declare no competing interests.

Figures

Fig. 1
Fig. 1. SCEVAN Workflow.
SCEVAN starts from the raw count matrix removing irrelevant genes and cells. a Identification of a small set of highly confident normal cells. b Relative gene expression obtained from removal of the baseline inferred from confident normal cells. c Edge-preserving nonlinear diffusion filtering of relative gene expression. d Segmentation with a variational region-growing algorithm. e Identification of normal cells as those in the cluster containing the majority of confident normal cells. f Identification of possible subclones using Louvain clustering applied to a shared nearest-neighbor graph of the tumor cells. g Segmentation with a variational region-growing algorithm applied to each subclone. Segments are then classified in five copy number states. h Analysis of subclones including clone tree, pathway activities (GSEA was performed for each subclone using fgseaMultilevel which calculates P values based on an adaptive multilevel splitting Monte Carlo scheme), and characterization of shared and specific alterations.
Fig. 2
Fig. 2. Benchmark of malignant cell classification task.
F1 score obtained with SCEVAN and CopyKAT in the classification of malignant and non-malignant cells for each cancer type. Colorectal cancer n = 47,285 cells examined over 23 scRNA-seq independent experiments, Glioblastoma, , n = 40,320 cells examined over 63 scRNA-seq independent experiments, Head and Neck Squamous Cell Carcinomas n = 5717 cells examined over 20 scRNA-seq independent experiments (Supplementary Data 2). Source data are provided as a Source Data file.
Fig. 3
Fig. 3. Benchmark of inferred copy number profile.
a, b Copy number profile inferred with SCEVAN (segment mean (LogRatio) and CNV status), inferCNV, CopyKAT, the corresponding ground truth from low-depth WGS of sample S5P4 and from WES of sample 58408 Primary. c, d Boxplots show the median as center, the lower and upper hinges that correspond to the 25th and the 75th percentile, and whiskers that extend to the smallest and largest value no more than 1.5*IQR. Values that stray more than 1.5*IQR upwards or downwards from the whiskers are considered potential outliers and represented with dots. Significance was computed by a two-sided Wilcoxon signed-rank test (ns: P value > 0.05, *P value < = 0.05, ****P value <= 0.0001). c Pearson correlation between the copy number inferred with different methods and the ground truth from low-depth WGS for 26 samples. SCEVAN obtains a significantly higher correlation than CopyKAT (LogRatio P value 1.3e−05 and CNV status P value 3.0e−07) and inferCNV (LogRatio P value 0.02). d Pearson correlation with the ground truth from WES for seven samples. SCEVAN obtains a significantly higher correlation than CopyKAT (LogRatio and CNV status P value 0.016) and inferCNV (LogRatio P value 0.016 and CNV status P value 0.031). Source data are provided as a Source Data file.
Fig. 4
Fig. 4. Deconvolution of the clonal substructure.
a Clonal structure of sample BT1160 inferred by SCEVAN. b t-SNE plot of CNA matrix. c Inferred phylogenetic tree. d OncoPrint-like plot of BT1160 highlighting clone-specific alterations, shared alterations between, and clonal alterations. e GSEA was performed on REACTOME pathways for each subclone with a minimum size of 15 genes and a maximum size of 500 genes and with 10,000 as the number of permutations using the fgseaMultilevel function in the R package fgsea (v. 1.16), which calculates P values based on an adaptive multilevel splitting Monte Carlo scheme. f NES and −log10(P value) per cell of GBM cellular states computed by the Mann–Whitney–Wilcoxon single sample gene set test gene set implemented in the yaGST package. Source data are provided as a Source Data file.
Fig. 5
Fig. 5. Tumor suppressor genes in the clonal substructure.
Compact representation of clonal structure inferred with SCEVAN of scRNA-seq samples BT1160 and MGH102, in which the alterations containing tumor suppressor genes PTEN and CDKN2A are subclonal. Source data are provided as a Source Data file.
Fig. 6
Fig. 6. Temporal deconvolution of the clonal substructure.
Compact representation of clonal structure inferred with SCEVAN of multiregional scRNA-seq samples of patient GS1 and a phylogenetic tree deduced from clonal structure of the samples. Source data are provided as a Source Data file.
Fig. 7
Fig. 7. Clonal copy number comparison of matched primary and metastatic tumor.
Copy number profile of primary (P) and metastatic lymph nodes (L) from samples of Head and Neck cancer dataset (HNSCC5, HNSCC25,HNSCC26, HNSCC28). Source data are provided as a Source Data file.

References

    1. Angelova M, et al. Evolution of metastases in space and time under immune selection. Cell. 2018;175:751–765. doi: 10.1016/j.cell.2018.09.018. - DOI - PubMed
    1. Bedognetti D, et al. Toward a comprehensive view of cancer immune responsiveness: a synopsis from the sitc workshop. J. Immunother. Cancer. 2019;7:1–23. - PMC - PubMed
    1. Svensson V, Vento-Tormo R, Teichmann SA. Exponential scaling of single-cell RNA-seq in the past decade. Nat. Protoc. 2018;13:599–604. doi: 10.1038/nprot.2017.149. - DOI - PubMed
    1. Patel AP, et al. Single-cell RNA-seq highlights intratumoral heterogeneity in primary glioblastoma. Science. 2014;344:1396–1401. doi: 10.1126/science.1254257. - DOI - PMC - PubMed
    1. Garofano L, et al. Pathway-based classification of glioblastoma uncovers a mitochondrial subtype with therapeutic vulnerabilities. Nat. Cancer. 2021;2:141–156. doi: 10.1038/s43018-020-00159-4. - DOI - PMC - PubMed

Publication types