

Radiogenomic classification for MGMT promoter methylation status using multi-omics fused feature space for least invasive diagnosis through mpMRI scans
- PMID: 36841898
- PMCID: PMC9961309
- DOI: 10.1038/s41598-023-30309-4
Radiogenomic classification for MGMT promoter methylation status using multi-omics fused feature space for least invasive diagnosis through mpMRI scans
Erratum in
-
Author Correction: Radiogenomic classification for MGMT promoter methylation status using multi-omics fused feature space for least invasive diagnosis through mpMRI scans.Sci Rep. 2023 Mar 30;13(1):5188. doi: 10.1038/s41598-023-32199-y. Sci Rep. 2023. PMID: 36997539 Free PMC article. No abstract available.
Abstract
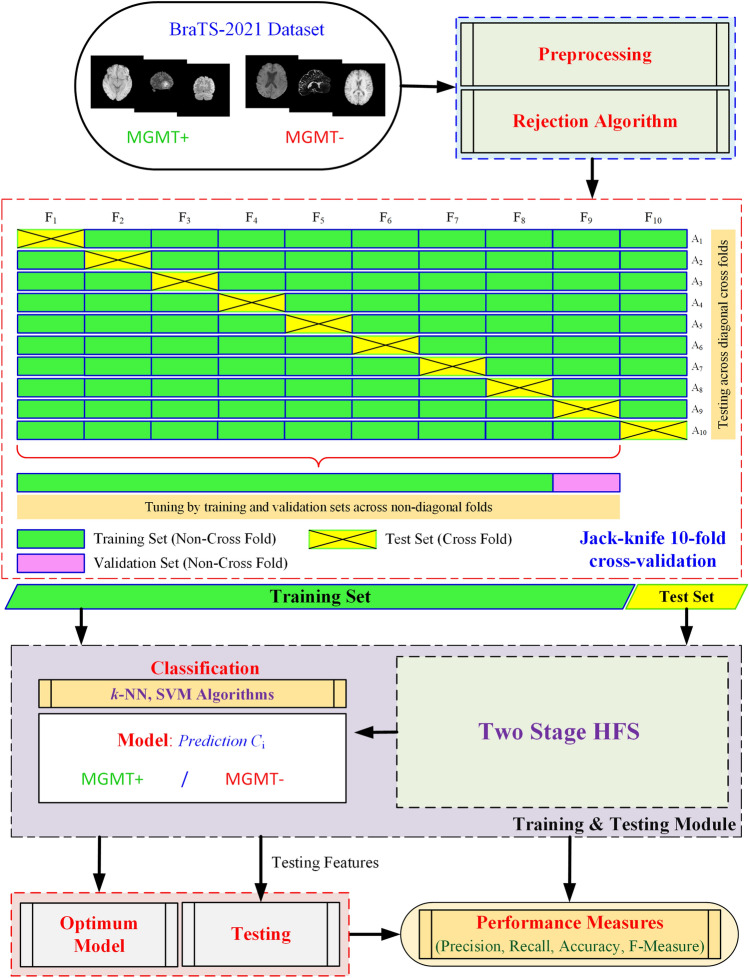
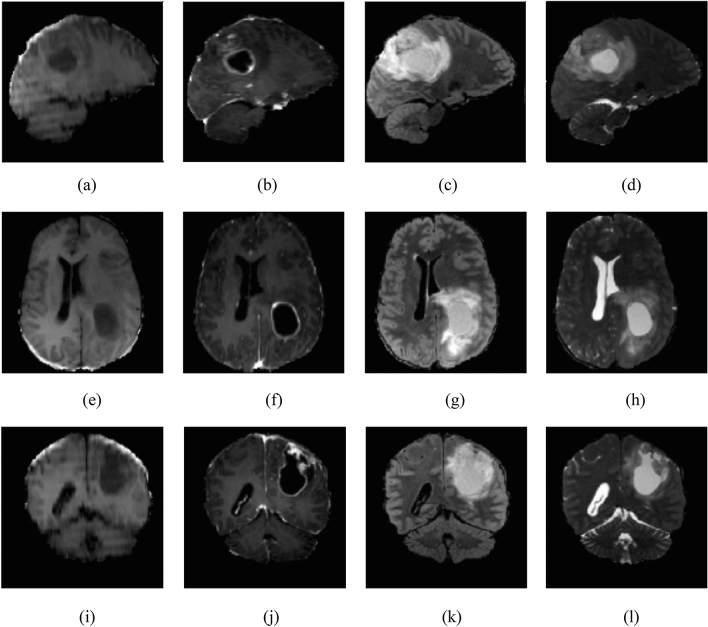
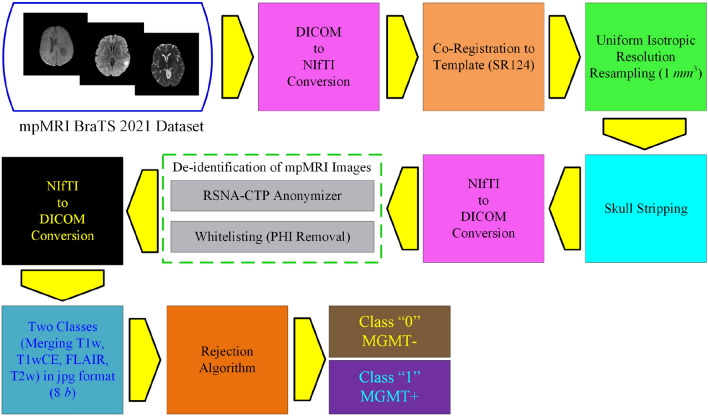
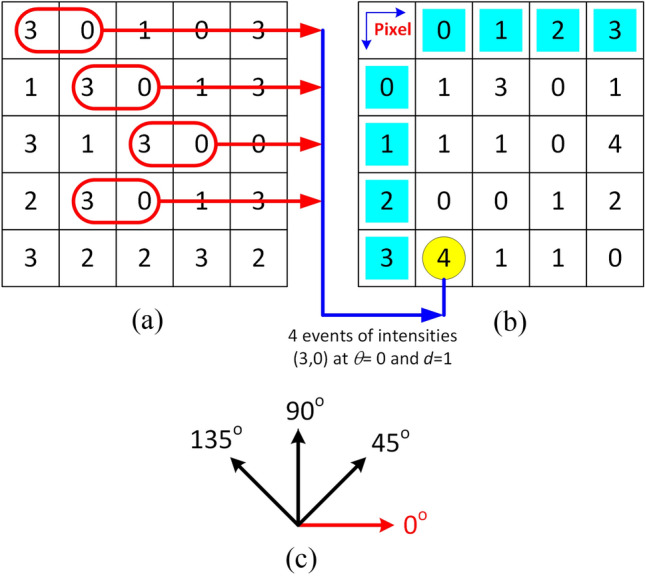
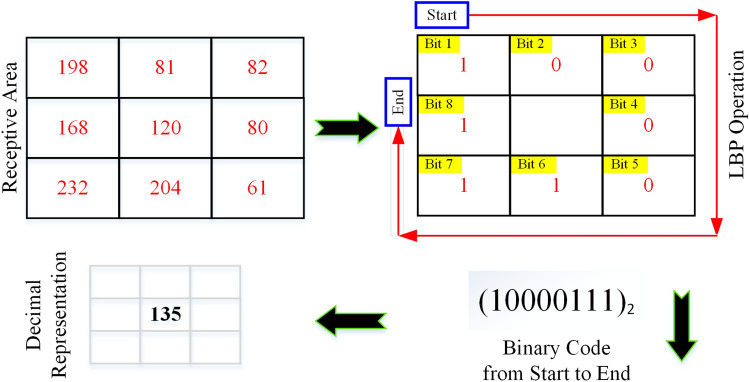
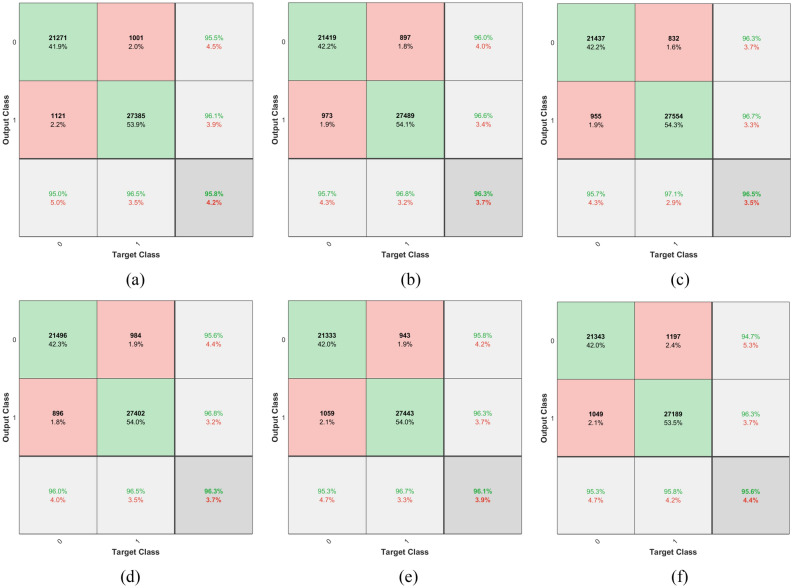
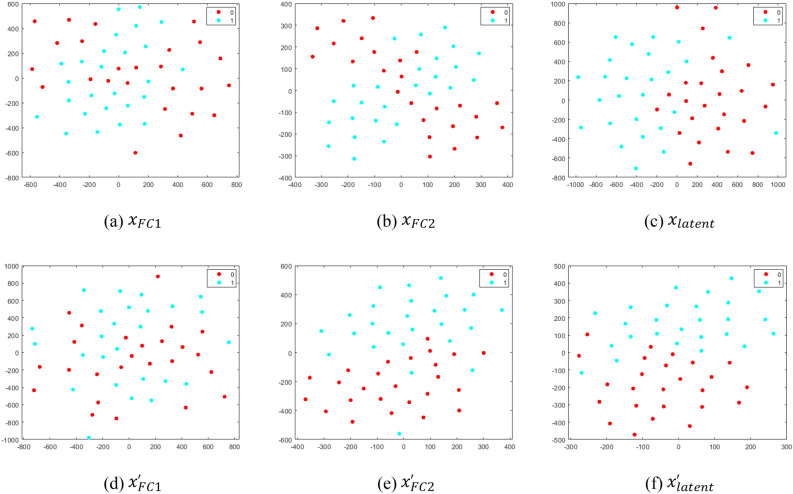
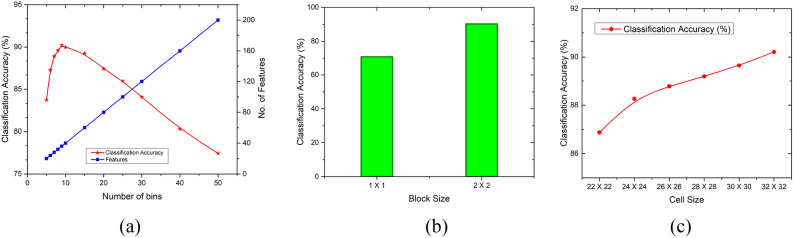
Accurate radiogenomic classification of brain tumors is important to improve the standard of diagnosis, prognosis, and treatment planning for patients with glioblastoma. In this study, we propose a novel two-stage MGMT Promoter Methylation Prediction (MGMT-PMP) system that extracts latent features fused with radiomic features predicting the genetic subtype of glioblastoma. A novel fine-tuned deep learning architecture, namely Deep Learning Radiomic Feature Extraction (DLRFE) module, is proposed for latent feature extraction that fuses the quantitative knowledge to the spatial distribution and the size of tumorous structure through radiomic features: (GLCM, HOG, and LBP). The application of the novice rejection algorithm has been found significantly effective in selecting and isolating the negative training instances out of the original dataset. The fused feature vectors are then used for training and testing by k-NN and SVM classifiers. The 2021 RSNA Brain Tumor challenge dataset (BraTS-2021) consists of four structural mpMRIs, viz. fluid-attenuated inversion-recovery, T1-weighted, T1-weighted contrast enhancement, and T2-weighted. We evaluated the classification performance, for the very first time in published form, in terms of measures like accuracy, F1-score, and Matthews correlation coefficient. The Jackknife tenfold cross-validation was used for training and testing BraTS-2021 dataset validation. The highest classification performance is (96.84 ± 0.09)%, (96.08 ± 0.10)%, and (97.44 ± 0.14)% as accuracy, sensitivity, and specificity respectively to detect MGMT methylation status for patients suffering from glioblastoma. Deep learning feature extraction with radiogenomic features, fusing imaging phenotypes and molecular structure, using rejection algorithm has been found to perform outclass capable of detecting MGMT methylation status of glioblastoma patients. The approach relates the genomic variation with radiomic features forming a bridge between two areas of research that may prove useful for clinical treatment planning leading to better outcomes.
© 2023. The Author(s).
Conflict of interest statement
The authors declare no competing interests.
Figures


Similar articles
-
Deep learning classification of MGMT status of glioblastomas using multiparametric MRI with a novel domain knowledge augmented mask fusion approach.Sci Rep. 2025 Jan 25;15(1):3273. doi: 10.1038/s41598-025-87803-0. Sci Rep. 2025. PMID: 39863759 Free PMC article.
-
Machine learning-based radiomic, clinical and semantic feature analysis for predicting overall survival and MGMT promoter methylation status in patients with glioblastoma.Magn Reson Imaging. 2020 Dec;74:161-170. doi: 10.1016/j.mri.2020.09.017. Epub 2020 Sep 25. Magn Reson Imaging. 2020. PMID: 32980505
-
Structural and advanced imaging in predicting MGMT promoter methylation of primary glioblastoma: a region of interest based analysis.BMC Cancer. 2018 Feb 21;18(1):215. doi: 10.1186/s12885-018-4114-2. BMC Cancer. 2018. PMID: 29467012 Free PMC article.
-
State of Radiomics in Glioblastoma.Neurosurgery. 2021 Jul 15;89(2):177-184. doi: 10.1093/neuros/nyab124. Neurosurgery. 2021. PMID: 33913492 Review.
-
Association between response to primary treatments and MGMT status in glioblastoma.Expert Rev Anticancer Ther. 2008 Nov;8(11):1781-6. doi: 10.1586/14737140.8.11.1781. Expert Rev Anticancer Ther. 2008. PMID: 18983238 Review.
Cited by
-
Radiomics and AI-Based Prediction of MGMT Methylation Status in Glioblastoma Using Multiparametric MRI: A Hybrid Feature Weighting Approach.Diagnostics (Basel). 2025 May 21;15(10):1292. doi: 10.3390/diagnostics15101292. Diagnostics (Basel). 2025. PMID: 40428285 Free PMC article.
-
Virtual Biopsy for the Prediction of MGMT Promoter Methylation in Gliomas: A Comprehensive Review of Radiomics and Deep Learning Approaches Applied to MRI.Diagnostics (Basel). 2025 Jan 22;15(3):251. doi: 10.3390/diagnostics15030251. Diagnostics (Basel). 2025. PMID: 39941181 Free PMC article. Review.
-
Can diffusion-based generated magnetic resonance images predict glioma methylation accurately?Quant Imaging Med Surg. 2025 Jun 6;15(6):5647-5659. doi: 10.21037/qims-24-1688. Epub 2025 May 21. Quant Imaging Med Surg. 2025. PMID: 40606391 Free PMC article.
-
-New frontiers in domain-inspired radiomics and radiogenomics: increasing role of molecular diagnostics in CNS tumor classification and grading following WHO CNS-5 updates.Cancer Imaging. 2024 Oct 7;24(1):133. doi: 10.1186/s40644-024-00769-6. Cancer Imaging. 2024. PMID: 39375809 Free PMC article. Review.
-
From Voxel to Gene: A Scoping Review on MRI Radiogenomics' Artificial Intelligence Predictions in Adult Gliomas and Glioblastomas-The Promise of Virtual Biopsy?Biomedicines. 2024 Sep 23;12(9):2156. doi: 10.3390/biomedicines12092156. Biomedicines. 2024. PMID: 39335670 Free PMC article.
References
-
- Siegel, R.L., et al. Colorectal cancer statistics, 2020. CA Cancer J. Clin.70(3), 145–164 (2020). - PubMed
Publication types
MeSH terms
Substances
LinkOut - more resources
Full Text Sources
Medical
Research Materials
Miscellaneous
