

Engineering Inflammation-Resistant Cartilage: Bridging Gene Therapy and Tissue Engineering
- PMID: 36841937
- PMCID: PMC11468558
- DOI: 10.1002/adhm.202202271
Engineering Inflammation-Resistant Cartilage: Bridging Gene Therapy and Tissue Engineering
Abstract
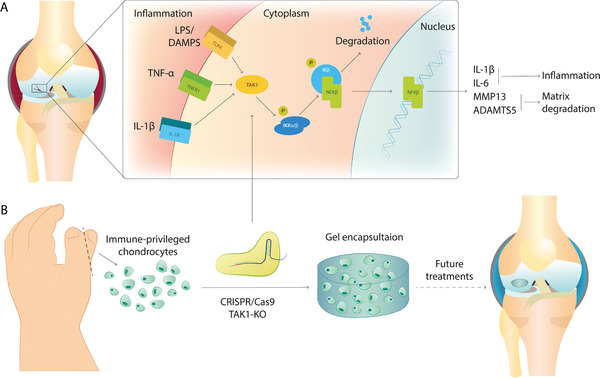
Articular cartilage defects caused by traumatic injury rarely heal spontaneously and predispose into post-traumatic osteoarthritis. In the current autologous cell-based treatments the regenerative process is often hampered by the poor regenerative capacity of adult cells and the inflammatory state of the injured joint. The lack of ideal treatment options for cartilage injuries motivated the authors to tissue engineer a cartilage tissue which would be more resistant to inflammation. A clustered regularly interspaced short palindromic repeats (CRISPR)-Cas9 knockout of TGF-β-activated kinase 1 (TAK1) gene in polydactyly chondrocytes provides multivalent protection against the signals that activate the pro-inflammatory and catabolic NF-κB pathway. The TAK1-KO chondrocytes encapsulate into a hyaluronan hydrogel deposit copious cartilage extracellular matrix proteins and facilitate integration onto native cartilage, even under proinflammatory conditions. Furthermore, when implanted in vivo, compared to WT fewer pro-inflammatory M1 macrophages invade the cartilage, likely due to the lower levels of cytokines secreted by the TAK1-KO polydactyly chondrocytes. The engineered cartilage thus represents a new paradigm-shift for the creation of more potent and functional tissues for use in regenerative medicine.
Keywords: cartilage tissue engineering; gene editing; inflammation.
© 2023 The Authors. Advanced Healthcare Materials published by Wiley-VCH GmbH.
Conflict of interest statement
The authors have submitted a patent on the hyaluronan hydrogel.
Figures
Similar articles
-
Engineered Cartilage from Human Chondrocytes with Homozygous Knockout of Cell Cycle Inhibitor p21.Tissue Eng Part A. 2020 Apr;26(7-8):441-449. doi: 10.1089/ten.TEA.2019.0214. Epub 2019 Nov 22. Tissue Eng Part A. 2020. PMID: 31642391
-
Nasal chondrocyte-based engineered autologous cartilage tissue for repair of articular cartilage defects: an observational first-in-human trial.Lancet. 2016 Oct 22;388(10055):1985-1994. doi: 10.1016/S0140-6736(16)31658-0. Lancet. 2016. PMID: 27789021
-
CRISPR/Cas9 Editing of Murine Induced Pluripotent Stem Cells for Engineering Inflammation-Resistant Tissues.Arthritis Rheumatol. 2017 May;69(5):1111-1121. doi: 10.1002/art.39982. Epub 2017 Mar 31. Arthritis Rheumatol. 2017. PMID: 27813286 Free PMC article.
-
[Cartilage tissue engineering: state-of-the-art and future approaches].Pathol Biol (Paris). 2005 Dec;53(10):590-8. doi: 10.1016/j.patbio.2004.12.019. Pathol Biol (Paris). 2005. PMID: 16364811 Review. French.
-
Articular cartilage repair using tissue engineering technique--novel approach with minimally invasive procedure.Artif Organs. 2004 Jan;28(1):28-32. doi: 10.1111/j.1525-1594.2004.07317.x. Artif Organs. 2004. PMID: 14720285 Review.
Cited by
-
Adipose-Derived Stem Cells for Cartilage Tissue Engineering: A Bibliometric Analysis of Trends and Themes.J Multidiscip Healthc. 2025 May 30;18:3023-3037. doi: 10.2147/JMDH.S522203. eCollection 2025. J Multidiscip Healthc. 2025. PMID: 40463583 Free PMC article.
-
Streamlined, single-step non-viral CRISPR-Cas9 knockout strategy enhances gene editing efficiency in primary human chondrocyte populations.Arthritis Res Ther. 2024 Mar 11;26(1):66. doi: 10.1186/s13075-024-03294-w. Arthritis Res Ther. 2024. PMID: 38468277 Free PMC article.
-
Advanced gene nanocarriers/scaffolds in nonviral-mediated delivery system for tissue regeneration and repair.J Nanobiotechnology. 2024 Jun 26;22(1):376. doi: 10.1186/s12951-024-02580-8. J Nanobiotechnology. 2024. PMID: 38926780 Free PMC article. Review.
-
Nanomaterial-Based Drug Delivery Systems Targeting Functional Cells for Osteoarthritis Treatment: Mechanisms, Challenges and Future Prospects.Int J Nanomedicine. 2025 Apr 25;20:5291-5320. doi: 10.2147/IJN.S518935. eCollection 2025. Int J Nanomedicine. 2025. PMID: 40303574 Free PMC article. Review.
-
From molecular mechanism to plant intervention: the bidirectional regulation of inflammation and oxidative stress in bone aging.Front Endocrinol (Lausanne). 2025 Jul 9;16:1634580. doi: 10.3389/fendo.2025.1634580. eCollection 2025. Front Endocrinol (Lausanne). 2025. PMID: 40704144 Free PMC article. Review.
References
-
- Lee J. H., Ort T., Ma K., Picha K., Carton J., Marsters P. A., Lohmander L. S., Baribaud F., Song X.‐Y. R., Blake S., Osteoarthritis Cartilage 2009, 17, 613. - PubMed
-
- Guilak F., Fermor B., Keefe F. J., Kraus V. B., Olson S. A., Pisetsky D. S., Setton L. A., Weinberg J. B., Clin. Orthop. Relat. Res. 2004, 423, 17. - PubMed
-
- Jungmann P. M., Gersing A. S., Baumann F., Holwein C., Braun S., Neumann J., Zarnowski J., Hofmann F. C., Imhoff A. B., Rummeny E. J., Link T. M., Knee Surg. Sports Traumatol. Arthrosc. 2019, 27, 3001. - PubMed
Publication types
MeSH terms
LinkOut - more resources
Full Text Sources
Research Materials
Miscellaneous
