. 2023 Mar 14;56(3):562-575.e6.
doi: 10.1016/j.immuni.2023.01.025. Epub 2023 Feb 25.

Skin γδ T cell inflammatory responses are hardwired in the thymus by oxysterol sensing via GPR183 and calibrated by dietary cholesterol

Affiliations

Skin γδ T cell inflammatory responses are hardwired in the thymus by oxysterol sensing via GPR183 and calibrated by dietary cholesterol

Michela Frascoli et al. Immunity. .

Abstract

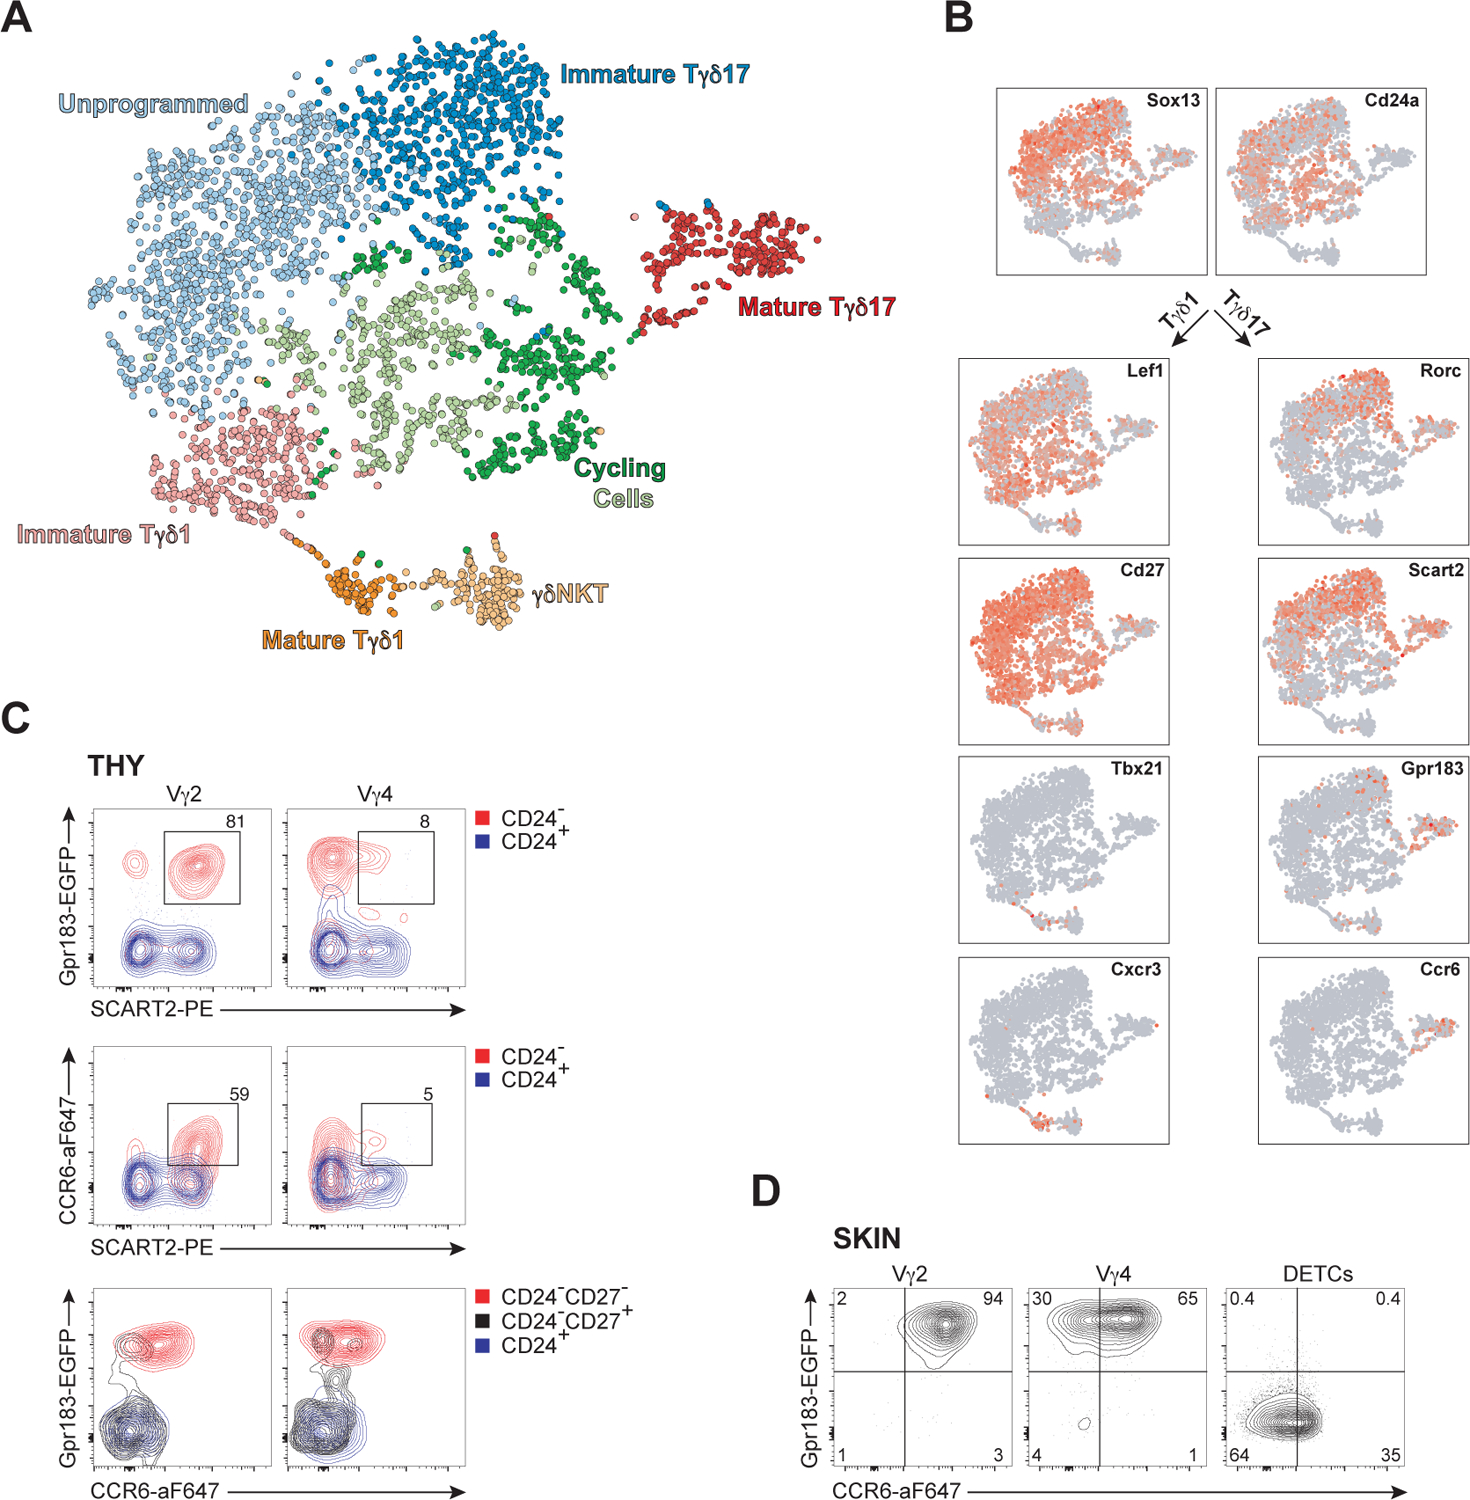
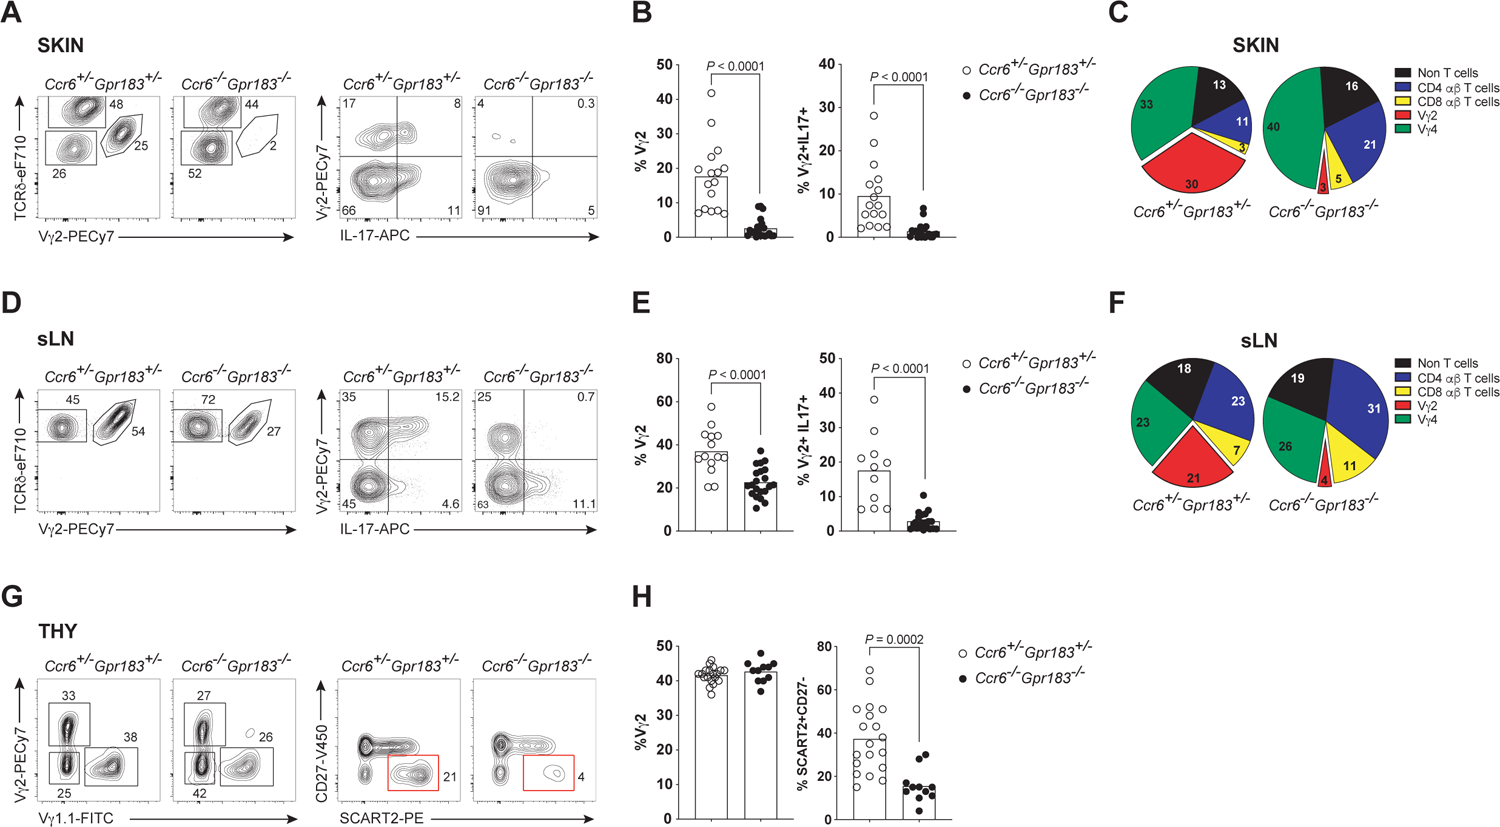
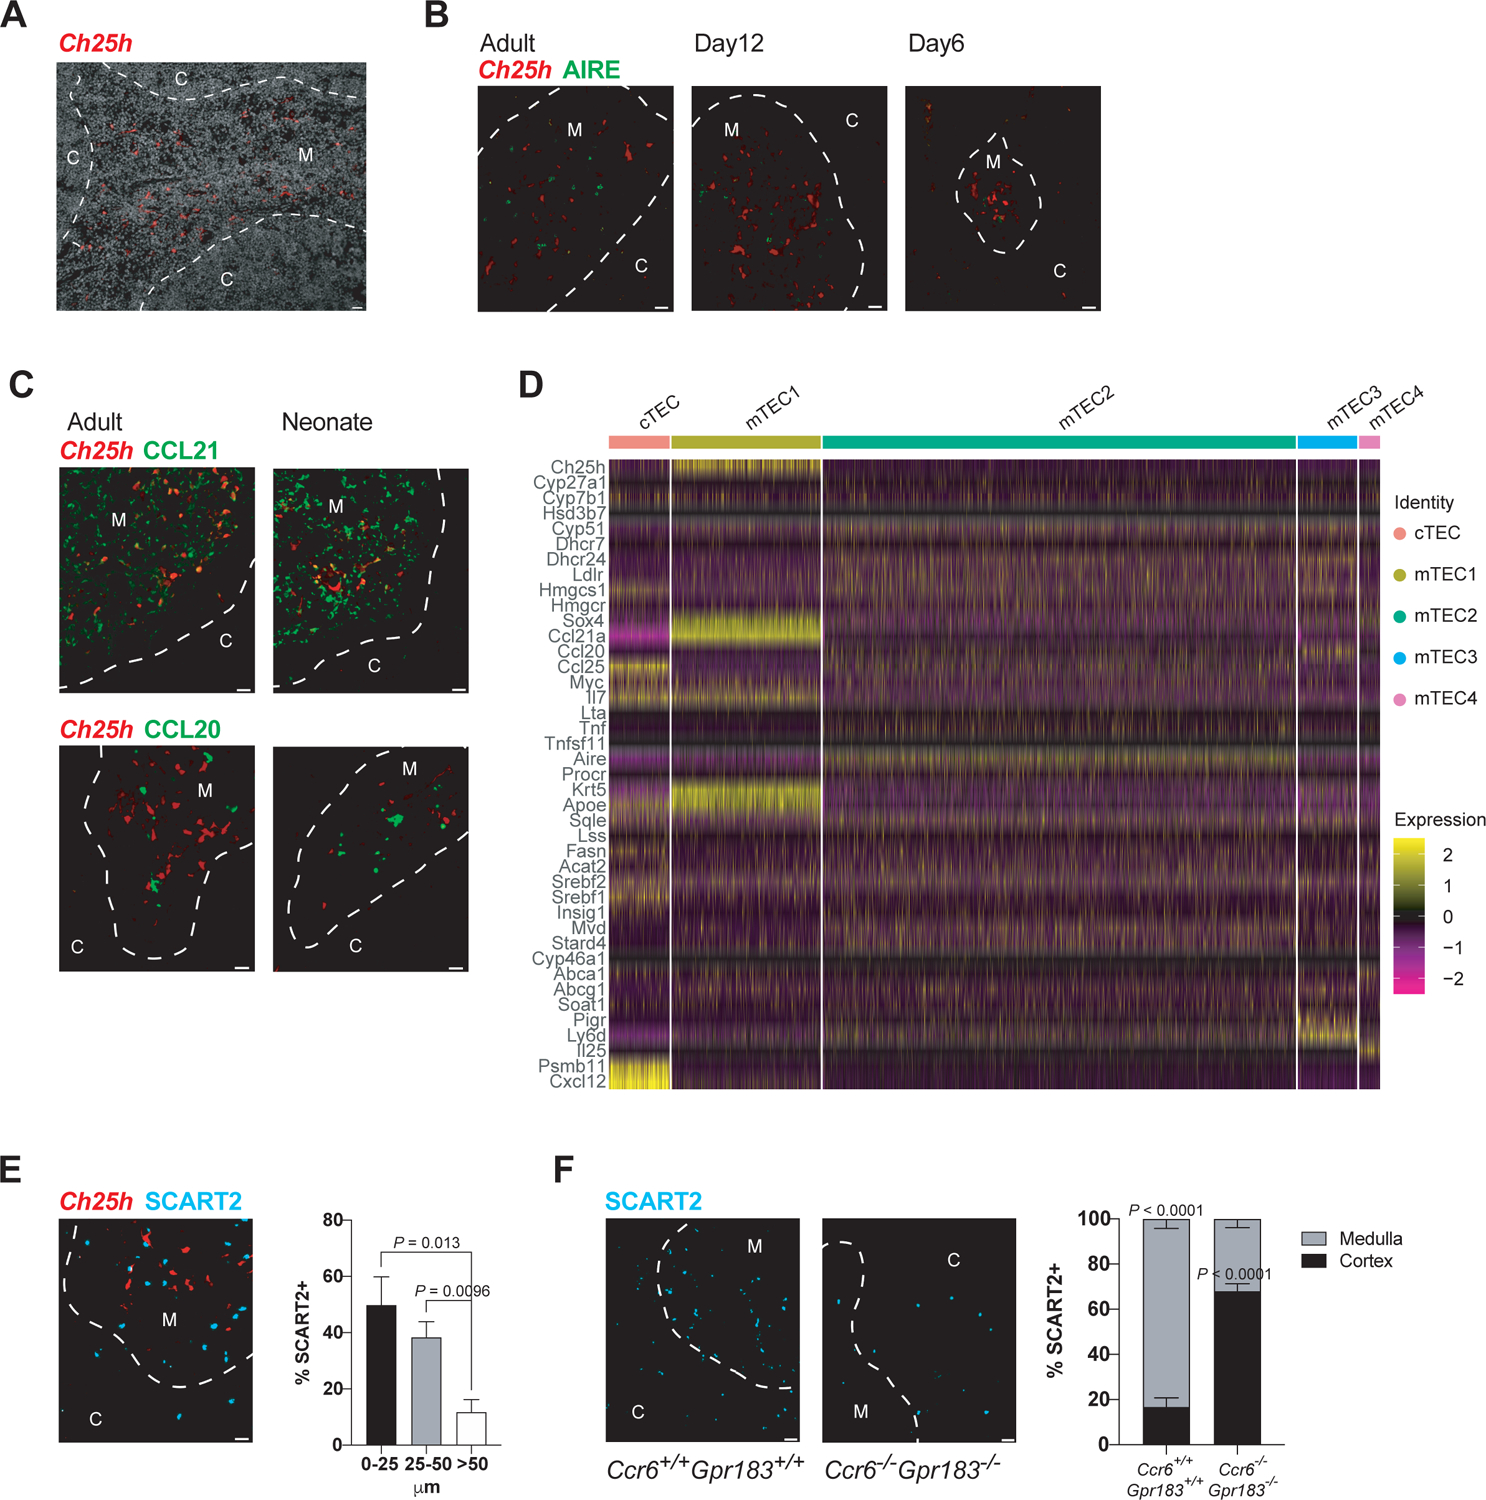
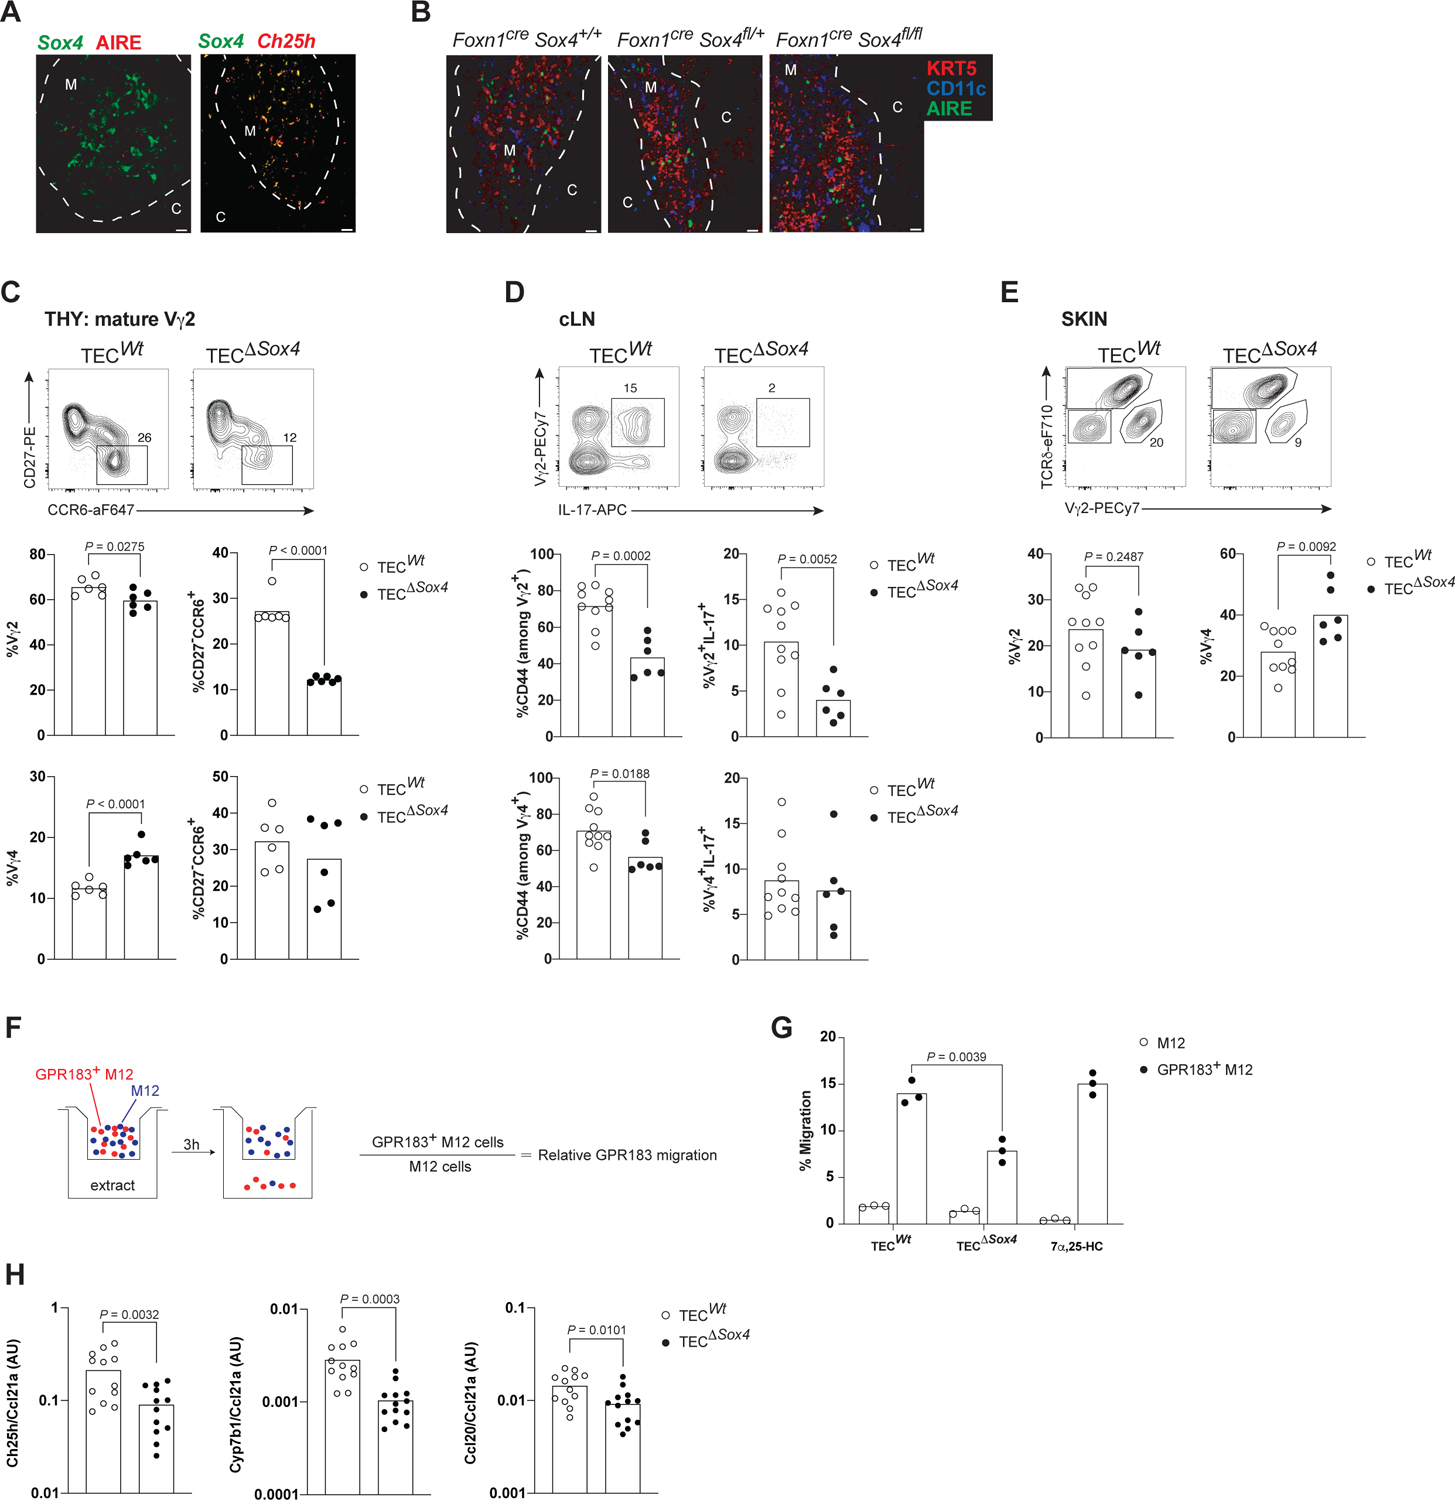
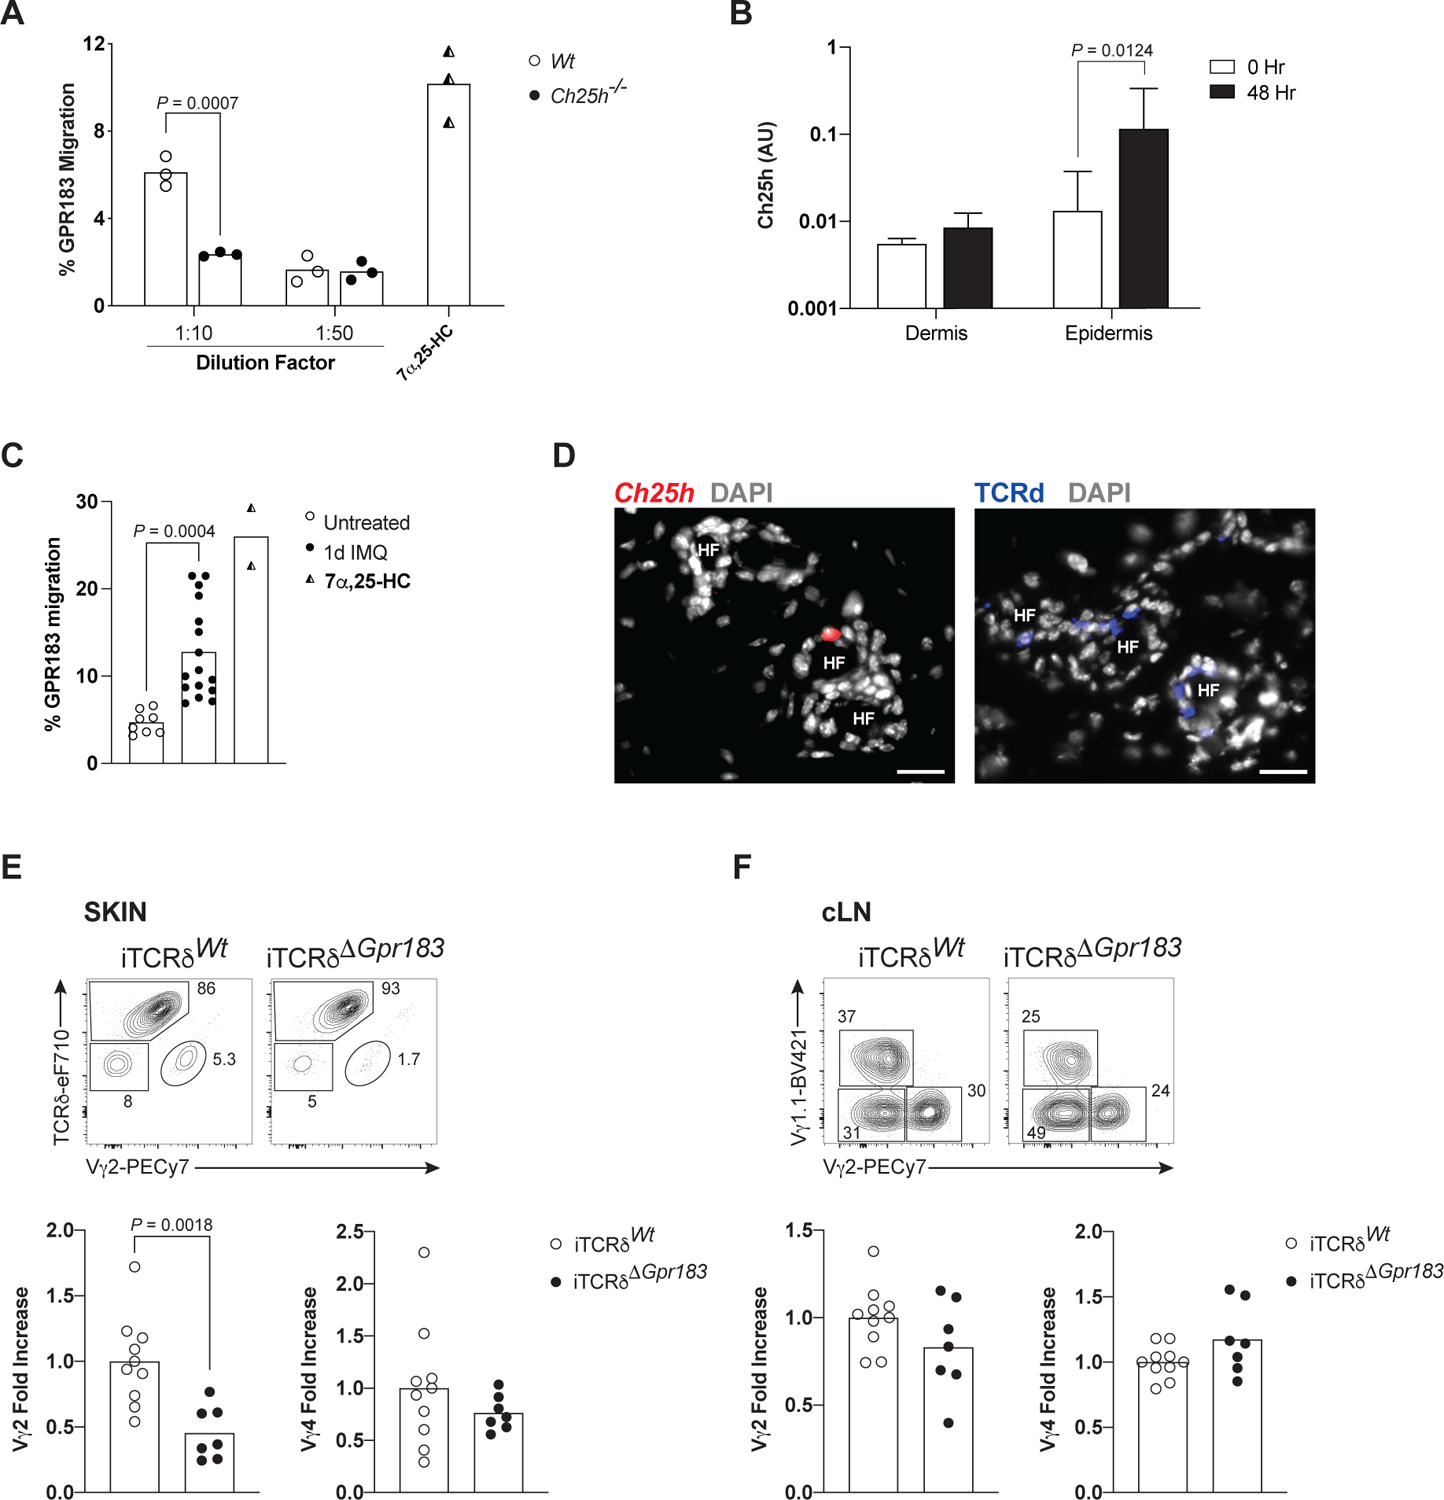
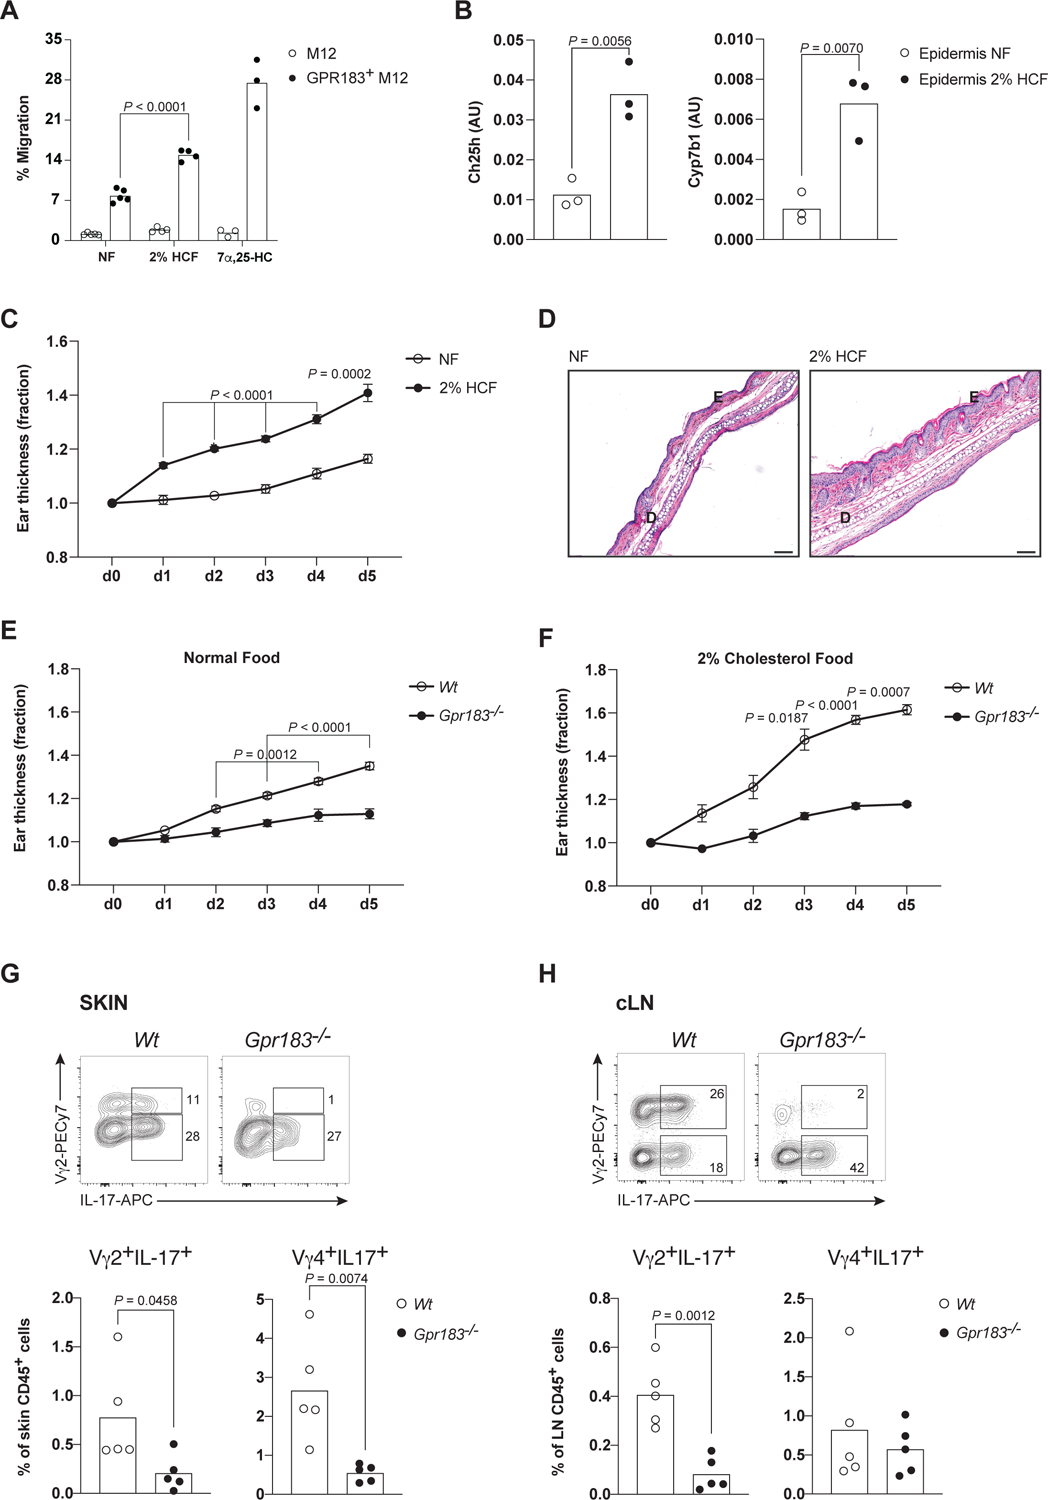
Dietary components and metabolites have a profound impact on immunity and inflammation. Here, we investigated how sensing of cholesterol metabolite oxysterols by γδ T cells impacts their tissue residency and function. We show that dermal IL-17-producing γδ T (Tγδ17) cells essential for skin-barrier homeostasis require oxysterols sensing through G protein receptor 183 (GPR183) for their development and inflammatory responses. Single-cell transcriptomics and murine reporter strains revealed that GPR183 on developing γδ thymocytes is needed for their maturation by sensing medullary thymic epithelial-cell-derived oxysterols. In the skin, basal keratinocytes expressing the oxysterol enzyme cholesterol 25-hydroxylase (CH25H) maintain dermal Tγδ17 cells. Diet-driven increases in oxysterols exacerbate Tγδ17-cell-mediated psoriatic inflammation, dependent on GPR183 on γδ T cells. Hence, cholesterol-derived oxysterols control spatially distinct but biologically linked processes of thymic education and peripheral function of dermal T cells, implicating diet as a focal parameter of dermal Tγδ17 cells.

Keywords: GPR183; IL-17; cholesterol; diet; gamma delta T cells; mTEC; oxysterols; psoriasis; skin.


Conflict of interest statement

Declaration of interests The authors declare no competing interests.

Figures

Figure 1.
Figure 1.. Intrathymic programming of Ccr6 and Gpr183 coexpression on mature Tγδ17 thymocytes
(A) Two-dimensional tSNE graphical representation of 3,749 single TCRδ+ thymocytes sorted from 12 day old mice (n=7), clustered into seven color-coded TCRδ+ developmental intermediates. (B)Feature plots of distribution of cells expressing select signature genes of Tγδ17 and Tγδ1 subtypes, superimposed onto the two-dimensional graphs. (C)Representative flow cytometric contour plots depicting expression of Gpr183, CCR6, and SCART2 on immature (CD24+, blue) and mature (CD24, red) Tγδ17 thymocytes (CD27neg at the mature stage) from Gpr183 reporter mice. (D) Representative flow cytometric analysis of expression amounts of Gpr183 and CCR6 of skin γδ T subsets distinguished by TCRγ chain (DETCs express Vγ3TCR) from Gpr183 reporter mice. Data in (C-D) are representative of at least three independent experiments.
Figure 2.
Figure 2.. CCR6 and GPR183 are required for dermal Vγ2+ Tγδ17 cell production in the thymus
(A) Representative flow cytometric plots of γδTCR+ subsets (left) and intracellular IL-17 (right) expression amongst γδ T cells in the skin of adult Ccr6+/−Gpr183+/− compound heterozygotes and Ccr6−/−Gpr183−/− DKO mice. TCRδhiVγ2TCRneg cells are DETCs. (B) Summary of the compiled flow cytometric data of A (n≥11 mice per genotype). P values determined by unpaired t-test. (C) Pie charts showing the frequencies of different T cell subsets making up IL-17+ skin cells of compound heterozygotes and DKO mice analyzed in A. (D-F) Corresponding sets of data from sLN. (G) Representative flow cytometric plots of γδTCR+ thymic subsets (left; Vγ2Vγ1.1 cells are mostly Vγ4TCR+) and Vγ2TCR+ thymocytes distinguished by CD27 and SCART2 expression (right; red box indicates mature Tγδ17 thymocytes) in adult compound heterozygotes and DKO mice. (H) Summary of the compiled flow cytometric data as in G (n≥11 mice per genotype).i Data in (A-H) are representative of at least three independent experiments.
Figure 3.
Figure 3.. Ch25h+ mTEC1 constitutes the oxysterol thymic niche for Tγδ17 cell maturation
(A) Representative immunofluorescence (IF) image (from 5 experiments) of adult Ch25h reporter thymus stained with anti-RFP Ab (red, capturing tdTom expression). M, medulla; C, cortex. Dashed white line demarcates cortico-medullary junction. Scale bar is 20 μm throughout. (B-C) Representative IF images (from 5 experiments) of adult and neonatal Ch25h reporter thymi stained with anti-RFP (red) and anti-AIRE (green) Abs and corresponding zoom-in details (B); with anti-CCL21 Ab (green, top row) and with anti-CCL20 Ab (green, bottom row) (C). (D) Heatmap showing differential single cTEC and mTEC expression of select signature genes of TEC subsets and genes in the sterol metabolic pathway. Color bars (top) represent identities of five distinct TEC subsets. (E) Representative IF image (from 5 experiments) of Ch25h reporter thymus stained with anti-RFP (red) and anti-SCART2 (blue) Abs. The distance of SCART2-expressing cells from Ch25h-expressing cells was measured using ImageJ, and percentage of SCART2-expressing cells between 0–25, 25–50, and >50μM distance was plotted (≥350 cells analyzed; P values determined by unpaired t-test). (F) Representative IF images (from 3 experiments) of SCART2-expressing cells in adult WT and DKO thymi stained with anti-SCART2 Ab (blue). Frequencies of SCART2-expressing cells localized in the medulla or the cortex are recorded for both genotypes (≥300 cells per genotype analyzed; P values determined by unpaired t-test). Data in (A-C and E-F) are representative of at least 3 independent experiments.
Figure 4.
Figure 4.. Sox4 expressing TECs control Tγδ17 thymic development
(A) Representative IF images (from 3 experiments) of adult Sox4 reporter thymus stained with stained with anti-GFP (green, Sox4 expression proxy) and anti-AIRE (red) Abs (left image), juxtaposed to a representative image (from 2 experiments) of adult Sox4-Ch25h double reporter thymus stained with anti-GFP (green) and anti-RFP (red, Ch25h expression proxy) Abs (right image). Dashed white line demarcates cortico-medullary junction. Scale bar is 20 μm throughout. (B) Representative IF images of adult Foxn1creSox4+/+ (TECWt), Foxn1creSox4fl/+ and Foxn1creSox4fl/fl (TECΔSox4) thymi stained with anti-KRT5 (red), anti-CD11c (blue) and anti-AIRE (green) Abs. (C) Representative flow cytometric plots of CCR6 and CD27 expression on mature Vγ2TCR+ thymocytes from 10-day old TECWT and TECΔSox4 thymi (top row). Summary of the compiled frequencies of Vγ2TCR+ cells amongst total γδTCR+ thymocytes and Vγ2+ Tγδ17 cells amongst total mature Vγ2TCR+ thymocytes in mice of indicated genotypes (middle row). Corresponding summary for Vγ4TCR+ cell frequencies (bottom row) with n≥5 mice per genotype. (D) Representative intracellular staining for IL-17 amongst Vγ2TCR+ cells from adult TECWt and TECΔSox4 cervical LNs (top row). Summary of the compiled frequencies of activated (CD44+) cells amongst Vγ2TCR+ cells and Vγ2+IL17+ cells amongst total γδ T cells (middle row). All thymus-programmed Tγδ17 cells are CD44+ in LNs. Corresponding summary for Vγ4TCR+ cell frequencies (bottom row). n≥6 mice per genotype. (E) Representative flow plots of γδ T cell subsets from adult TECWT and TECΔSox4 ear skin (top row). Summary of the compiled frequencies of dermal Vγ2TCR+ and Vγ4TCR+ cells in the skin (bottom row) with n≥6 mice per genotype. (F) Schematic for GPR183-mediated transwell migration assay. (G) Relative migration efficiency of GPR183+ cells to adult TECWt and TECΔSox4 thymic extracts (n=3 mice/condition). 100nM of 7α,25-HC was used as the positive control. (H) Thymic expression analysis of indicated genes of TECWT and TECΔSox4 mice by RT-qPCR normalized to mTEC1 specific gene Ccl21a (n=12 mice per genotype). P values determined by unpaired t-test. Data in (A-H) are representative of at least 3 independent experiments. P values determined by unpaired t-test (all, except H) or by two-way ANOVA (H).
Figure 5.
Figure 5.. Epidermal-derived oxysterols maintain skin Tγδ17 cells
(A) Relative migration of GPR183+ cells in a transwell assay to ear extracts from adult WT and Ch25h−/− mice (n=3 mice per genotype). 100 nM of 7α,25-HC was used as the positive control. (B) Analysis of Ch25h expression by RT-qPCR of dermal and epidermal cells isolated from adult WT ear skin post topical Imiquimod application for two days (n≥3 per time point). (C) Relative migration of GPR183+ M12 cells in a transwell assay to ear extracts from adult WT mice treated for 1d with IMQ (n≥8 mice per genotype). 100 nM of 7α,25-HC was used as the positive control. (D) Representative IF images (from 5 experiments) of ear skin from Ch25h reporter mice stained with DAPI, anti-RFP (left, to detect tdTom reporter) and anti-TCRδ (blue, right) Abs. HF, hair follicle. (E) Representative flow cytometric profiles of γδ T cell subsets from adult TcrdCre/ERT2 (iTCRδWt) and TcrdCre/ERT2;Gpr183fx/fx (iTCRδΔGpr183) ear skin (top). Summary of the compiled relative frequencies of dermal Vγ2+ and Vγ4+ (Vγ1.1Vγ2) T cells in induced Gpr183-deficient mice, compared to WT, set as 1 (bottom) (n≥ mice per genotype). (F) Representative flow cytometric profiles of γδ T cell subsets from adult iTCRδWt and iTCRδΔGpr183 cervical LNs (top). Summary of relative frequencies of dermal Vγ2+ and Vγ4+ T cells in induced Gpr183-deficient mice, compared to WT, set as 1 (bottom). n≥7 mice per genotype. Data in (A-F) are representative of at least 3 independent experiments. P values determined by unpaired t-test.
Figure 6.
Figure 6.. Dietary cholesterol exacerbates Imiquimod-induced psoriasis that is dependent on GPR183 oxysterol cognition
(A) Relative migration of GPR183+ cells to ear extracts from mice on NF or 2% HCF diets for 2 wks (n≥4 per diet group), measured in the transwell migration assay. (B) Analysis of Ch25h and Cyp7b1 expression by RT-qPCR of ear skin epidermal cells of adult WT mice on different diets (NF, normal food or 2% HCF, high cholesterol food) for 2–4 weeks (n=3 per diet group). 100 nM of 7α,25-HC was used as the positive control. (C) Relative ear-skin thickness (set at 1 at d0) measurements for 6 days from of IMQ-treated WT mice on NF or 2% HCF diet (n≥11 per diet group). (D) Representative hematoxylin-and-eosin staining of ear skin from WT mice treated with IMQ for 5d as in (c) (n=5 per diet group). D, dermis; E, epidermis. Scale bar is 100 μm. (E-F) Relative ear-skin thickness measurements of IMQ-treated WT and Gpr183−/− mice on NF diet (n≥6 mice per genotype) (E) or on 2% HCF diet (n=5 mice per genotype) (F). (G-H) Representative flow cytometric profiles of intracellular IL-17 (icIL-17) amounts in Vγ2+ T cells from WT and Gpr183−/− skin (G) and cervical LNs (H) of mice (2% HCF diet) treated daily for 5 d with IMQ (top rows). Summary of frequencies of icIL-17+ cells expressing Vγ2+TCR or Vγ4+TCR (bottom rows) amongst hematopoietic cells (CD45+) determined in the same studies (n=5 mice per genotype), at the end of IMQ treatment. Data in (A-H) are representative of at least 3 independent experiments. P values determined by unpaired t-test (A, G, H) or by two-way ANOVA (B, D-F).

Similar articles

Cited by

References

    1. Kang J, and Malhotra N (2015). Transcription Factor Networks Directing the Development, Function, and Evolution of Innate Lymphoid Effectors. Annu. Rev. Immunol 33, 505–538. DOI: 10.1146/annurev-immunol-032414-112025. - DOI - PMC - PubMed
    1. Soltani-Arabshahi R, Wong B, Feng B-J, Goldgar DE, Duffin KC, and Krueger GG (2010). Obesity in Early Adulthood as a Risk Factor for Psoriatic Arthritis. Arch Dermatol 146, 721–726. DOI: 10.1001/archdermatol.2010.141. - DOI - PubMed
    1. Naldi L, Conti A, Cazzaniga S, Patrizi A, Pazzaglia M, Lanzoni A, Veneziano L, Pellacani G, and Group, the P.E.R.S. (2014). Diet and physical exercise in psoriasis: a randomized controlled trial. Brit J Dermatol 170, 634–642. DOI: 10.1111/bjd.12735. - DOI - PubMed
    1. Trak-Fellermeier MA, Brasche S, Winkler G, Koletzko B, and Heinrich J (2004). Food and fatty acid intake and atopic disease in adults. Eur Respir J 23, 575–582. DOI: 10.1183/09031936.04.00074404. - DOI - PubMed
    1. Reboldi A, Dang EV, McDonald JG, Liang G, Russell DW, and Cyster JG (2014). 25-Hydroxycholesterol suppresses interleukin-1–driven inflammation downstream of type I interferon. Science 345, 679–684. DOI: 10.1126/science.1254790. - DOI - PMC - PubMed

Publication types