. 2023 Apr 15:270:119972.
doi: 10.1016/j.neuroimage.2023.119972. Epub 2023 Feb 25.

Less is more: balancing noise reduction and data retention in fMRI with data-driven scrubbing

Affiliations

Less is more: balancing noise reduction and data retention in fMRI with data-driven scrubbing

Damon Đ Phạm et al. Neuroimage. .

Abstract

Functional MRI (fMRI) data may be contaminated by artifacts arising from a myriad of sources, including subject head motion, respiration, heartbeat, scanner drift, and thermal noise. These artifacts cause deviations from common distributional assumptions, introduce spatial and temporal outliers, and reduce the signal-to-noise ratio of the data-all of which can have negative consequences for the accuracy and power of downstream statistical analysis. Scrubbing is a technique for excluding fMRI volumes thought to be contaminated by artifacts and generally comes in two flavors. Motion scrubbing based on subject head motion-derived measures is popular but suffers from a number of drawbacks, among them the need to choose a threshold, a lack of generalizability to multiband acquisitions, and high rates of censoring of individual volumes and entire subjects. Alternatively, data-driven scrubbing methods like DVARS are based on observed noise in the processed fMRI timeseries and may avoid some of these issues. Here we propose "projection scrubbing", a novel data-driven scrubbing method based on a statistical outlier detection framework and strategic dimension reduction, including independent component analysis (ICA), to isolate artifactual variation. We undertake a comprehensive comparison of motion scrubbing with data-driven projection scrubbing and DVARS. We argue that an appropriate metric for the success of scrubbing is maximal data retention subject to reasonable performance on typical benchmarks such as the validity, reliability, and identifiability of functional connectivity. We find that stringent motion scrubbing yields worsened validity, worsened reliability, and produced small improvements to fingerprinting. Meanwhile, data-driven scrubbing methods tend to yield greater improvements to fingerprinting while not generally worsening validity or reliability. Importantly, however, data-driven scrubbing excludes a fraction of the number of volumes or entire sessions compared to motion scrubbing. The ability of data-driven fMRI scrubbing to improve data retention without negatively impacting the quality of downstream analysis has major implications for sample sizes in population neuroscience research.


Figures

Fig. A.1.
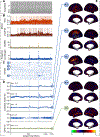
Fig. A.1.. Example scan with a high amount of subject head motion.
The scan shown is HCP subject 250427, visit 2, LR phase encoding. It represents the 95th percentile of mean FD. As in Fig. 1, data-driven scrubbing flags fewer volumes than motion scrubbing. Refer to Fig. 1 for detailed descriptions of each panel.
Fig. A.2.
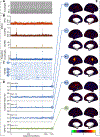
Fig. A.2.. Example scan with a low amount of subject head motion.
The scan shown is HCP subject 177746, visit 2, RL phase encoding. It represents the 5th percentile of mean FD. The third example noise IC actually resembles somatomotor network activation: transient head motion may be induced or compensated by directed movements. Also, the other example IC (green) actually appears to represent noise, but since its timecourse indicates continuous, non-transient fluctuations, it is not selected by projection scrubbing for computing leverage because constant noise is not amenable to scrubbing. Refer to Fig. 1 for detailed descriptions of each panel. (For interpretation of the references to colour in this figure legend, the reader is referred to the web version of this article.)
Fig. A.3.
Fig. A.3.. Full images of four noise components selected by projection scrubbing.
The cortex and subcortex are shown for four selected components. (A) The 34th IC from HCP subject 111312, visit 2, LR phase encoding. This IC is shown in Fig. 1, but here we also display the subcortex. Speckles of high intensity are seen on both the posterior cortical surface and the posterior edge of the cerebellum. (B) The 13th IC from HCP subject 917255, visit 2, RL phase encoding. This is a lower motion scan. Spots of high activation appear on the posterior cortical surface, cerebellum, and upper brainstem. (C) The 17th IC from HCP subject 151526, visit 2, RL phase encoding. This scan has the most motion of all scans we used from the HCP Retest set. Many components including this one show a dramatic banding artifact across the cortical surface. (D) The 6th IC from HCP subject 204521, visit 4, LR phase encoding. This high-motion scan has a noise IC with a diffuse high-intensity region on the lateral side of the left hemisphere.
Fig. C.4.
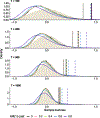
Fig. C.4.. Effect of sample size and autocorrelation on the sampling distribution of kurtosis in normally distributed data with no outliers.
Each density curve is based on 100,000 Monte Carlo samples of a given sample size and autocorrelation level. The theoretical asymptotic distribution of kurtosis for non-autocorrelated data at each sample size is shown in light brown (Fisher, 1930). Vertical lines indicate each distribution’s 0.99 quantile, the threshold used to identify component timeseries likely to contain outliers. For smaller sample sizes, the sampling distribution of kurtosis is right-skewed, becoming more symmetric and converging to a normal distribution as sample size increases. For sample sizes below 1000, the asymptotic distribution is not appropriate. Therefore, for scan duration T<1000 we use simulation to determine the 0.99 quantile; for longer durations, we use the theoretical 0.99 quantile based on the asymptotic distribution. The presence of weak to moderate autocorrelation (e.g., AR(1) coefficient ϕ0.6) has little effect on the sampling distribution of kurtosis.
Fig. C.5.
Fig. C.5.. Effects of timeseries trends on kurtosis.
The presence of trends can invalidate kurtosis as a measure of outlier presence. In the top panel, all three timeseries have the same kurtosis value of 1.222, below the high-kursosis threshold. The first has a weak trend but no outliers, the second has a strong trend, and the third has both a trend and outliers. The bottom panel shows the same timeseries after detrending. Detrending has little effect on the kurtosis of the first timeseries, decreases the kurtosis of the second timeseries, and strongly increases kurtosis for the third dataset (the only one containing outliers). This illustrates the importance of detrending before using kurtosis to detect the presence of outliers.
Fig. D.6.
Fig. D.6.. Expanded comparison of motion scrubbing methods.
We initially evaluated six forms of motion scrubbing: two different notch filters at the respiratory frequency or no filtering applied to the RP timeseries, and either lag-1 differences or lag-4 differences for computing FD. The mean ICC improvement from the CC2+MP6 baseline is shown for connections involving each network (or for all connections), for each method, and for cutoffs between 0.2 mm and 0.8 mm. The bottom row shows results using the full 14.4 minute scan, while the top row shows results using the middle third (almost five minutes). DVARS is included in the last panel for comparison. In the main text we proceeded with the original formulation of FD (lag-1, no filter) and the version which appeared to consistently perform the best at most cutoffs (lag-4, chebyshev), referred to as “modFD”.
Fig. F.7.
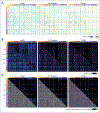
Fig. F.7.. Denoising tends to lower FC strength of stronger connections and proximal connections.
(A) Average FC estimates across subjects and sessions for different denoising strategies, from left to right: minimally preprocessed (MPP), four DCT bases (DCT4), aCompCor with two components per noise ROI (CC2) plus six RPs (CC2+6MP), and the 36 parameter model (36P). CC2+MP6 and 36P additionally include the DCT4 regressors. The top halves of the matrices represent the mean FC strength for each network pair, i.e. for each corresponding region in the lower triangles. (B) Effect of baseline denoising (CC2+MP6) on FC strength for inter- and intra-hemispheric cortical connections. Each point represents a pair of parcels, and lines represent lowess smoothers. Stronger connections and intra-hemispheric connections tend to be weakened more by denoising, possibly reflecting the removal of an artifactual upward bias in FC strength for proximal connections. (C) Average change in FC estimates across subjects and sessions, and across all connections involving a given parcel, for the CC2+MP6 denoising strategy compared to MPP FC. The values are equivalent to the row/column means of the matrix for CC2+MP6 in Panel A minus those for MPP.
Fig. F.8.
Fig. F.8.. Comparison of the difference between intra- and inter-network FC strength, for the denoising methods.
Histograms for z-transformed FC values for each denoising method are shown, with separate histograms for internetwork FC pairs and intra-network FC pairs. For each denoising method, the median inter-network FC value was subtracted from all FC values, shifting both histograms along the x-axis to align the medians of the inter-network FC values across methods. This allows a clearer visual comparison between the magnitude of the difference between inter- and intra-network FC. Strengthened within-network connectivity, relative to between-network connectivity, may reflect the uncovering of expected neural signals from noise contamination. But none of the denoising methods show much clearer separation compared to the others. The difference between the medians increases consistently with greater CompCor order, yet 9P has a higher median difference than 36P.
Fig. F.9.
Fig. F.9.. CC2+MP6 represents the best trade-off between preserving between-subject signal and minimizing within-subject noise.
For select denoising methods, we show the two variance components from which ICC (3, 1) is calculated: MSB, a measure of inter-subject variation (signal, in this context), and MSR, a measure of within-subject variation (noise). As a measure of reliability, ICC increases with greater inter-subject variation (MSB) or lesser within-subject variation (MSR). Arrows along the y-axis of each panel point in the direction corresponding to greater ICC. All denoising methods reduce both MSB and MSR. Results for the CCx methods suggest that using more nuisance regressors leads to stronger decreases in both MSB and MSR. For aCompCor, the trade-off is best for CC2, and even better after adding the six RPs to the set of nuisance regressors.
Fig. F.10.
Fig. F.10.. Expanded comparison of projection scrubbing methods.
This plot shows the three projection scrubbing methods discussed in the main text, along with their corresponding alternatives in which kurtosis is not used to select the noise ICs. For these alternative methods, all highest-variance components up to the number selected by PESEL are used to compute leverage. The mean ICC improvement from the CC2+MP6 baseline is shown for connections involving each network (or for all connections), for each method, and for cutoffs between 2 and 8 times the median. The bottom row shows results using the full 14.4 minute scan, while the top row shows results using the middle third (almost five minutes). DVARS is included in the last panel for comparison. The three methods which use kurtosis to inform noise IC selection yield greater reliability improvements at the higher cutoff values, suggesting both better separation of artifact-contaminated volumes in the leverage timecourse, and that volumes with more egregious artifacts correctly have greater leverage values. For all projection scrubbing methods, stricter cutoffs (up to a point) further benefit subcortical connections, which are known to have lower SNR, and also benefit most connections when less data is used to calculate FC. Meanwhile, more lenient cutoffs alleviate the negative impact of scrubbing on the visual cortex. Together these observations suggest that scrubbing may have greater benefit when less neural signal is available: the noise reduction effected by scrubbing is more impactful than any loss of true neural signal caused by censoring volumes.
Fig. F.11.
Fig. F.11.. Effect of scrubbing on FC magnitude for three selected sessions.
All scrubbing methods generally do not yield stark changes to FC estimates, compared to denoising alone. The subjects are the same subjects shown in Fig. 1, Fig. A.1, and Fig. A.2.
Fig. F.12.
Fig. F.12.. Projection scrubbing results in the greatest improvement in FC reliability across most types of functional connections.
(A) The average change in ICC (over baseline CC2+MP6 denoising) across all connections involving a given cortical network or subcortical group. Data-driven scrubbing produces greater improvement to FC reliability than either form of motion scrubbing across nearly all networks and subcortical groups. (B) Effect of scrubbing on reliability of FC for cortical-cortical (C-C) connections, cortical-subcortical (C-SC) connections, and subcortical-subcortical (SC-SC) connections. Connections involving subcortical regions (SC-SC and C-SC) show the greatest improvement in reliability due to scrubbing, especially with data-driven methods.
Fig. F.13.
Fig. F.13.. Connection-level results for the effects of scrubbing on FC strength, reliability, and validity.
(A) Matrix of mean change in FC values for modFD, ICA projection scrubbing, and DVARS. On average, scrubbing lowers FC strength, especially for intra-cortical connections. (Within each network, connections are listed left cortex first and right cortex second, such that the darker rectangles of blue occur in blocks of left-left and right-right connections.) This is consistent with the idea that scrubbing reduces the effects of motion, one of them being inflated short-distance (within-hemisphere) connectivity, compared to long-distance (betweeen-hemisphere) connectivity. (B) Matrix of change in ICC values. Patterns in the matrix for DVARS are similar to those in that of projection scrubbing except without the marked improvements for the intra-left hemisphere connections, while matrices for the other projection scrubbing methods look very similar to the matrix for ICA projection scrubbing including this quirk. (C) Matrix of reduction in median absolute error (MAE) across subjects for the validity analysis. Note that warmer colors indicate a reduction in MAE, meaning higher validity, so warm colors represent an improvement and cool colors represent a worsening. (For interpretation of the references to colour in this figure legend, the reader is referred to the web version of this article.)
Fig. F.14.
Fig. F.14.. Expanded comparison of the effect of scrubbing on fingerprinting success.
This plot includes PCA and FusedPCA projection scrubbing, which perform similarly to ICA projection scrubbing. An exception is that PCA and FusedPCA projection scrubbing appear to benefit fingerprinting using the somatomotor network, while ICA projection scrubbing appears to have no effect.
Fig. G.15.
Fig. G.15.. The benefit of ICA projection scrubbing for reliability is consistent across a variety of denoising baselines.
We estimate FC after applying five different denoising strategies: detrending only (DCT4), aCompCor with five components per ROI (CC5), aCompCor with two components plus six RPs (CC2+MP6, discussed in the main text), the 9 parameter model (9P), and the 36 parameter model (36P). All denoising strategies are regression-based, and the latter four also include the four DCT bases for detrending. The mean ICCs across connections for each denoising method are indicated by black horizontal lines. Then, FC estimation is repeated while combining each scrubbing method with each denoising method. We use the same cutoffs as in our primary analysis: 3 times the median for projection scrubbing, the dual cutoff for DVARS, 0.3 mm for FD, and 0.2 mm for modFD. The colored vertical lines indicate the change in mean ICC attributable to scrubbing by connecting the mean ICC with scrubbing to the mean ICC without scrubbing, for each baseline and scrubbing method. For example, colored lines that extend upward from a black line indicate an improvement to FC reliability from the respective baseline.
Fig. 1.
Fig. 1.. Illustration of ICA projection scrubbing, which typically removes fewer volumes than motion scrubbing.
The scan shown is HCP subject 111312, visit 2, LR phase encoding, and is a moderate-motion scan (45th quantile of mean FD). Two additional scans (high and low motion) are shown in Appendix A. (A) A “grayplot” or “carpetplot”: the vectorized fMRI data matrix after regression-based denoising (see Section 2.3.3) with time along the x-axis and locations along the y-axis. Lighter colors represent higher BOLD signal. (B) Four different scrubbing measures: FD, modified FD for multiband data, DVARS, and ICA projection scrubbing. Dashed lines indicate selected cutoffs for each method (see Section 3.3). Projection scrubbing and DVARS retain more volumes than motion scrubbing, and this is generally true for subjects in our study. (C-E) ICA projection scrubbing decomposes the fMRI timeseries into ICs, selects ICs corresponding to transient or “burst” noise, and then computes a summary measure across those ICs to flag volumes containing burst noise. The “ICKplot” in (C) shows all noise components; (D) shows the timecourses for a few selected noise ICs (in blue). A non-selected IC is shown in green for comparison. Spatial maps for each IC in (E) illustrate that the selected ICs tend to represent artifacts rather than neural signals. All four selected ICs exhibit moderate or large deviations in their timecourses when leverage surpasses the threshold, suggesting the presence of global abnormalities manifested across multiple artifactual patterns at these timepoints. (For interpretation of the references to colour in this figure legend, the reader is referred to the web version of this article.)
Fig. 2.
Fig. 2.. Schaefer cortical parcellation and Freesurfer cerebellar and subcortical parcellation.
The 400 cortical parcels are outlined in black and grouped into 8 cortical networks. Groupings of cerebellar and subcortical structures are indicated using color gradients. Note that all cerebellar and subcortical regions except the brainstem are separated into left and right hemisphere in our analysis.
Fig. 3.
Fig. 3.. Simultaneous regression framework for nuisance regression and scrubbing.
(A) Calculation of scrubbing measures. FD is calculated from the RPs, while projection scrubbing and DVARS are calculated from the fMRI data after a preliminary nuisance regression. The design matrix for the preliminary nuisance regression includes DCT bases (yellow) which remove low-frequency trends, as well as a combination of noise components (orange) such as aCompCor bases, the RPs, noise ICs, and/or the global signal, depending on the selected denoising method. Data-driven scrubbing measures are computed from the nuisance-regressed data (blue brain) rather than the minimally preprocessed data (gray brain) in order to provide a lower noise floor for easier identification of severe, transient artifacts not already eliminated by nuisance regression. (B) Inclusion of scrubbing in the regression model. The final cleaned data are obtained with a single nuisance regression that includes spike regressors for each volume flagged by the selected scrubbing method, in addition to the original nuisance regressors. The final nuisance regression is performed on the original data (gray brain), rather than the data after preliminary denoising (blue brain), to avoid issues associated with modular or sequential preprocessing. Thus our processing framework performs detrending, denoising, and scrubbing simultaneously. Note that this is equivalent to censoring flagged volumes from the data and design matrix prior to nuisance regression, but is not equivalent to censoring the residuals after an initial nuisance regression. (For interpretation of the references to colour in this figure legend, the reader is referred to the web version of this article.)
Fig. 4.
Fig. 4.. CC2+MP6 yields the highest reliability across the connectome, while preserving temporal degrees of freedom.
(A) Average ICC of functional connectivity (FC) estimates across subjects and sessions for different denoising strategies, from left to right: minimally preprocessed (MPP), four DCT bases (DCT4), aCompCor with two components per noise ROI (CC2) plus six RPs (CC2+6MP), and the 36 parameter model (36P). CC2+6MP and 36P both include DCT detrending. Higher ICC values indicate more reliable FC estimates. The top halves of the matrices represent the mean ICC values for each network pair, i.e. for each corresponding region in the lower triangles. (B) The mean ICC across all functional connections for each denoising method. All methods include DCT detrending except MPP and ICA-FIX. CC2+MP6 and CC2+MP24 both achieve the highest reliability, while CC2+MP6 maintains many more degrees of freedom, and so we adopt it as the baseline denoising strategy for subsequent analyses. (C) The mean ICC of FC estimates across all connections involving each parcel or subcortical structure, for the CC2+MP6 denoising method.
Fig. 5.
Fig. 5.. Grayplots for different denoising strategies for three example sessions.
The example sessions represent a range of head motion levels and are the same as those shown in Fig. 1 and Appendix Figs. A.1 and A.2. Horizontal bands on the grayplots indicate local low-frequency variation, while vertical bands indicate global high-frequency variation. 36P clearly eliminates the latter more than other methods due to inclusion of global signal components. 32P is a version of 36P without any global signal components. Among the methods that do not remove the global signal, CC2+MP6, CC2+MP24 and 32P all appear to achieve similar reductions of both low- and high-frequency noise based on visual inspection.
Fig. 6.
Fig. 6.. Effect of different scrubbing methods on MAC.
We compare the effect of projection scrubbing, motion scrubbing, and DVARS on mean absolute change (MAC) in functional connectivity. MAC is measured relative to random removal of the same number of volumes. At a fixed censoring rate, higher MAC is thought to indicate more effective scrubbing because it suggests more efficient removal of the influence of noise. Since MAC increases monotonically with higher censoring rates, it should not be used to compare across different censoring rates or to choose a scrubbing threshold. To facilitate method comparisons at the same censoring rate, we show results for all candidate thresholds that remove 1% to 10% of volumes, on average. The x-axis is on a log scale. Because projection scrubbing tends to retain more volumes than motion scrubbing, this means that here, in order to compare across methods at higher censoring rates (near 10%), we include a threshold of 2× for projection scrubbing, more stringent than is generally recommended. At these higher censoring rates, modFD has higher MAC than projection scrubbing, suggesting that more aggressive censoring with projection scrubbing may not be beneficial over motion scrubbing. At the lower censoring rates typically seen with data-driven scrubbing (below 5%), however, projection scrubbing with any projection method has higher MAC than motion scrubbing or DVARS, suggesting it best improves the signal-to-noise ratio.
Fig. 7.
Fig. 7.. Comparison of scrubbing thresholds for several example sessions.
Nine example sessions are shown, representing the 10th to 90th quantiles of head motion. For FD and modFD, thresholds of 0.2 mm, 0.3 mm, 0.4 mm and 0.5 mm are shown. For projection scrubbing, thresholds of 3, 4 and 5 times the median leverage are shown. Based on these results, in subsequent analyses we adopt thresholds of 0.2 mm for modFD, 0.3 mm for FD, and 3× for projection scrubbing. These results show that standard FD is noisy and inflated and largely fails to capture spikes in head motion that are apparent with lagged and filtered FD, in agreement with prior work. These results also show common discrepancies between the modFD timeseries and actual abnormalities in the data occurring near head motion, seen as spikes in projection scrubbing leverage.
Fig. 8.
Fig. 8.. Effect of scrubbing on validity of FC.
The reduction in root mean squared error (RMSE) of FC after motion scrubbing (based on modFD), ICA projection scrubbing, and DVARS. The selected thresholds based on Fig. 7 are highlighted on the x-axis. Positive values indicate greater reductions in RMSE and better validity, i.e. lower sampling variability due to removal of noise and retention of signal. Negative values indicate increased RMSE and worse validity, i.e. higher sampling variability of FC estimates due to removal of signal. FC estimates for each subject are based on 10 minutes of resting-state data, and RMSE is computed relative to “ground truth” FC based on 1.7 hours of data and stringent motion scrubbing. Each line indicates a subject, colored based on their mean FD: low (<0.15 mm), mid (0.15–0.2 mm), and high (>0.2 mm). Four subjects (gray dashed lines) are excluded from the boxplots due to insufficient data remaining after motion scrubbing. Note that this slightly biases the boxplots in favor of motion scrubbing, since data-driven scrubbing actually slightly improves validity for those subjects while motion scrubbing tended to worsen them. Stringent motion scrubbing (modFD 0.2 mm) worsens validity of FC for most subjects, sometimes dramatically, more lenient motion scrubbing (e.g. modFD 0.5 mm) is slightly beneficial to validity on average, and data-driven scrubbing does not tend to dramatically change validity.
Fig. 9.
Fig. 9.. Effect of different scrubbing thresholds on censoring rates and reliability of FC.
(A) Motion scrubbing: FD and modFD cutoffs between 0.2 and 0.8 mm are shown, with the selected thresholds of modFD = 0.2 mm and FD = 0.3 mm highlighted. At the selected thresholds, FD censors approximately 12% of volumes on average, while modFD censors approximately 18% of volumes; FD decreases ICC slightly, while modFD causes a much larger decrease in ICC. (B) Projection scrubbing: cutoffs between 2 and 8 times the median leverage are shown, with the selected threshold of 3× highlighted. Projection scrubbing retains many more volumes than motion scrubbing, censoring only 2.6 to 3.3% of volumes on average, depending on the projection method. This is similar to DVARS, which censors 2.4% of volumes on average. At the selected thresholds, ICA projection scrubbing and DVARS both increase ICC slightly. We consider increases in ICC due to scrubbing as uniformly beneficial, while the reductions in ICC seen with motion scrubbing may be due to loss of reliable signal, the removal of reliable noise, or both. (C) Relationship between censoring rate and ICC. Note that censoring rate is displayed on the log scale. For each method, we show all cutoffs at or above the selected one, indicated with larger dots. Quadratic fits and their 95% confidence interval are overlaid. At lower censoring rates (2% or less), both motion scrubbing and projection scrubbing increase ICC. At the selected thresholds, projection scrubbing and FD have a similar effect on ICC, but FD results in much higher censoring rates. modFD has the highest censoring rates and drastically reduces ICC.
Fig. 10.
Fig. 10.. Scrubbing slightly improves most fingerprinting match rates.
Fingerprinting was performed using all connections or only the connections within each network. (A) Baseline fingerprinting match rates, with networks sorted from most successful fingerprinting to least successful. All match rates are much higher than the success rate of random guesses (1 in 42, or less than 3%). (B) Change in fingerprinting match rates due to scrubbing, sorted by the baseline rates of fingerprint success. The effects of scrubbing are generally small in magnitude, perhaps because changes in FC tend to be subtle and may not cause a change in subject-to-subject matching. Scrubbing generally benefits network-wise fingerprinting, with projection scrubbing being most beneficial for cortical networks and DVARS being most beneficial for subcortical regions. Scrubbing generally worsens fingerprinting based on all connections, suggesting a differential effect of scrubbing on within-network and between-network connections. Note that worse fingerprinting match rate may not always indicate loss of true signal, since removal of reliable noise can also reduce reliability. However, increases in fingerprinting match rate due to scrubbing can safely be interpreted as more effective noise removal and signal retention.
Fig. 11.
Fig. 11.. Agreement between scrubbing methods.
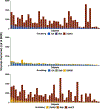
The number of volumes flagged by ICA projection scrubbing, motion scrubbing and DVARS for each of 42 subjects. Cross-hatched areas indicate volumes flagged by both methods. Subjects are ordered by the number of volumes flagged by the method listed first in each panel’s legend. Motion scrubbing tends to flag many more volumes compared with projection scrubbing or DVARS. Both data-driven scrubbing methods identify additional volumes where modFD is not elevated, which may indicate sensitivity to artifacts associated with lagged effects of head motion or non-motion-related sources. Agreement between ICA projection scrubbing and DVARS is moderate but not perfect, which suggests spatial differences in their sensitivity to artifacts.
Fig. 12.
Fig. 12.. Examples of projection scrubbing and motion scrubbing.
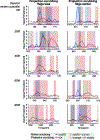
Five sessions representing a range of head motion (5th to 90th quantiles of mean FD) are shown. The left column shows instances where projection scrubbing flags volumes coincident with head motion but identifies fewer volumes than modFD. These examples illustrate that projection scrubbing often identifies artifacts induced by head motion but may do so with greater specificity than modFD. The right column shows examples where leverage flags volumes just before a spike in modFD. Recall that modFD is based on 4-back temporal differences, which may cause lagged sensitivity to motion artifact in some cases. These examples suggest that projection scrubbing may also be more sensitive to certain effects of motion than modFD.
Fig. 13.
Fig. 13.. Motion scrubbing results in high rates of run exclusion.
Histograms show the distribution of minutes remaining in each run after scrubbing. Note the square-root scale on the y-axis. Based on a rule that all runs must retain at least 10 minutes of data after scrubbing (dashed line), motion scrubbing with modFD at the 0.2 mm threshold would exclude 66 runs or 20% of the 336 total runs. Both projection scrubbing and DVARS would leave every run with at least 10 minutes of data, resulting in no exclusions.

References

    1. Afyouni S, Nichols TE, 2018. Insight and inference for DVARS. Neuroimage 172, 291–312. doi:10.1016/j.neuroimage.2017.12.098. http://www.sciencedirect.com/science/article/pii/S1053811917311229. - DOI - PMC - PubMed
    1. Agrawal U, Brown EN, Lewis LD, 2020. Model-based physiological noise removal in fast fMRI. Neuroimage 205, 116231. doi:10.1016/j.neuroimage.2019.116231. http://www.sciencedirect.com/science/article/pii/S1053811919308225 - DOI - PMC - PubMed
    1. Allen EA, Erhardt EB, Damaraju E, Gruner W, Segall JM, Silva RF, Havlicek M, Rachakonda S, Fries J, Kalyanam R, et al., 2011. A baseline for the multivariate comparison of resting-state networks. Front. Syst. Neurosci. 5, 2. - PMC - PubMed
    1. Behzadi Y, Restom K, Liau J, Liu TT, 2007. A component based noise correction method (compcor) for BOLD and perfusion based fmri. Neuroimage 37 (1), 90–101. doi:10.1016/j.neuroimage.2007.04.042. http://www.sciencedirect.com/science/article/pii/S1053811907003837. - DOI - PMC - PubMed
    1. Bianciardi M, Fukunaga M, van Gelderen P, Horovitz SG, de Zwart JA, Shmueli K, Duyn JH, 2009. Sources of functional magnetic resonance imaging signal fluctuations in the human brain at rest: a 7t study. Magn. Reson. Imag. 27 (8), 1019–1029. doi:10.1016/j.mri.2009.02.004. http://www.sciencedirect.com/science/article/pii/S0730725X09000599. - DOI - PMC - PubMed

Publication types