. 2023 Apr:515:113443.
doi: 10.1016/j.jim.2023.113443. Epub 2023 Feb 24.

An optimized flow cytometry protocol for simultaneous detection of T cell activation induced markers and intracellular cytokines: Application to SARS-CoV-2 immune individuals

Affiliations

An optimized flow cytometry protocol for simultaneous detection of T cell activation induced markers and intracellular cytokines: Application to SARS-CoV-2 immune individuals

Tiziana Altosole et al. J Immunol Methods. 2023 Apr.

Abstract

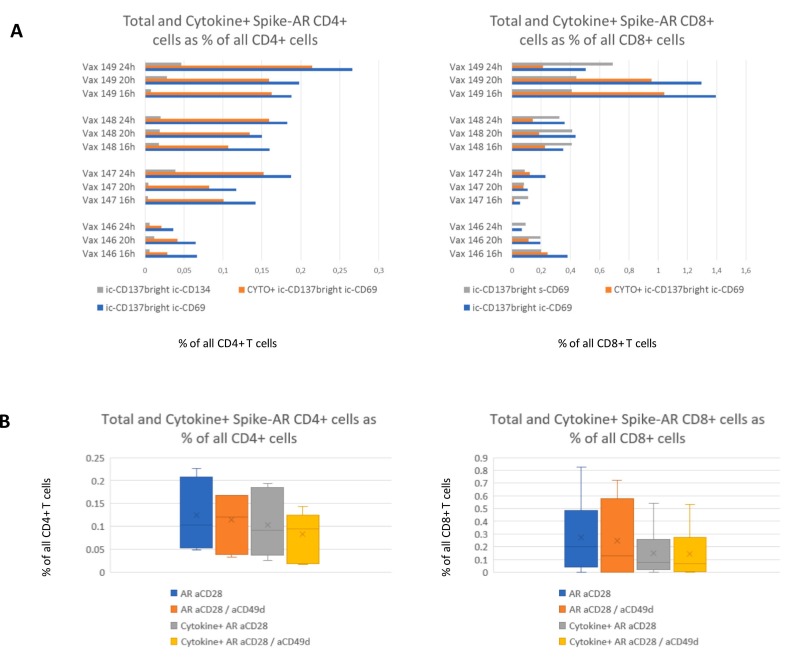
Antigen (ag)-specific T cell analysis is an important step for investigation of cellular immunity in many settings, such as infectious diseases, cancer and vaccines. Multiparameter flow cytometry has advantages in studying both the rarity and heterogeneity of these cells. In the cellular immunologist's toolbox, the expression of activation-induced markers (AIM) following antigen exposure has made possible the study and sorting of ag-specific T cells without using human leukocyte antigen (HLA)-multimers. In parallel, assessing the cytokine profile of responding T cells would support a more comprehensive description of the ongoing immune response by providing information related to cell function, such as polarization and effector activity. Here, a method and flow cytometry panel were optimized to combine the detection of activated CD4+ and CD8+ T cells in a TCR-dependent manner with the evaluation of cytokine production by intracellular staining, without affecting the positivity of activation markers. In particular, the expression of CD134 (OX40) and CD69 have been tested in conjunction with intracellular (ic) CD137 (4-1BB) to detect SARS-CoV-2 Spike protein-specific activated T cells. In our setting, CD134 provided minimal contribution to detect the pool of AIM+ T cells, whereas a key role was described for ic-CD69 which was co-expressed with ic-CD137 in both CD4+ and CD8+ lymphocytes. Moreover, the analysis of TCR-triggered cytokine-producing T cells (IFNγ, TNFα and IL-2 were assessed) further confirmed the capacity of ic-CD69 to identify functionally responsive antigen-specific T cells which were often largely negative or weakly positive for CD134 expression. In parallel, the use of CD45RA, CCR7 and CXCR5 allowed us to describe the T cell matuarion curve and detect T follicular helper (Tfh) CD4+ cells, including the antigen specific activated subsets. In conclusion, we optimized a method and flow cytometry panel combining assessment of activation induced markers and intracellular cytokines that will be useful for measuring TCR stimulation-dependent activation of CD4+ and CD8+ T cells.

Keywords: Flow cytometry; SARS-Cov-2 vaccine; T cell mediated immunity.


Conflict of interest statement

Declaration of Competing Interest Gianluca Rotta and Scott J. Bornheimer are employees of Becton, Dickinson and Company.

Figures

Fig. 1
Fig. 1
ic-CD69 co-stains with ic-CD137 thus facilitating the measurement of cytokine+ ic-CD137bright CD4+ and CD8+ T lymphocytes. A Exemplary plots showing patterns of ic-CD137, ic/s-CD69, ic/s-CD134, and cytokines on stimulated CD4+ or CD8+ T cells. Rows I and II show ic-CD137+ CD4+ and CD8+ cells co-stained with ic-CD69: in this approach almost all the CD4+ or CD8+ cytokine producing cells are ic-CD69+. Rows III and IV show ic-CD137+ CD4+ cells co-stained with ic/s-CD134 respectively: in this approach the majority of cytokine producing CD4+ cells are ic/s-CD134-. Rows V shows ic-CD137+ CD8+ cells co-stained with s-CD69: in this approach many of the cytokine producing CD8+ cells are s-CD69-. Large dots represent ic-CD137bright cells. B Analysis of concordance of s/ic-CD69 and s/ic-CD134 staining with total ic-CD137bright CD4+ and CD8+ events and their cytokine producing subset. Ic-CD69 is the only marker showing full concordance (Trendline regression slopes =1). Each dot represents a sample: blue dots refer to CD69 staining, orange dots refer to CD134 staining. Four donors have been assessed at three different incubation times. Abbreviations: ic = intracellular; s = surface.
Fig. 2
Fig. 2
Spike-AR CD4+ and CD8+ assessment based on incubation time and co-stimuli. A Graphs represent the percentages of Total and Cytokine+ Spike-AR CD4+ and CD8+ T cells calculated as the difference between stimulated and unstimulated samples. Spike-AR cells have been evaluated based on different activation phenotypes being for CD4+ cells: ic-CD137bright and ic-CD134+ (gray bars, left graph); ic-CD137bright and ic-CD69+ (blue bars, left graph); Cytokine+ ic-CD137bright and ic-CD69+ (orange bar left graph). With regard to CD8+ cells, activation phenotypes were: ic-CD137bright and s-CD69+ (gray bars, right graph); ic-CD137bright and ic-CD69+ (blue bars, right graph), Cytokine+ ic-CD137bright and ic-CD69+ (orange bars, right graph). Cytokine positivity includes Spike-AR cells producing at least one of the three evaluated cytokines: IFNγ, TNFα or IL-2. The use of ic-CD137 and ic-CD69 results in higher percentage of Spike-AR retrieval for both CD4+ and CD8+. Variation in incubation times in the presence of Brefeldin A from 16 to 24 h did not lead to clear trends in the percentage of Spike-AR cells. B Graphs represent the percentage of total and cytokine producing Spike-AR T cells out of CD4+ and CD8+ populations to compare the costimulatory affect of aCD28 only versus aCD28 and aCD49d. The addition of aCD49d does not result in significant changes of Spike-AR events detection, with or without cytokines. Evaluation was performed on four donors, three of which were assessed in duplicate. Abbreviations: AR = Antigen Responding, ic = intracellular; s = surface.
Fig. 3
Fig. 3
Assessment of Spike and CMV-AR T cells and quantification of unstimulated background. A  Graphs represent the evaluation of Spike and CMV-AR T cells in a cohort of ten donors, four of which evaluated in triplicate (Vax 201–202–204-214). AR T cells are calculated as the difference in the percentage of AIM+ elements between stimulated and not stimulated samples. The variations observed in the evaluation of Spike-AR CD8+ T cells are likely due to the limited number of acquired events and by small differences in background and activation status of each evaluation. B Graphs show the consolidated percentages of activated CD4+ and CD8+ (AIM+ and Cytokine+ AIM+) in Spike and CMV stimulated samples versus the unstimulated (aCD28 only) ones for responder donors. All the differences were statistically significant. Cytokine positivity includes cells resulting positive for at least one of the three evaluated cytokines: IFNγ, TNFα or IL-2. Abbreviations: AIM = Activation Induced Markers; AR = Antigen Responding.
Fig. 4
Fig. 4
Quantification of Cytokine production by AIM+ and AR cells. A-B Graphs represent the comparison between AIM+ and AR CD4+ and CD8+ with their cytokine producing counterpart for Spike (A) and CMV (B) stimulation in responder donors. AIM+ CD4+ or CD8+ T cells are reported based on stimulated samples only, whereas Spike-AR T cells and cytokine producing counterpart are calculated as the difference between stimulated and non stimulated samples. Y axes refer to percentage of all CD4+ or CD8+ cells, whereas numbers displayed within the graph bars refer to the percentage of cytokine producing cells among total activated cells. Cytokine positivity includes cells positive for at least one of the three evaluated cytokines: IFNγ, TNFα or IL-2. Abbreviations: AIM = Activation Induced Markers; AR = Antigen Responding.
Fig. 5
Fig. 5
Maturation curve of CD4+ and CD8+ T cells and their AIM+ counterparts. A Graphs represents the percentages of CD4+ and CD8+ T cell subsets defined by surface staining of CD45RA and CCR7. Naïve = CD45RA+, CCR7+; Central Memory (CM) = CD45RA-, CCR7+; Effector Memory (EM) = CD45RA-, CCR7-; Terminally differentiated effector memory (TEMRA) = CD45RA+, CCR7-. The most advanced maturation stage is evident for AIM+ T cells, being mainly effector memory for AIM+ CD4+ T cells and mainly terminally differentiated for AIM+ CD8+ T cells. Data refer to responder donors. B Exemplary plots from two responder donors, showing total and AIM+ CD4+ and CD8+ maturation curve and gate positioning. Abbreviations: AIM = Activation Induced Markers.
Fig. 6
Fig. 6
Quantification of Tfh in stimulated and unstimulated responder samples to Spike and CMV. A Increase of Tfh AIM+ CD4+ cells as % of all CD4+ cells in stimulated and unstimulated samples from responder donors: single donor view. Eight Spike stimulated samples out of nine, and two CMV stimulated samples out of five are showing a clear increase. B Increase of Tfh AIM+ CD4+ cells as % of all CD4+ cells in stimulated and unstimulated samples from responder donors: consolidated view. The differences are statistically significant. Abbreviations: AIM = Activation Induced Markers; Tfh = T follicular helper.

References

    1. Aiello A., et al. Spike is the most recognized antigen in the whole-blood platform in both acute and convalescent COVID-19 patients. Int. J. Infect. Dis. 2021;106:338–347. - PMC - PubMed
    1. Altman J.D., et al. Phenotypic analysis of antigen-specific T lymphocytes. Science (80-.) 1996;274:94–96. - PubMed
    1. Appay V., Douek D.C., Price D.A. CD8+ T-cell differentiation in response to viruses. Nat. Med. 2008;14 - PubMed
    1. Bacher P., Scheffold A. Flow-cytometric analysis of rare antigen-specific T cells. Cytom. A. 2013;83:692–701. - PubMed
    1. Betts M.R., et al. Sensitive and viable identification of antigen-specific CD8+ T cells by a flow cytometric assay for degranulation. J. Immunol. Methods. 2003;281:65–78. - PubMed