Clinical Trial
. 2023 Mar 24;41(13):2184-2197.
doi: 10.1016/j.vaccine.2023.02.057. Epub 2023 Feb 23.

A randomized phase I/II safety and immunogenicity study of the Montanide-adjuvanted SARS-CoV-2 spike protein-RBD-Fc vaccine, AKS-452

Affiliations
Clinical Trial

A randomized phase I/II safety and immunogenicity study of the Montanide-adjuvanted SARS-CoV-2 spike protein-RBD-Fc vaccine, AKS-452

Eline A Feitsma et al. Vaccine. .

Abstract

Background: Previous interim data from a phase I study of AKS-452, a subunit vaccine comprising an Fc fusion of the respiratory syndrome coronavirus 2 (SARS-CoV-2) spike protein receptor binding domain (SP/RBD) emulsified in the water-in-oil adjuvant, Montanide™ ISA 720, suggested a good safety and immunogenicity profile in healthy adults. This phase I study was completed and two dosing regimens were further evaluated in this phase II study.

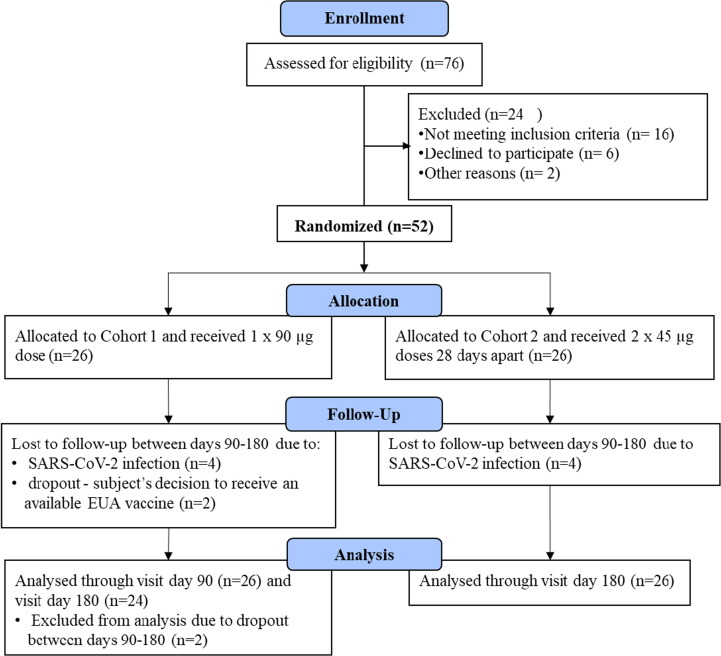
Methods: This phase II randomized, open-labelled, parallel group study was conducted at a single site in The Netherlands with 52 healthy adults (18 - 72 years) receiving AKS-452 subcutaneously at one 90 µg dose (cohort 1, 26 subjects) or two 45 µg doses 28 days apart (cohort 2, 26 subjects). Serum samples were collected at the first dose (day 0) and at days 28, 56, 90, and 180. Safety and immunogenicity endpoints were assessed, along with induction of IgG isotypes, cross-reactive immunity against viral variants, and IFN-γ T cell responses.

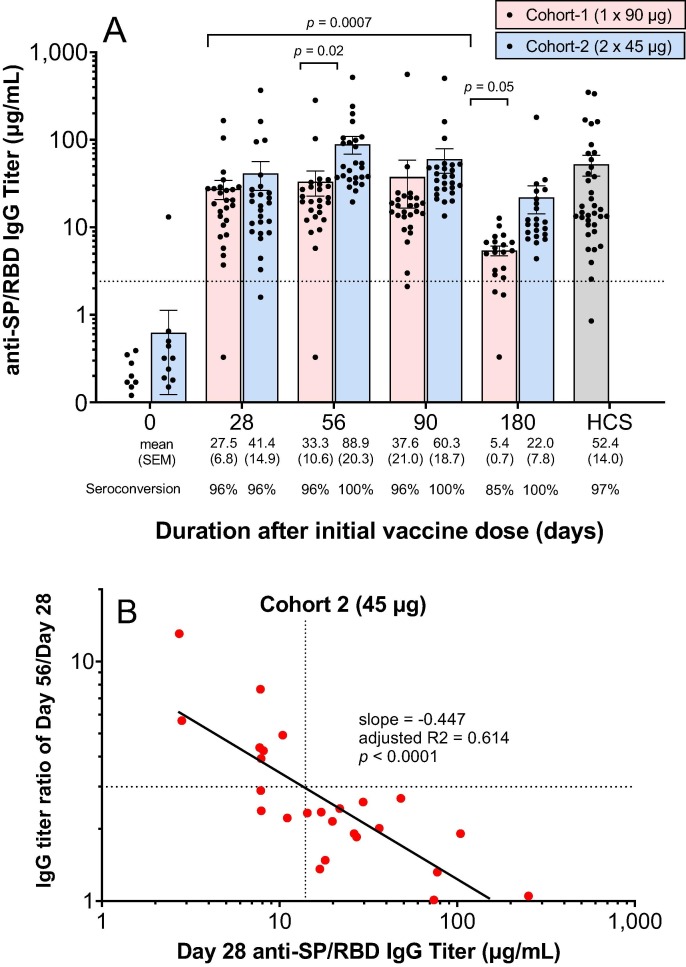
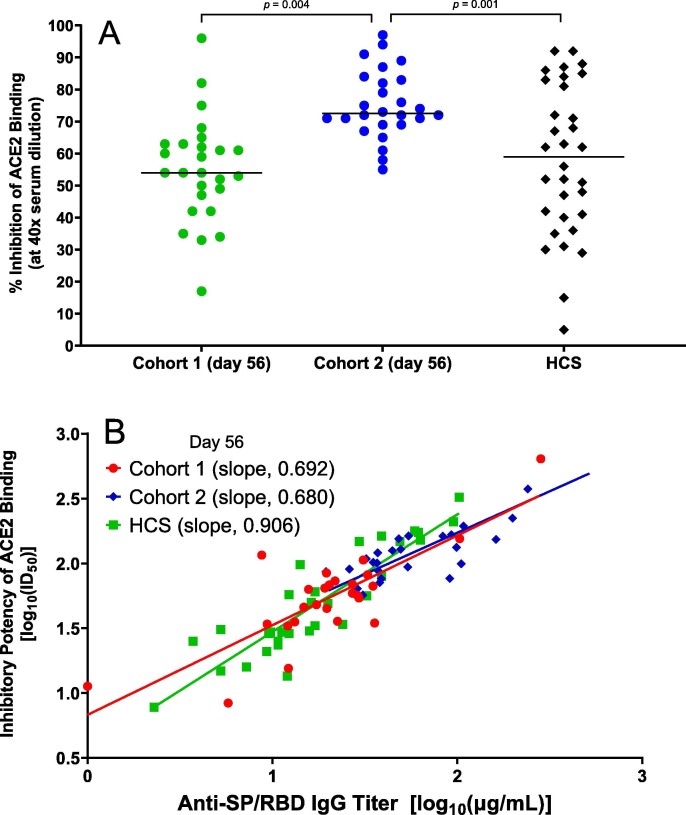
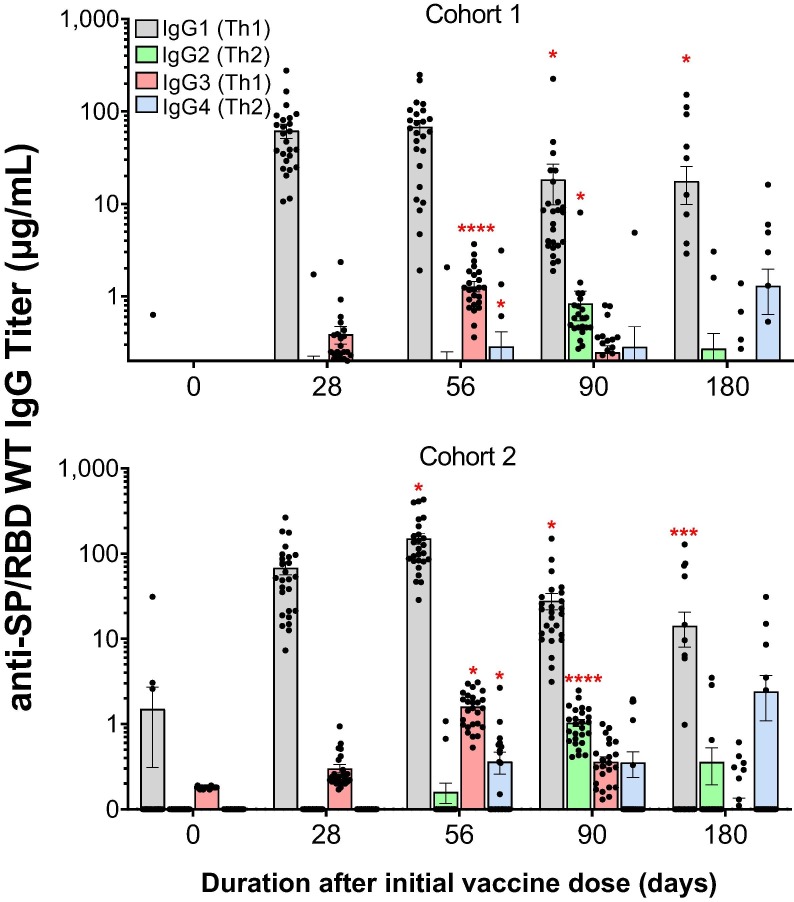
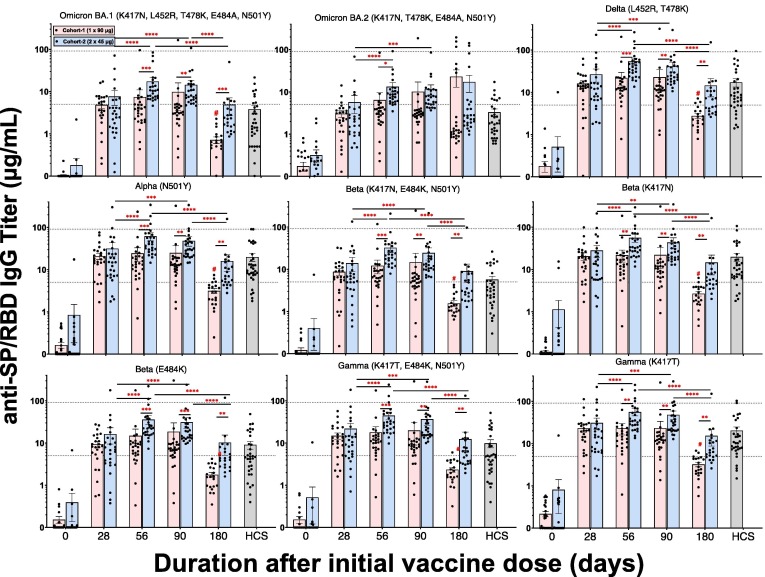
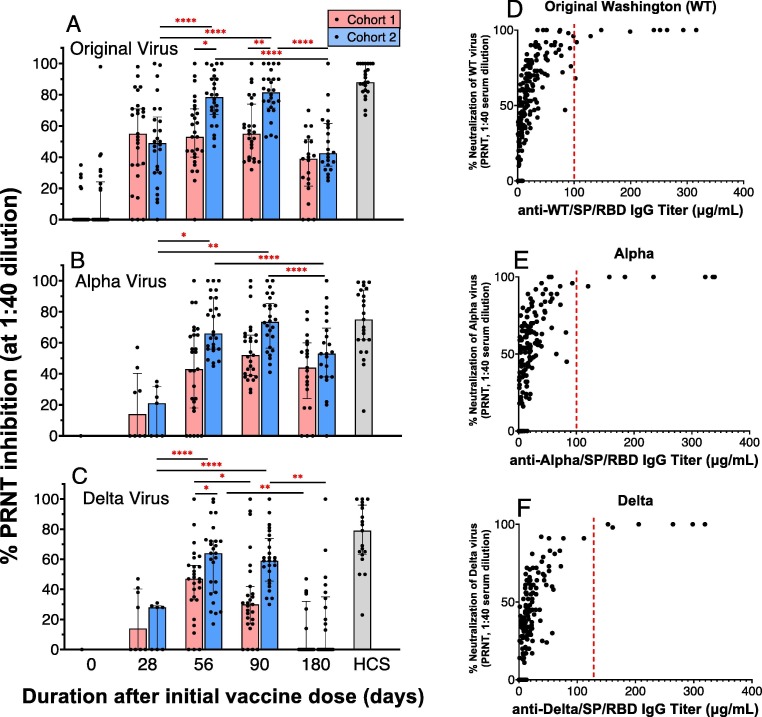
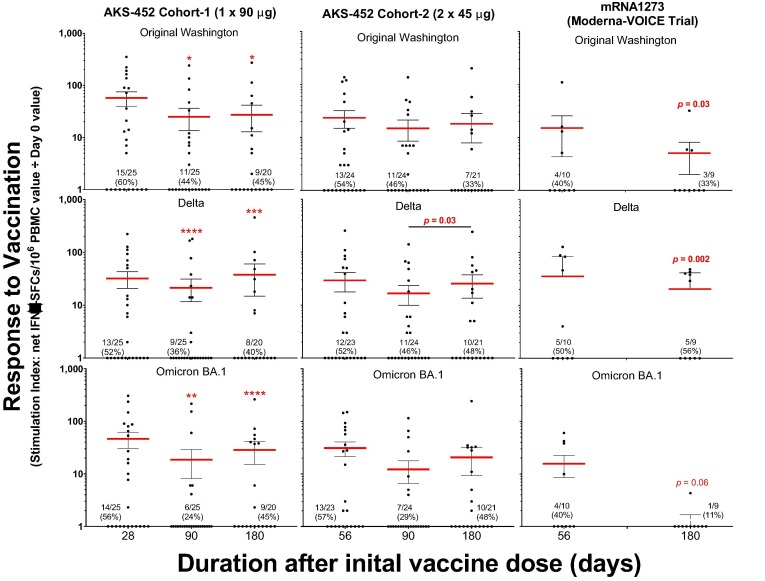
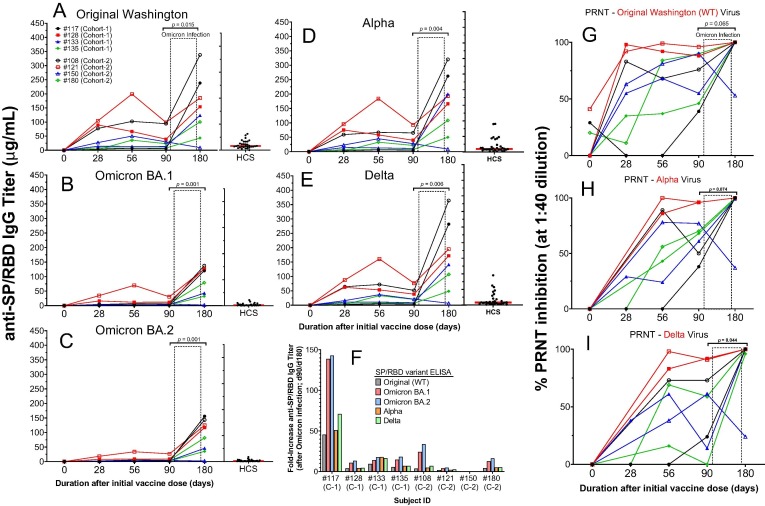
Results: All AEs were mild/moderate (grades 1 or 2), and no SAEs were attributable to AKS-452. Seroconversion rates reached 100% in both cohorts, although cohort 2 showed greater geometric mean IgG titers that were stable through day 180 and associated with enhanced potencies of SP/RBD-ACE2 binding inhibition and live virus neutralization. AKS-452-induced IgG titers strongly bound mutant SP/RBD from several SARS-CoV-2 variants (including Omicrons) that were predominantly of the favorable IgG1/3 isotype and IFN-γ-producing T cell phenotype.

Conclusion: These favorable safety and immunogenicity profiles of the candidate vaccine as demonstrated in this phase II study are consistent with those of the phase I study (ClinicalTrials.gov: NCT04681092) and suggest that a total of 90 µg received in 2 doses may offer a greater duration of cross-reactive neutralizing titers than when given in a single dose.

Keywords: AKS-452; COVID-19; Coronavirus; Fc-fusion; Infectious disease; Pandemic; Phase 2; Prophylaxis; SARS-CoV-2; Vaccine.


Conflict of interest statement

Declaration of Competing Interest The authors declare that they have no known competing financial interests or personal relationships that could have appeared to influence the work reported in this paper.

Figures

Fig. 1
Fig. 1
AKS-452 Phase II clinical study design. Phase II was a 2 × 26 design; i.e., Cohort 1 was a single-dose (90 µg) and Cohort 2 was a two-dose (45 µg) regimen in which subjects were enrolled and dosed concurrently. The dosing regimens were based on safety and immunogenicity outcomes of the interim results of the phase I study .
Fig. 2
Fig. 2
AKS-452 immunogenicity: IgG titers. (A) Serum samples were obtained at Days 0, 28, 56, 90 and 180 of the initial vaccine dose and assessed for anti-SP/RBD IgG binding titers via ELISA and presented per subject (all Day 0 samples were < lower limit of quantitation; not shown). Seroconversion was defined as > 2.42 µg/mL IgG (dotted line; derived from validation studies with COVID-19 naïve subject samples; see Methods). HCS titers were used as a comparator for samples from vaccinated subjects. Statistical comparisons between mean values of study day within each cohort and between cohorts were performed using a model with “cohort” and “day” values as fixed effects and a “random subject effect” in which p values were adjusted for multiplicity (Tukey). (B) Correlation between subject’s responsiveness to the second dose (day 56 titer divided by day 28 titer) and the titer on the day of the second dose (i.e., day 28). The dotted lines delineate the approximate day 28 titer that is correlated with a 3-fold response to the second dose at day 56. The solid black line is the linear regression of log-transformed values.
Fig. 3
Fig. 3
AKS-452 immunogenicity:inhibitory potency and IgG Isotype titers. (A) Serum samples were obtained at Day 56 after the initial vaccine dose and assessed at a 1:40 dilution for % Inhibition of recombinant human ACE2 binding to SP/RBD via ELISA and presented per subject (all Day 0 samples were < lower limit of quantitation; not shown). Statistical comparisons between cohorts were performed using a model with “cohort” as a fixed effect in which p-values were not adjusted for multiplicity. (B) Comparison of IgG titer vs. inhibitory potency (inhibitory dilution 50% in ACE2 binding assay, ID50) of Day 56 sera for vaccinated subjects and HCS. Linear regression was performed on log-transformed data; adjusted r2 0.638, p < 0.0001 (cohort 1), adjusted r2 0.680, p ≤ 0.0001 (cohort 2), adjusted r2 0.803, p ≤ 0.0001 (HCS).
Fig. 4
Fig. 4
AKS-452 immunogenicity kinetics and IgG Isotype titers. Serum samples were obtained at Days, 0, 28, 56, 90, and 180 from the initial vaccine dose from all subjects in cohort 1 (1 × 90 µg) and cohort 2 (2 × 45 µg) and assessed for anti-SP/RBD IgG isotype titers via isotype-specific ELISAs (mean µg/mL ± SEM). *, p ≤ 0.05; ***, p ≤ 0.001; ****, p ≤ 0.0001; 2-tailed t-test (GraphPad Prism).
Fig. 5
Fig. 5
AKS-452 IgG titers against SARS-Cov-2 viral variants. Serum samples were obtained at Day 0, 28, 56, 90, and 180 from the initial vaccine dose from Cohorts 1 and 2 and assessed for IgG binding titers against SP/RBD from different SARS-CoV-2 variants via ELISA and presented per subject with mean ± SEM per cohort. For comparison, the dotted reference lines denote the highest and lowest mean titers from the Original Washington WT strain (see Fig. 2). HCS from unvaccinated individuals during the first wave of SARS-CoV-2 infection (i.e., Original Washington strain) was used as a comparator to samples from vaccinated subjects. For each viral variant, statistical comparisons between days “within a cohort” and “between cohorts” were performed using a model entailing “cohort” and “day” values as fixed effects and a “random subject effect” using log-transformed values in which p values were adjusted for multiplicity (Tukey-Kramer). *, p ≤ 0.05; **, p ≤ 0.01; ***, p ≤ 0.001; ****, p ≤ 0.0001; #, p ≤ 0.0001 vs. Cohort 1 days 28, 56, or 90.
Fig. 6
Fig. 6
AKS-452 serum neutralization of live virus, Plaque Reduction Neutralization Test (PRNT). Serum samples from Cohorts 1 (one 90 µg dose) and 2 (two 45 µg doses) obtained on Days, 0, 28, 56, 90, and 180 of initial vaccine dose were assessed for % neutralization (at 1:40 dilution of serum) of the Original Washington (A), Alpha (B) and Delta (C) live virus strains to infect live VERO E6 cells via the PRNT. For each viral variant (panels A, B, C), statistical comparisons between days “within a cohort” and “between cohorts” were performed using model entailing “cohort” and “day” values as fixed effects and a “random subject effect” using untransformed values in which p values were adjusted for multiplicity (Tukey-Kramer). *, p ≤ 0.05; **, p ≤ 0.01; ***, p ≤ 0.001; ****, p ≤ 0.0001. PRNT potency values were compared to IgG titers against the respective viral strain SP/RBD (D, E, F) to determine the IgG titer cutoff (∼100 µg/mL) that defined a consistent 100% viral neutralization (red dotted line). (For interpretation of the references to colour in this figure legend, the reader is referred to the web version of this article.)
Fig. 7
Fig. 7
AKS-452 PBMC assessment of SP/RBD-specific T cell responses via IFN-γ ELISPOT assay. The IFN-γ ELISPOT assay was used to quantitate the frequency of SP/RBD-specific IFN-γ-producing T cells in PBMC samples stimulated by the SP/RBD of Original Washington, Delta, or Omicron SARS-CoV-2 strains. PBMC samples were obtained from subjects who received AKS-452 (cohorts 1 and 2) or mRNA 1273 (Moderna; 2 doses 28 days apart) vaccines collected at days 0, 28 (for cohort 1), 56 (for cohort 2), 90 and 180. For each subject’s sample, the mean of triplicate spot-forming cells (SFCs) of negative control DMSO cultures was subtracted from the mean of triplicate SFCs of SP/RBD-stimulated cultures to generate the net-SFC value. Reported is the ratio (Stimulation Index; SI) of the mean net-SFCs from each post-vaccination day divided by the mean net-SFC of the respective day 0 for each subject’s sample. A “positive responder” sample was defined as having an SI of at least 2 and an increase in the total number of net-SFCs ≥ 25 per 106 PBMCs, and the proportion (and percentage) are reported per cohort per timepoint. For each viral variant, log-transformed SI values of responders (log10 SI values > 1) were subjected to an ANOVA model with “cohort” and “day” as fixed effects and a “random subject effect” in which p values were adjusted for multiplicity (Tukey-Kramer between days within a cohort); *, p ≤ 0.05; **, p ≤ 0.01; ***, p ≤ 0.001; ****, p ≤ 0.0001. Comparisons for day 180 mean SI values among Cohorts 1, 2, and mRNA1273 were evaluated using a correction for multiplicity (Dunnett) that showed no significant differences.
Fig. 8
Fig. 8
Modulation of immunogenicity (IgG titers and neutralization potency) by SARS-CoV-2 Omicron variant infection after day 90 of 8 subjects in the AKS-452 Phase II study. Serum samples were obtained at Day 0, 28, 56, 90, and 180 after the initial vaccine dose from four cohort 1 subjects and four cohort 2 subjects who had acquired SARS-CoV-2 Omicron infection between their day 90 and 180 follow-up visits. Serum samples were assessed for IgG binding titers against SP/RBD from the Original Washington (A), Omicron B.1 (B), Omicron BA.2 (C), Alpha (D), and Delta (E) SARS-CoV-2 strains via ELISA and presented as the mean µg/mL of duplicate tests. The fold-change from day-90 to day-180 titers associated with infection is presented in panel F. Sera were also evaluated for potency to neutralize the Original (G), Alpha (H), and Delta (I) live virus strains from infecting VERO E6 cells via the PRNT. HCS from unvaccinated individuals during the first wave of the SARS-CoV-2 infection (i.e., Original Washington strain) was used as a comparator to samples from vaccinated subjects. For each viral variant and each parameter (IgG titer and PRNT), untransformed values of days 90 and 180 were compared (p values) using an ANOVA model with “day” as a fixed effect and a “random subject effect”.

References

    1. Heaton P.M. The Covid-19 vaccine-development multiverse. N Engl J Med. 2020;383(20):1986–1988. - PMC - PubMed
    1. Karnik M., et al. A review on SARS-CoV-2-induced neuroinflammation, neurodevelopmental complications, and recent updates on the vaccine development. Mol Neurobiol. 2021;58(9):4535–4563. - PMC - PubMed
    1. Baden L.R., et al. Efficacy and safety of the mRNA-1273 SARS-CoV-2 Vaccine. N Engl J Med. 2021;384(5):403–416. - PMC - PubMed
    1. Bos R., et al. Ad26 vector-based COVID-19 vaccine encoding a prefusion-stabilized SARS-CoV-2 Spike immunogen induces potent humoral and cellular immune responses. NPJ Vaccines. 2020;5:91. - PMC - PubMed
    1. Gao Q., et al. Development of an inactivated vaccine candidate for SARS-CoV-2. Science. 2020;369(6499):77–81. - PMC - PubMed

Publication types

Supplementary concepts

Associated data