Review
. 2023 Apr 17;381(2245):20220081.
doi: 10.1098/rsta.2022.0081. Epub 2023 Feb 27.

Pattern formation in Faraday instability-experimental validation of theoretical models

Affiliations
Review

Pattern formation in Faraday instability-experimental validation of theoretical models

B Dinesh et al. Philos Trans A Math Phys Eng Sci. .

Abstract

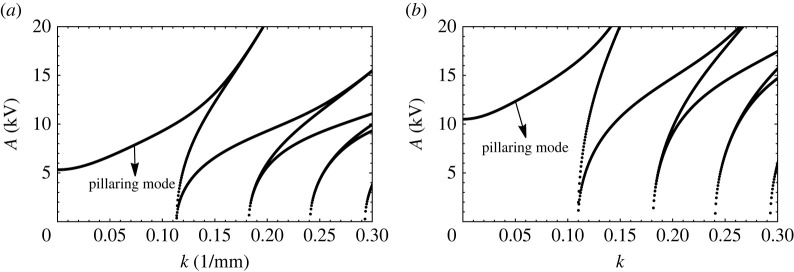
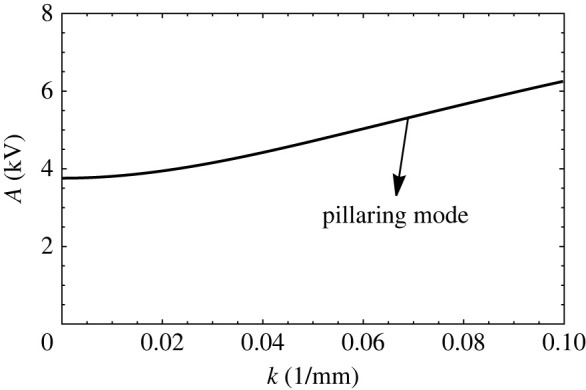
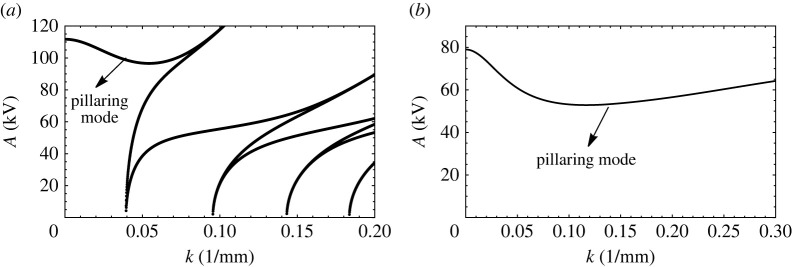
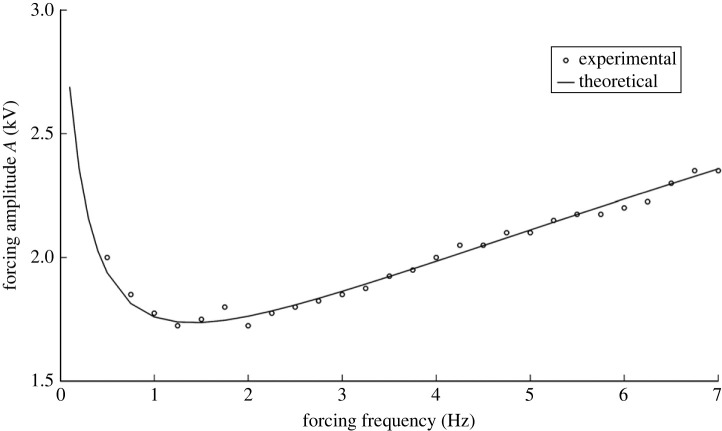
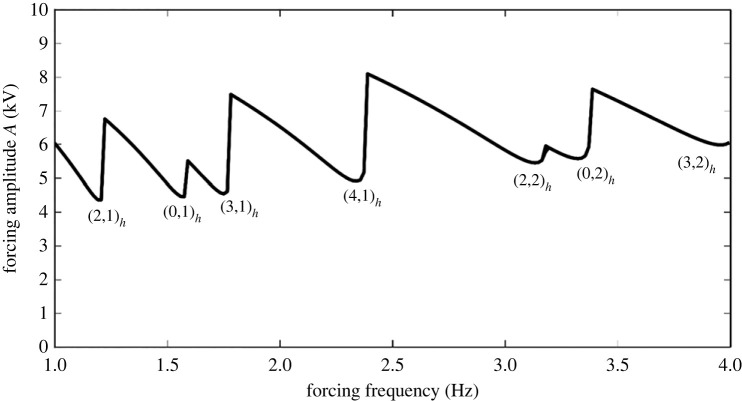
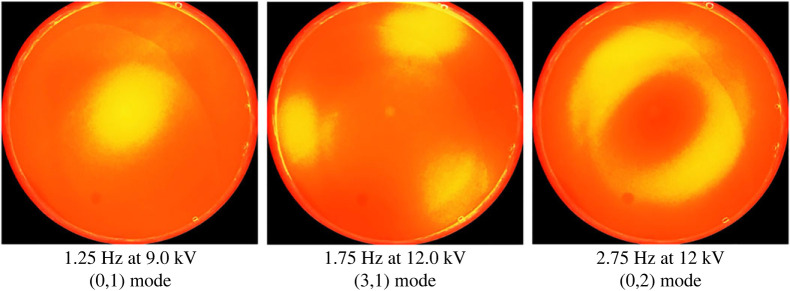
Two types of resonance-derived interfacial instability are reviewed with a focus on recent work detailing the effect of side walls on interfacial mode discretization. The first type of resonance is the mechanical Faraday instability, and the second is electrostatic Faraday instability. Both types of resonance are discussed for the case of single-frequency forcing. In the case of mechanical Faraday instability, inviscid theory can forecast the modal forms that one might expect when viscosity is taken into account. Experiments show very favourable validation with theory for both modal forms and onset conditions. Lowering of gravity is predicted to shift smaller wavelengths or choppier modes to lower frequencies. This is also validated by experiments. Electrostatic resonant instability is shown to lead to a pillaring mode that occurs at low wavenumbers, which is akin to Rayleigh Taylor instability. As in the case of mechanical resonance, experiments show favourable validation with theoretical predictions of patterns. A stark difference between the two forms of resonance is the observation of a gradual rise in the negative detuning instability in the case of mechanical Faraday and a very sharp one in the case of electrostatic resonance. This article is part of the theme issue 'New trends in pattern formation and nonlinear dynamics of extended systems'.

Keywords: Faraday instability; electrostatic Faraday; pattern formation.


Figures

Figure 1.
Figure 1.
Schematic depicting two layers, of heights H1 and H2, subject to vertical oscillations as done in a Faraday experiment. The amplitude of shaking is A, and the frequency is ω. The upper fluid is denoted as fluid 2, and the bottom fluid is denoted as fluid 1.
Figure 2.
Figure 2.
Photographs of discretized standing wave and a wave at breakup slightly post-onset of the instability in a circular cylindrical geometry from [4]. The breakup wave is termed subcritical instability, while the standing wave is supercritical. Reprinted with permission from Cambridge University Press.
Figure 3.
Figure 3.
A plot of q~ versus p~ obtained upon solving the Mathieu equation (2.18) [13]. The plot is generated using the Floquet theory.
Figure 4.
Figure 4.
Amplitude (mm) versus wavenumber (1/mm) obtained from the inviscid theory for an applied frequency of 5 Hz. The physical properties of the fluids and the fluid depths are given in table 1. The first tongue is subharmonic, and the second tongue is harmonic.
Figure 5.
Figure 5.
The critical A versus frequency plot for a bilayer of FC70 and silicone oil ignoring viscosities. Note that the amplitude of forcing is zero for the frequencies: (a) 5.019 Hz and 5.143 Hz and (b) 5.019 Hz and 5.021 Hz. The physical properties of the fluids and the fluid depths are given in table 1. The radius of the Faraday cell is 0.025m.
Figure 6.
Figure 6.
Amplitude (mm) versus wavenumber (1/mm) obtained from viscous theory for an applied frequency of 5 Hz. The physical properties of the fluids and the fluid depths are given in table 1. Note that the Faraday tongues do not touch the x-axis. The first tongue is subharmonic, and the second tongue is harmonic.
Figure 7.
Figure 7.
Comparison of amplitude (cm) versus frequency (Hz) obtained from theory (solid curve) and the experiments (open circles while filled circles represent co-dimension 2 points). The physical properties of the fluids and the fluid depths are given in table 1. The radius of the Faraday cell is 0.025m [4]. Reprinted with permission from Cambridge University Press.
Figure 8.
Figure 8.
Amplitude (mm) versus frequency (Hz) for g=0 and g=9.8 in a rectangular geometry. The physical properties, fluid depths and cell dimensions are given in table 3 (compared with [21]). The first index is the number of half waves in the long direction, and the second index is the number of half waves in the short direction.
Figure 9.
Figure 9.
The waveforms obtained at the interface for (a) g=9.8ms2 and (b) microgravity environments for forcing frequency of about 7 Hz each. Observe the choppiness in the wave structure at microgravity. There are three half waves under 1 g and 14 half waves under microgravity [21]. The physical properties, fluid depths and cell dimensions are given in table 3 (compared with [21]). Reprinted with permission of the publisher.
Figure 10.
Figure 10.
Schematic of electrostatic instability. Here a lighter fluid (silicone oil or fluid 2) lies on top of a heavy fluid (water or fluid 1). An oscillatory potential field, i.e. Acos(ωt), is applied at the bottom plate and a constant DC field, D, is applied at the top plate. Here, water is taken to be a perfect conductor and silicone oil is taken to be a perfect dielectric.
Figure 11.
Figure 11.
Two photographs of electrostatic resonant waves at water–air interface in a petri dish with a metallic bottom. The modal patterns are (a) (2,1) and (b) (0,1). The photographs are due to K. Ward (private communication) and taken at JAXA, Japan. (Online version in colour.)
Figure 12.
Figure 12.
Critical A versus k for a bilayer of water/silicone oil for an applied frequency of 2 Hz and thicknesses of (a) H1=H2=1.27cm and (b) H1=H2=2.54cm. Properties are given in table 4.
Figure 13.
Figure 13.
The critical A versus k plot obtained for a bilayer of water and silicone oil of thicknesses H1=H2=1.27cm in the absence of electrostatic resonance and in the presence of constant potential. Other properties of the fluids are given in table 4.
Figure 14.
Figure 14.
The critical A versus k plot obtained for a bilayer of water and air of thicknesses (a) H1=H2=3.8cm and in the presence of AC electrostatic forcing of frequency 2 Hz (b) in the presence of only DC electrostatic forcing [25]. The physical properties of the fluids are given in table 4.
Figure 15.
Figure 15.
Comparison of theoretical prediction with experiment of onset voltage vs frequency in a silicone oil-water system. Physical properties are given in table 4. The depths of the fluid layers are H1=0.033m and H2=0.005m. The radius of the Faraday cell is 0.0635 m. See Ward et al. [26]. Reprinted with permission from Cambridge University Press.
Figure 16.
Figure 16.
Forcing amplitude A (kV) versus forcing frequency in a bilayer of water and 10 centistoke silicone oil. Each has radius of 25.4 mm and depths of 12.7 mm. Physical properties are given in table 4, where now the kinematic viscosity is 10×106m2s1 and the density is 935kgm3.
Figure 17.
Figure 17.
Experiments of electrostatic Faraday forcing of a bilayer of silicone oil and water—unpublished experiments using a transparent electrode done by co-author J. Livesay and co-workers at the University of Florida. The fluid properties are given in table 4. The fluid depths are 12.4 mm each, and the cell radius is 25.4 mm. (Online version in colour.)

Similar articles

Cited by

References

    1. Faraday M. 1831. On a peculiar class of acoustical figures; and on certain forms assumed by groups of particles upon vibrating elastic surfaces. Phil. Trans. 121, 299-340. (10.1098/rstl.1831.0018) - DOI
    1. Talib E, Jalikop SV, Juel A. 2007. The influence of viscosity on the frozen wave instability: theory and experiment. J. Fluid Mech. 584, 45. (10.1017/S0022112007006283) - DOI
    1. Gaponenko Y, Torregrosa M, Yasnou V, Mialdun A, Shevtsova V. 2015. Interfacial pattern selection in miscible liquids under vibration. Soft Matter 11, 8221-8224. (10.1039/C5SM02110C) - DOI - PubMed
    1. Batson W, Zoueshtiagh F, Narayanan R. 2013. The Faraday threshold in small cylinders and the sidewall non-ideality. J. Fluid Mech. 729, 496-523. (10.1017/jfm.2013.324) - DOI
    1. Benjamin TB, Ursell FJ. 1954. The stability of the plane free surface of a liquid in vertical periodic motion. Proc. R. Soc. Lond. A 225, 505-515. (10.1098/rspa.1954.0218) - DOI