. 2023 Jun;93(6):1158-1172.
doi: 10.1002/ana.26620. Epub 2023 Mar 16.

Change in Cerebrospinal Fluid Tau Microtubule Binding Region Detects Symptom Onset, Cognitive Decline, Tangles, and Atrophy in Dominantly Inherited Alzheimer's Disease

Affiliations

Change in Cerebrospinal Fluid Tau Microtubule Binding Region Detects Symptom Onset, Cognitive Decline, Tangles, and Atrophy in Dominantly Inherited Alzheimer's Disease

Kanta Horie et al. Ann Neurol. 2023 Jun.

Abstract

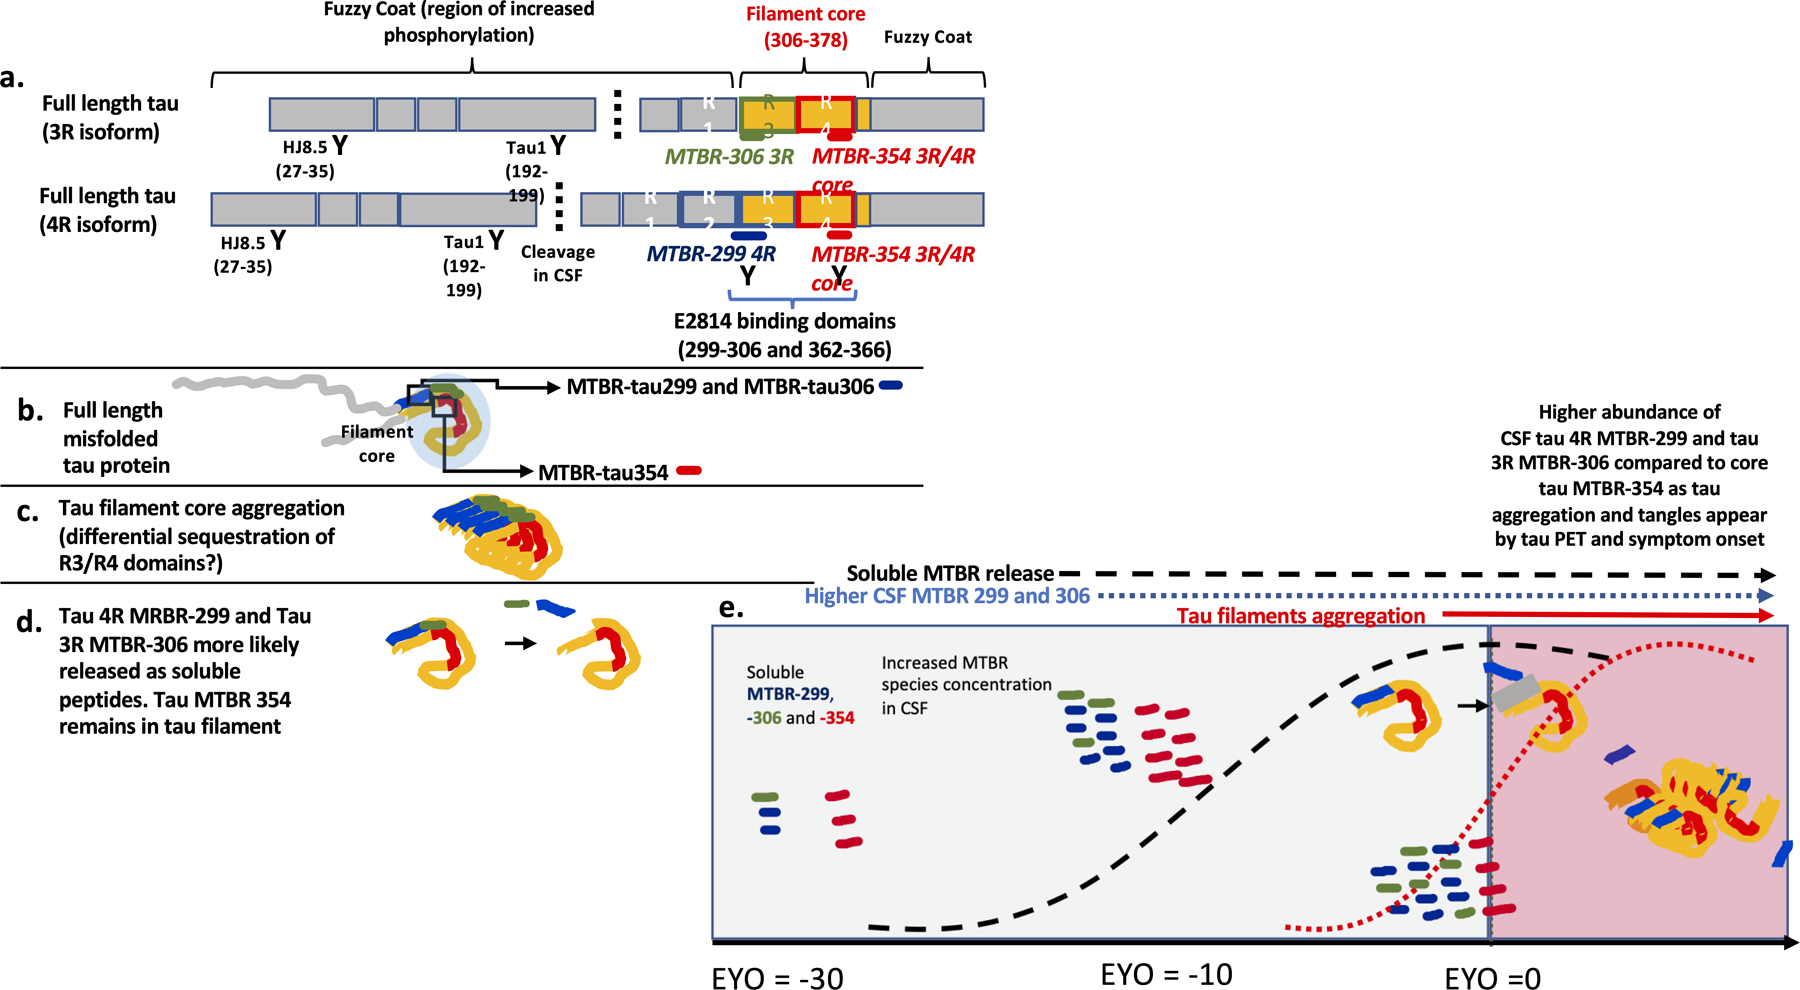
Objective: Identifying cerebrospinal fluid measures of the microtubule binding region of tau (MTBR-tau) species that reflect tau aggregation could provide fluid biomarkers that track Alzheimer's disease related neurofibrillary tau pathological changes. We examined the cerebrospinal fluid (CSF) MTBR-tau species in dominantly inherited Alzheimer's disease (DIAD) mutation carriers to assess the association with Alzheimer's disease (AD) biomarkers and clinical symptoms.

Methods: Cross-sectional and longitudinal CSF from 229 DIAD mutation carriers and 130 mutation non-carriers had sequential characterization of N-terminal/mid-domain phosphorylated tau (p-tau) followed by MTBR-tau species and tau positron emission tomography (tau PET), other soluble tau and amyloid biomarkers, comprehensive clinical and cognitive assessments, and brain magnetic resonance imaging of atrophy.

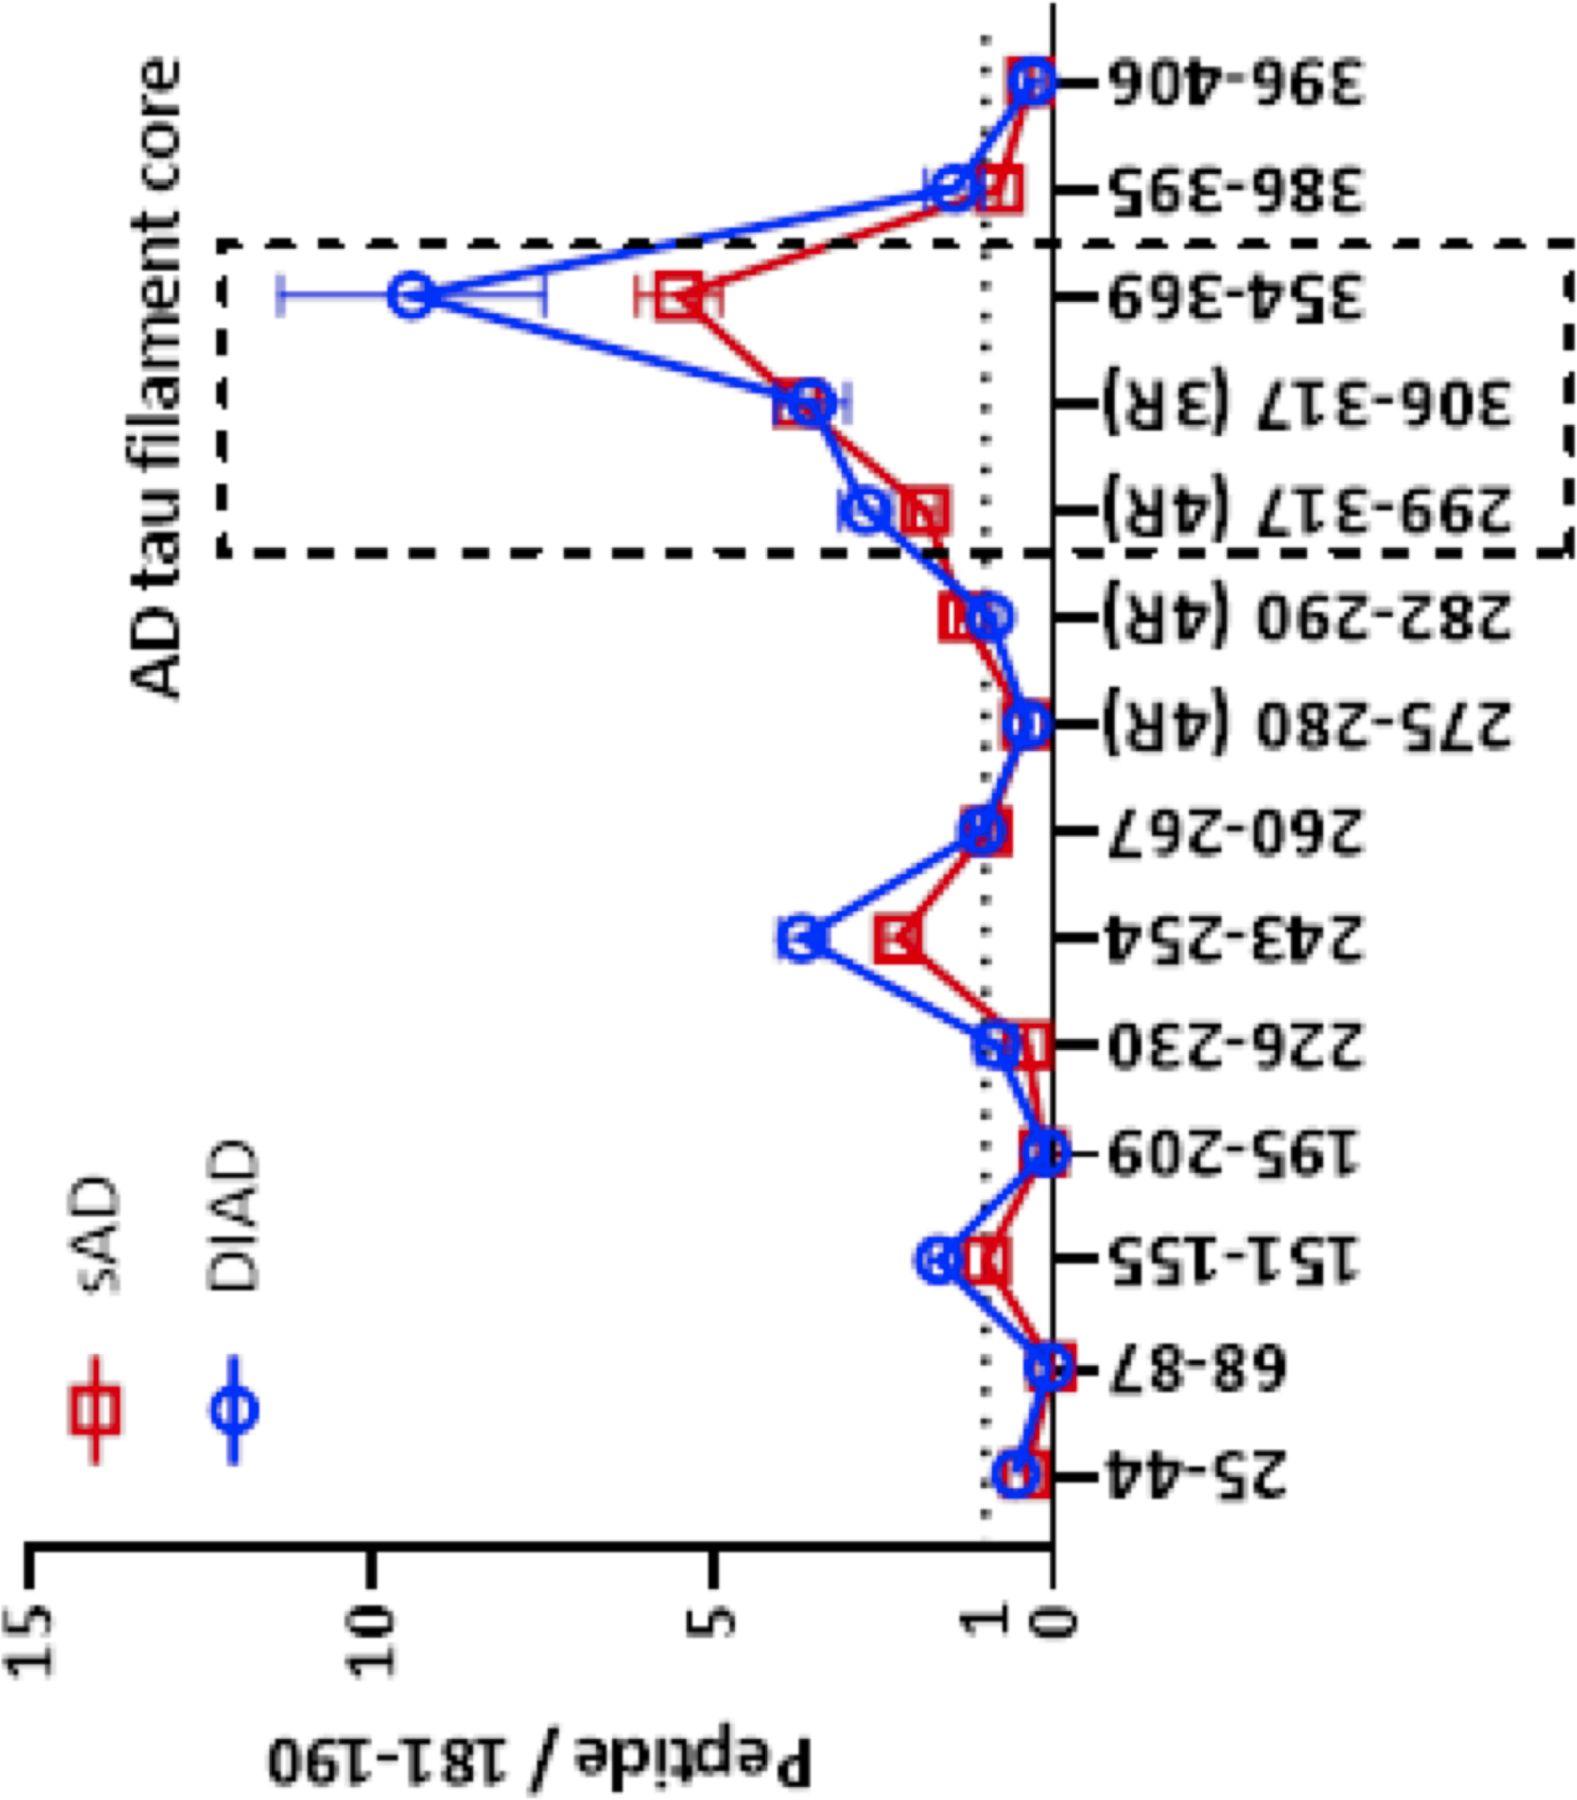
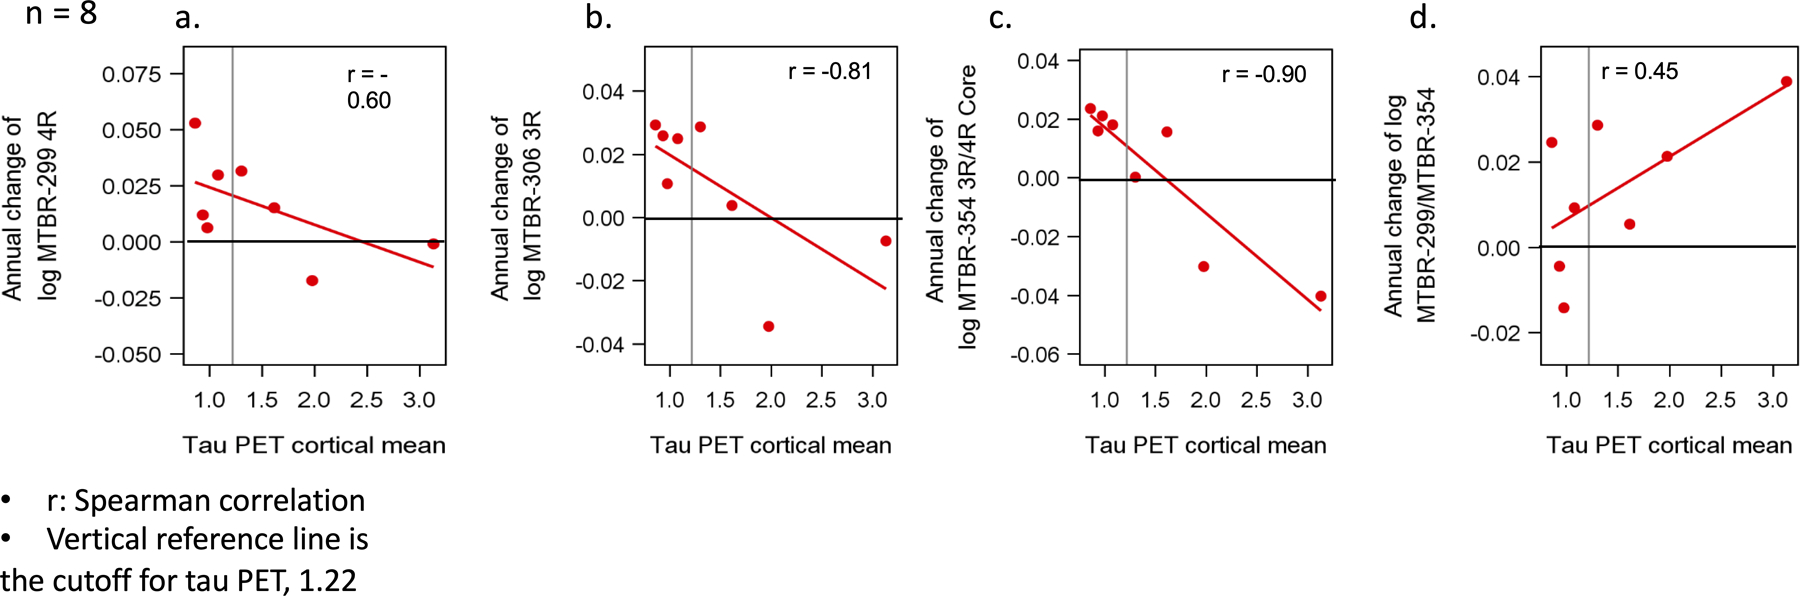
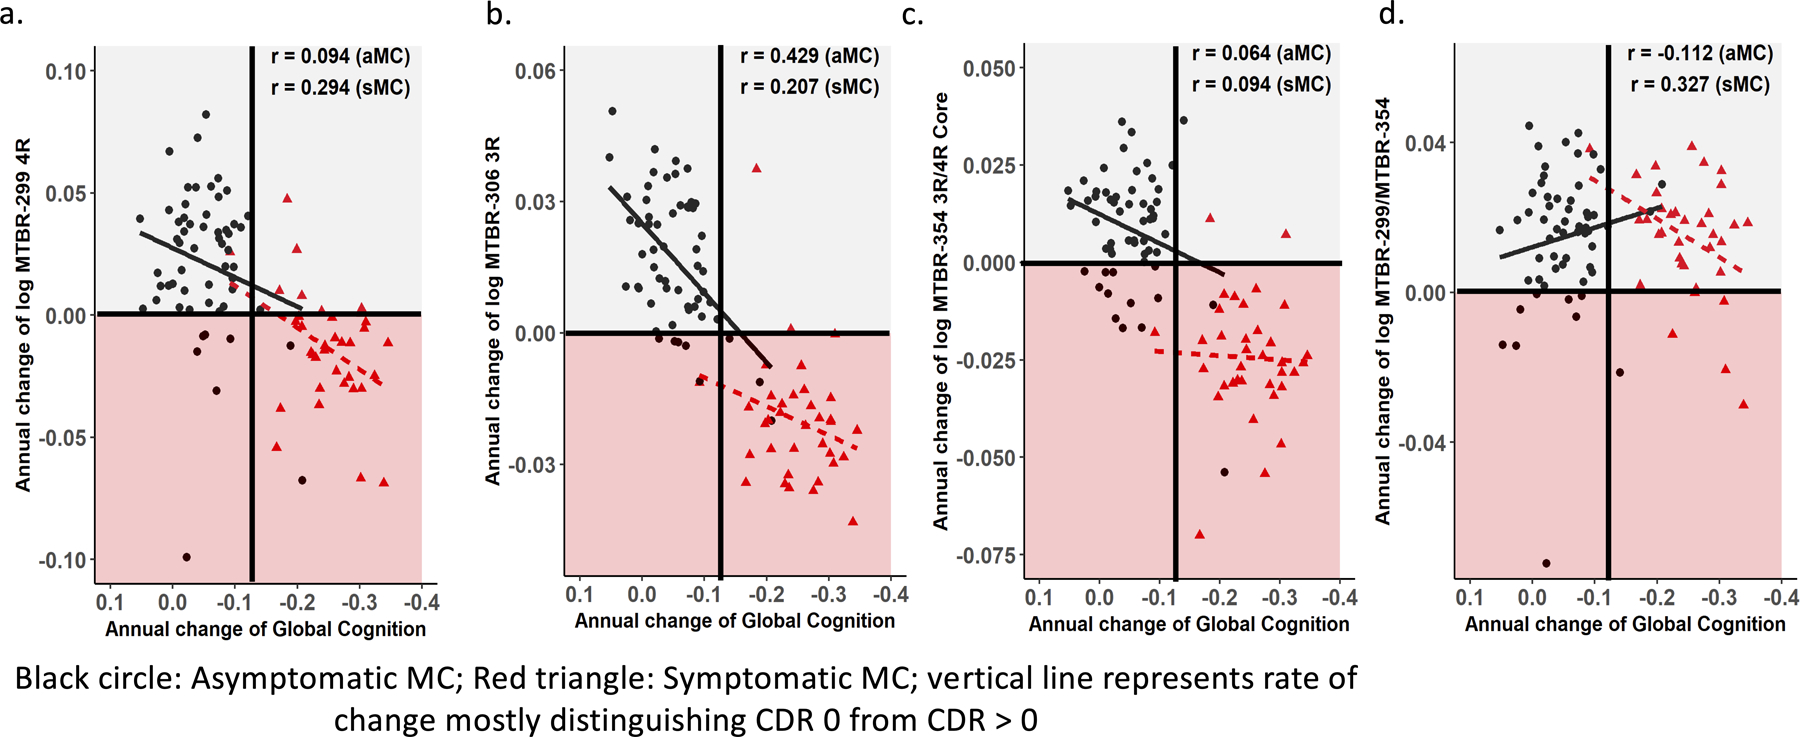
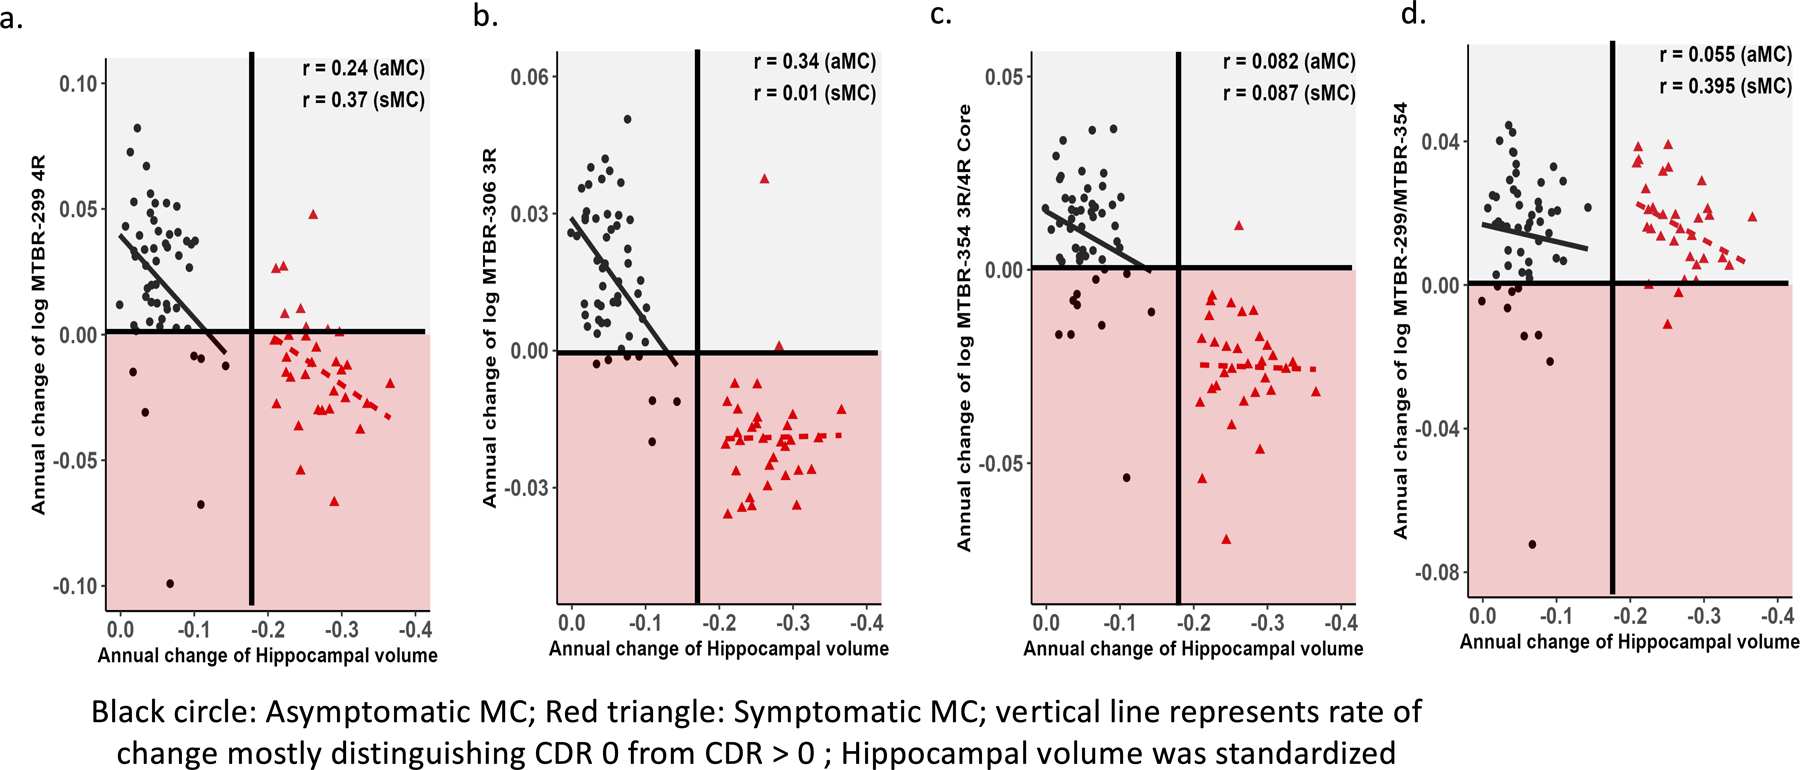
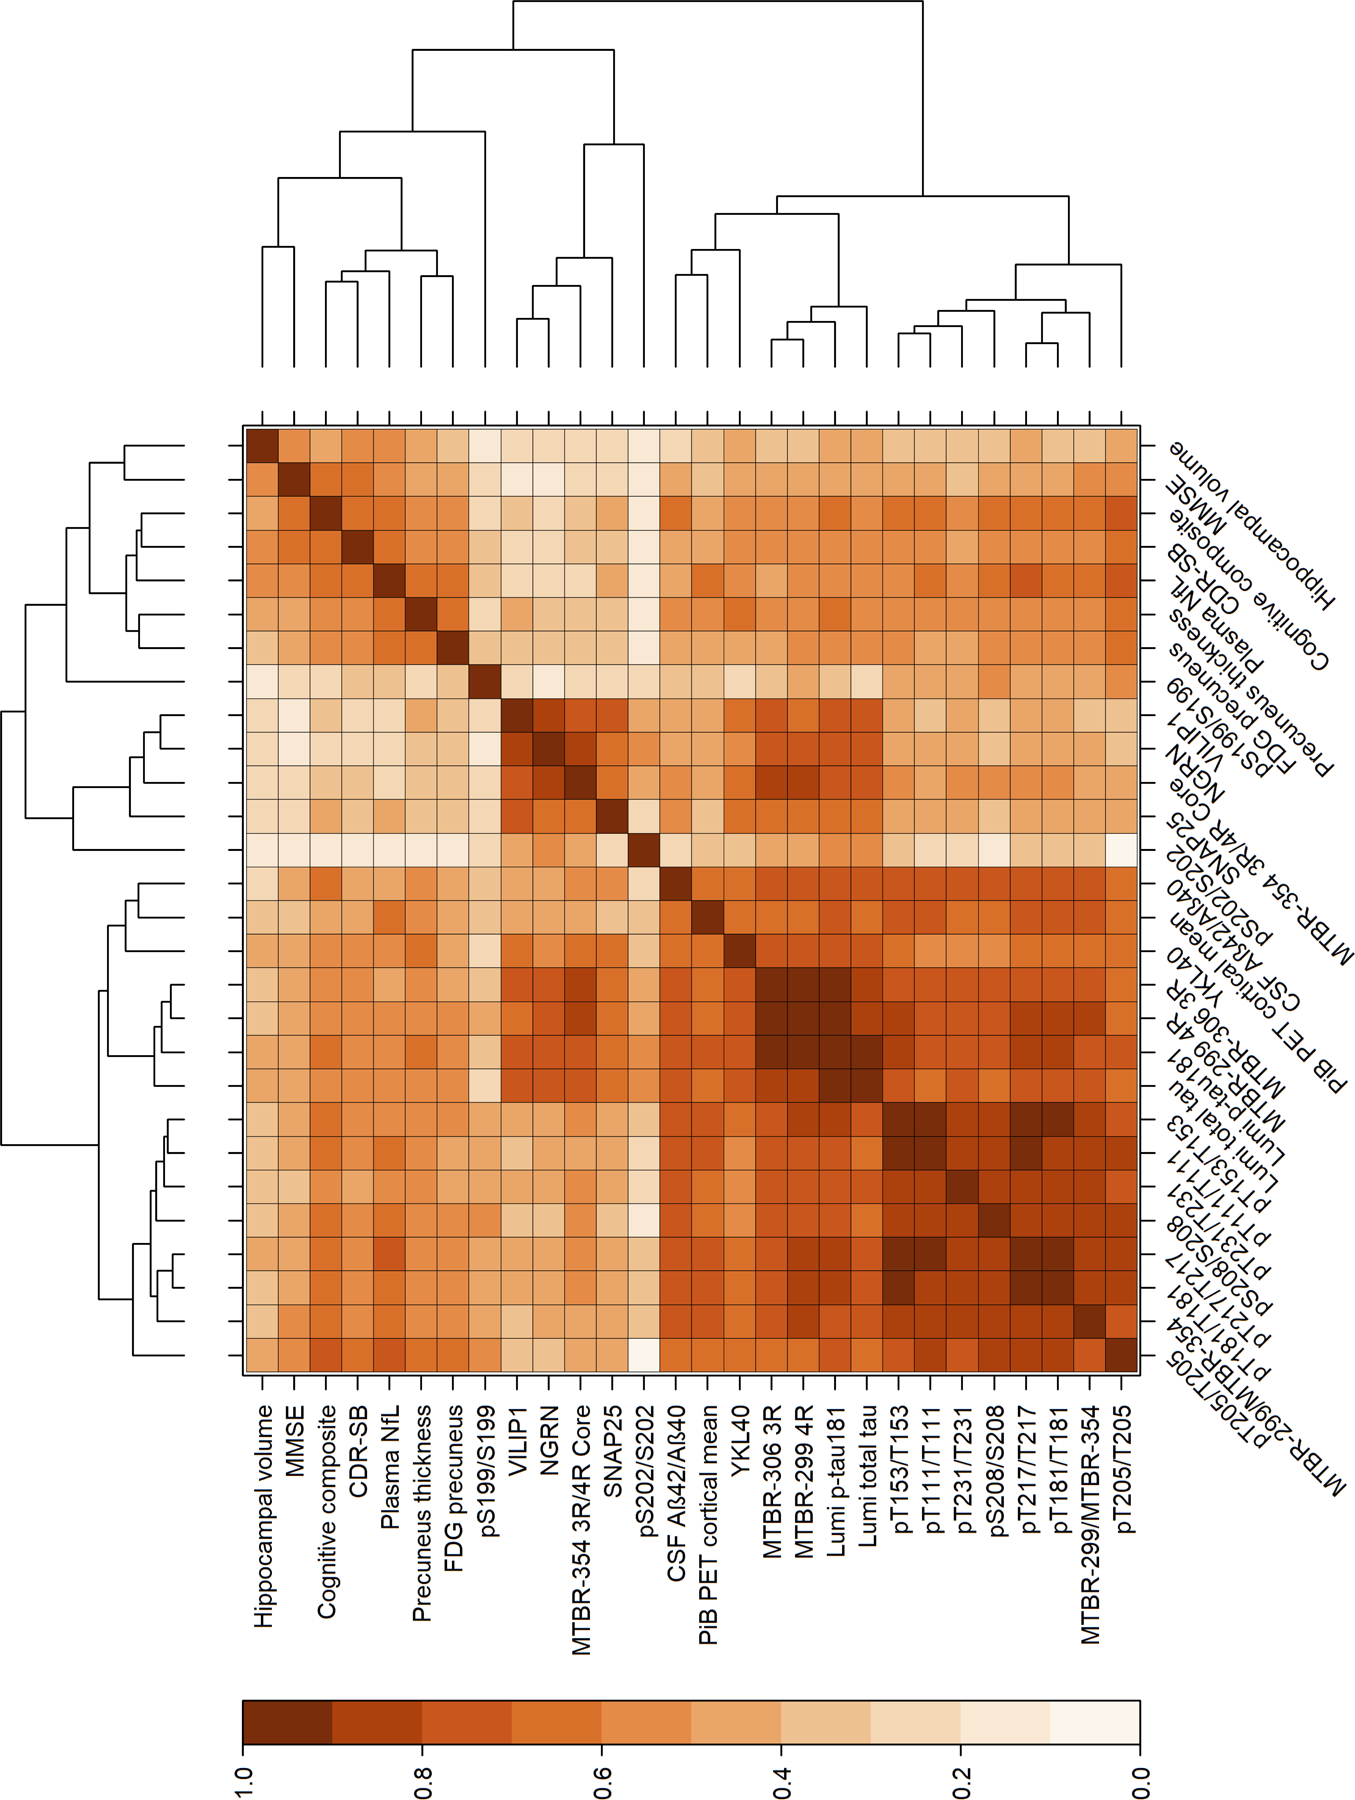
Results: CSF MTBR-tau species located within the putative "border" region and one species corresponding to the "core" region of aggregates in neurofibrillary tangles (NFTs) increased during the presymptomatic stage and decreased during the symptomatic stage. The "border" MTBR-tau species were associated with amyloid pathology and CSF p-tau; whereas the "core" MTBR-tau species were associated stronger with tau PET and CSF measures of neurodegeneration. The ratio of the border to the core species provided a continuous measure of increasing amounts that tracked clinical progression and NFTs.

Interpretation: Changes in CSF soluble MTBR-tau species preceded the onset of dementia, tau tangle increase, and atrophy in DIAD. The ratio of 4R-specific MTBR-tau (border) to the NFT (core) MTBR-tau species corresponds to the pathology of NFTs in DIAD and change with disease progression. The dynamics between different MTBR-tau species in the CSF may serve as a marker of tau-related disease progression and target engagement of anti-tau therapeutics. ANN NEUROL 2023;93:1158-1172.


Conflict of interest statement

Potential Conflict of Interests:

There are several inventions that have been filed by Washington University for patents, including “Methods of diagnosing AD with phosphorylation changes” and “Methods to detect MTBR-tau isoforms and use”. These intellectual properties owned by Washington University can be or are licensed and some licensing income may be distributed to Drs. Barthelemy, Bateman, Horie, McDade and Sato and other inventors. These intellectual properties being licensed by Washington University from C2N and currently being utilized in our research have been reviewed by the Washington University COI and ICOI committees.

All co-inventors, including some lab members, the University, and Drs. Barthelemy, Bateman, Horie, McDade and Sato could receive part of the profits from any sales of these tests by C2N, which is in the process of licensing or has licensed some IP from the University. These activities have been reviewed by Washington University’s (WU) Conflicts of Interest Review Committee in accordance with WU’s Research Conflicts of Interest Policy and WU’s Institutional Conflict of Interest Review Committee in accordance with WU’s Institutional Conflict of Interest Policy.

K.H. is an Eisai-sponsored voluntary research associate professor at Washington University and has received salary from Eisai.

RJB has received research funding from Avid Radiopharmaceuticals, Janssen, Roche/Genentech, Eli Lilly, Eisai, Biogen, AbbVie, Bristol Myers Squibb, and Novartis. Washington University and RJB have equity ownership interest in C2N Diagnostics and receive income based on technology (stable isotope labeling kinetics, blood plasma assay, and methods of diagnosing AD with phosphorylation changes) licensed by Washington University to C2N Diagnostics. RJB receives income from C2N Diagnostics for serving on the scientific advisory board. RJB serves on the Roche Gantenerumab Steering Committee as an unpaid member.

JL reports speaker fees from Bayer Vital, Biogen and Roche, consulting fees from Axon Neuroscience and Biogen, author fees from Thieme medical publishers and W. Kohlhammer GmbH medical publishers, non-financial support from Abbvie and compensation for duty as part-time CMO from MODAG and being beneficiary of the phantom share program of MODAG GmbH, outside the submitted work.

Figures

Figure 1.
Figure 1.. MTBR region of tau splicing isoforms and the evolution of soluble fragments with disease progression.
(a) Three repeat (3R) and four repeat (4R) tau splicing isoforms and the binding regions of HJ8.5, Tau1, and E2814 of the N-terminal, mid-domain, and MTBR repeats, respectively. The cleavage at mid-domain (around the residue 224) in CSF is also described. (b) distribution of E2814 targeted MTBR regions on the border and fold of the core of misfolded fibrillar tau of AD. (c) evolution of fibrillar aggregates demonstrating area of the core/fold with border (blue) and core (red). (d) proposed dynamic metabolism of NFT with the R2–3 (border) segments of the NFT having higher proportion of soluble fragments released to the extracellular space relative to the deep, core, sections of R4. (e) Soluble R2–3 (blue) and R4 (red) fragment changes with disease progression and relative to the development of Aβ-plaques (hashed black line) and NFT (red line); both fragments begin to increase with the Aβ-plaques pathology and, relative to maximal levels, begin to decline as NFT pathology begins to increase, with R4 (core) fragments decreasing greater than R2–3 fragments; gray shading represents primarily soluble phase of tau and pink shading representing aggregated phase of tau.
Figure 2.
Figure 2.. MTBR-tau299, 306 and 354 species are enriched in aggregated sporadic and dominantly-inherited Alzheimer’s disease brain insoluble extracts compared to control brain extracts, confirming that MTBR-tau species are specifically deposited in Alzheimer’s disease brain.
The enrichment profile of tau peptides from dominantly-inherited Alzheimer’s disease (DIAD) brains. DIAD n=6 (frontal cortex), sporadic AD n=7 (parietal cortex). The relative abundance of tau peptides was quantified relative to the mid-domain (residue 181–190) peptide for internal normalization. The species containing the upstream region of the microtubule binding region (MTBR) domain (residue 243–254), repeat region 2 (R2) to R3 domain (residue 299–317, MTBR-tau299, MTBR-299 4R), R3 domain (residue 306–317, MTBR-tau306, MTBR-306 3R) and R4 (residue 354–369, MTBR-tau354, MTBR-354 3R/4R core) were highly enriched in the insoluble fraction from Alzheimer’s disease brains compared to control. MTBR-299 4R is located at surface on the neurofibrillary tangle (NFT), whereas MTBR-306 3R and MTBR-354 3R/4R core are relatively located inside the NFT. Data are represented as average with standard error of mean.
Figure 3.
Figure 3.. All CSF MTBR-tau species increase during asymptomatic amyloid stage (a,b,c), then decrease during symptomatic tau stage (e,f,g). CSF MTBR-299 4R increase relative to MTBR-354 3R/4R core in symptomatic tau stage (d, h).
Individual, longitudinal changes of MTBR-tau species of (a) MTBR-tau299 (MTBR-299 4R), (b) MTBR-tau306 (MTBR-306 3R) (c) MTBR-tau354 (MTBR-354 3R/4R core), (d) MTBR-tau299/MTBR-tau354 (border/core), for mutation carriers (orange = asymptomatic mutation carriers (aMC), (n= 151), red = symptomatic mutation carriers (sMC),(n=78)) and non-carriers (blue, (n=130)) across the estimated years to symptom onset (EYO). The vertical dashed line is the point of expected symptom onset. (e-h). Individual longitudinal changes of soluble MTBR fragments. Individual, log, z-transformed, longitudinal changes in the levels of (e) MTBR-tau299 (MTBR-299 4R), (f) MTBR-tau306 (MTBR-306 3R) (g) MTBR-tau354 (MTBR-354 3R/4R core) and (h) MTBR-tau299/MTBR-tau354 (border/core) for aMCs (orange), sMCs (red) and NCs (blue) across the estimated years to symptom onset (EYO). The gray shading represents the soluble phase of tau with positive (increasing) rates of change; the pink shading represents the aggregated phase of tau (and symptomatic stage of disease) with negative (decreasing) rates of change. All fragments have a bimodal pattern of rate of change with all species having a negative rate of change (< 0) approximately 5 years before symptoms onset (EYO 0) with maximum reversal.
Figure 4.
Figure 4.. Longitudinal change of soluble MTBR-tau species are differentially related to neurofibrillary tau (tau PET).
Estimated rates of change, log transformed, (n = 8) (a-d) of MTBR (y-axis) leading up to the time of tau PET scan (x-axis). The vertical line is an SUVR of 1.22 and represents a conservative estimate of the point when NFT tau PET (a composite of multiple cortical and limbic regions) is considered elevated compared to non-carriers. For longitudinal analyses, the rate of change of MTBR-306 3R, 95% confidence interval (CI) - 0.96 – −0.19; p – 0.01 and MTBR-tau354 (MTRB-354 3R/4R core), 95% CI - 0.98 – −0.51; p – < 0.001 in the time leading up to the tau PET were most strongly associated with tau PET SUVR; specifically, a decrease in the rate of change of these two MTBR species that was associated with higher levels of tau PET SUVR; MTBR-299 4R, 95% CI - 0.91 – 0.23; p – 0.12, MTBR-299/MTBR-354 (border/core), 95% CI - 0.39 – 0.98; p – 0.28.
Figure 5.
Figure 5.. Longitudinal change of MTBR-tau species are differently associated with change in cognition.
Individual estimated annualized rates of change, log transformed, of soluble MTBR-tau (y-axis) for MCs were correlated with the annualized change in global cognitive function (a-d); the lines represent simple linear regression and the r = Spearman correlation. Each point is an individual level correlation between measures. The linear regression was fit to those with no dementia (CDR 0, black circle, n= 57) and dementia (CDR >0, red triangle, n= 40). A decline in MTBR-tau306 (MTBR-306 3R, 95% CI 0.19 – 0.62; p – < 0.001) species (b) was associated with a decline in cognition at the asymptomatic stages, where MTBR-tau299 (MTBR-299 4R, 95% CI −0.05 – 0.57; p – 0.09) (a) and MTBR-299/MTBR-354 (border/core, 95% CI −0.01 – 0.59; p – 0.06) (d) was associated with a decline in cognition at the symptomatic stages; for all other correlations there were no statistically significant associations: asymptomatic MC - MTBR-299 4R, 95% CI −0.17 – 0.35; p – 0.49 (a), MTRB-354 (3R/4R core), 95% CI −0.20 – 0.32; p – 0.64 (c), MTBR-299/MTBR-354 (border/core), 95% CI −0.36 – 0.15; p – 0.41; symptomatic MC - MTBR-306 3R, 95% CI −0.14 – 0.50; p – 0.24 (b), MTRB-354 (3R/4R core), 95% CI −0.25 – 0.41; p – 0.59) (c).
Figure 6.
Figure 6.. Longitudinal change of MTBR-tau species are differently associated with change in hippocampal atrophy.
Individual estimated annualized rates of change, log transformed, of soluble MTBR-tau (y-axis) for MCs were correlated with the annualized change in hippocampal atrophy (a-d); the lines represent simple linear regression. Each point is an individual level correlation between measures and the r = Spearman correlation. The linear regression was fit to those with no dementia (CDR 0, black circle, n= 57) and dementia (CDR >0, red triangle, n= 40). There was evidence of a direct association with trends towards slower rates of change of MTBR-299 4R, 95% CI −0.03 – 0.49; p – 0.08 (a) and MTBR-306 3R, 95% CI 0.76 – 0.56; p – 0.01 (b) being associated with the initial decrease in hippocampal volumes during the asymptomatic phase; for MTBR-299 4R, 95% CI 0.02 – 0.63; p – 0.04 and the MTBR-299/MTBR-354 (border/core), 95% CI 0.05 – 0.65; p – 0.02 (d), there remained a suggestion of a similar association during the symptomatic phase of the disease as well. For all other correlations there were no statistically significant associations: asymptomatic MC- MTRB-354 (3R/4R core), 95% CI −0.19 – 0.34; p – 0.56 (c), MTBR-299/MTBR-354 (border/core, 95% CI −0.22 – 0.32; p – 0.70); symptomatic MC- MTBR-306 3R, 95% CI - 0.34 – 0.35; p – 0.96, MTRB-354 (3R/4R core), 95% CI −0.27 – 0.42; p – 0.64.
Figure 7.
Figure 7.. Hierarchical clustering of cross-sectional measures of soluble MTBR-tau with multiple fluid, imaging and clinical measures in MCs.
Baseline values of multiple p-tau ratios (phosphorylated to unphosphorylated levels) and MTBR-299 4R, MTBR-306 3R and MTBR-354 3R/4R core species identified two main branches with three primary clusters of 1) a clinical and neurodegenerative cluster, 2) a cluster of the MTBR-299 4R and MTBR-306 3R with measures of amyloid and multiple isoforms of p-tau, and 3) a small cluster involving p-tau sites associated with the AT8 binding of NFT, MTBR-354 3R/4R core and CSF measures of synaptic degeneration. MMSE: mini-mental state examination, CDR-SB: clinical dementia rating scale sum of boxes, NfL: neurofilament light chain, FDG: fluorodeoxyglucose, VILIP1: visinin-like protein 1, NGRN: neurogranin, SNAP25: Synaptosomal-Associated Protein, 25kDa.

References

    1. Dam T, Boxer AL, Golbe LI, et al. Safety and efficacy of anti-tau monoclonal antibody gosuranemab in progressive supranuclear palsy: a phase 2, randomized, placebo-controlled trial. Nat Med 2021;27(8):1451–1457. doi: 10.1038/s41591-021-01455-x - DOI - PubMed
    1. Novak P, Kovacech B, Katina S, et al. ADAMANT: a placebo-controlled randomized phase 2 study of AADvac1, an active immunotherapy against pathological tau in Alzheimer’s disease. Nat Aging 2021;1(6):521–534. doi: 10.1038/s43587-021-00070-2 - DOI - PubMed
    1. Höglinger GU, Litvan I, Mendonca N, et al. Safety and efficacy of tilavonemab in progressive supranuclear palsy: a phase 2, randomised, placebo-controlled trial. Lancet Neurol 2021;20(3):182–192. doi: 10.1016/S1474-4422(20)30489-0 - DOI - PubMed
    1. Bateman RJ, Klunk WE. Measuring target effect of proposed disease-modifying therapies in Alzheimer’s disease. Neurotherapeutics 2008;5(3):381–390. doi: 10.1016/j.nurt.2008.05.009 - DOI - PMC - PubMed
    1. Barthélemy NR, Li Y, Joseph-Mathurin N, et al. A soluble phosphorylated tau signature links tau, amyloid and the evolution of stages of dominantly inherited Alzheimer’s disease. Nat Med 2020;26(3):398–407. doi: 10.1038/s41591-020-0781-z - DOI - PMC - PubMed

Publication types

MeSH terms