

A Zeb1/MtCK1 metabolic axis controls osteoclast activation and skeletal remodeling
- PMID: 36843552
- PMCID: PMC10068323
- DOI: 10.15252/embj.2022111148
A Zeb1/MtCK1 metabolic axis controls osteoclast activation and skeletal remodeling
Abstract
Osteoclasts are bone-resorbing polykaryons responsible for skeletal remodeling during health and disease. Coincident with their differentiation from myeloid precursors, osteoclasts undergo extensive transcriptional and metabolic reprogramming in order to acquire the cellular machinery necessary to demineralize bone and digest its interwoven extracellular matrix. While attempting to identify new regulatory molecules critical to bone resorption, we discovered that murine and human osteoclast differentiation is accompanied by the expression of Zeb1, a zinc-finger transcriptional repressor whose role in normal development is most frequently linked to the control of epithelial-mesenchymal programs. However, following targeting, we find that Zeb1 serves as an unexpected regulator of osteoclast energy metabolism. In vivo, Zeb1-null osteoclasts assume a hyperactivated state, markedly decreasing bone density due to excessive resorptive activity. Mechanistically, Zeb1 acts in a rheostat-like fashion to modulate murine and human osteoclast activity by transcriptionally repressing an ATP-buffering enzyme, mitochondrial creatine kinase 1 (MtCK1), thereby controlling the phosphocreatine energy shuttle and mitochondrial respiration. Together, these studies identify a novel Zeb1/MtCK1 axis that exerts metabolic control over bone resorption in vitro and in vivo.
Keywords: Zeb1; bone resorption; mitochondrial creatine kinase; osteoclast; skeletal remodeling.
© 2023 The Authors. Published under the terms of the CC BY NC ND 4.0 license.
Conflict of interest statement
The authors declare that they have no conflict of interest.
Figures
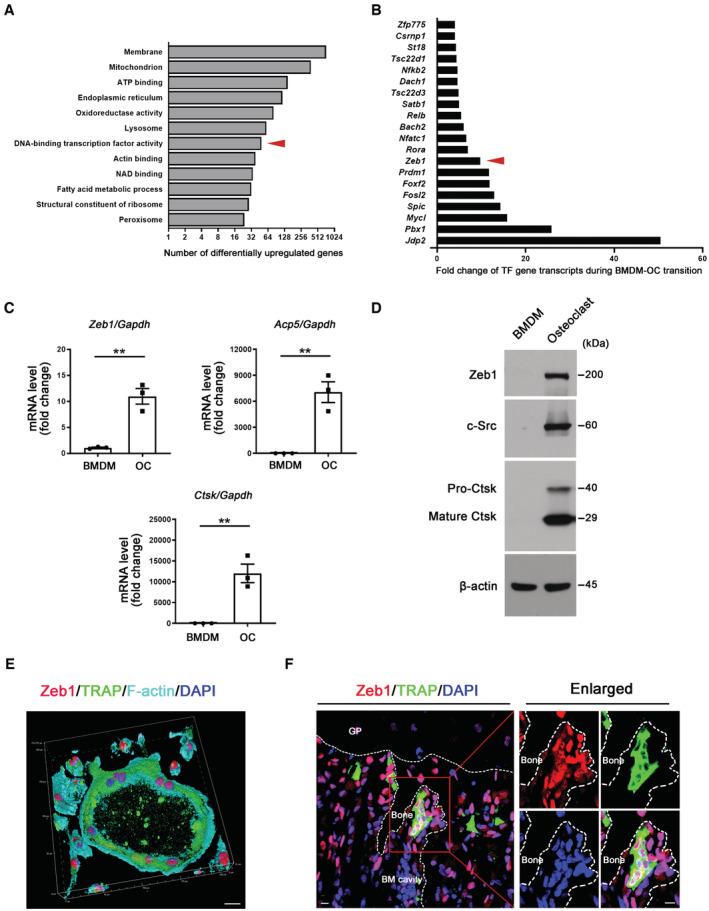
DAVID gene ontology (GO) analysis of differentially upregulated transcripts during BMDM‐osteoclast transition generated from wild‐type mice identified an enrichment in DNA‐binding TF activity (arrow; n = 3).
Unexpected expression of Zeb1 (arrow) among the top 20 differentially upregulated genes retrieved from DAVID GO biological process “DNA‐binding TF activity” during wild‐type BMDM‐osteoclast transition (n = 3).
Relative mRNA expression of Zeb1, Acp5, and Ctsk during the differentiation from BMDMs to osteoclasts in culture (n = 3).
Western blot of Zeb1, c‐Src, and Ctsk expression in BMDMs and mature osteoclasts (n = 3).
3D reconstruction of Zeb1 (red), TRAP (green), and F‐actin (cyan) immunofluorescent staining of osteoclasts differentiated from wild‐type BMDMs. Scale bar, 20 μm.
Zeb1 (red) and TRAP (green) immunofluorescence of a femur section including the growth plate (GP) and metaphysis from a wild‐type mouse. The multinucleated cells associated with the surface of the bone marrow cavity (BM cavity) that are shown in the red box are further enlarged in the panels to the right. Scale bar, 10 μm.
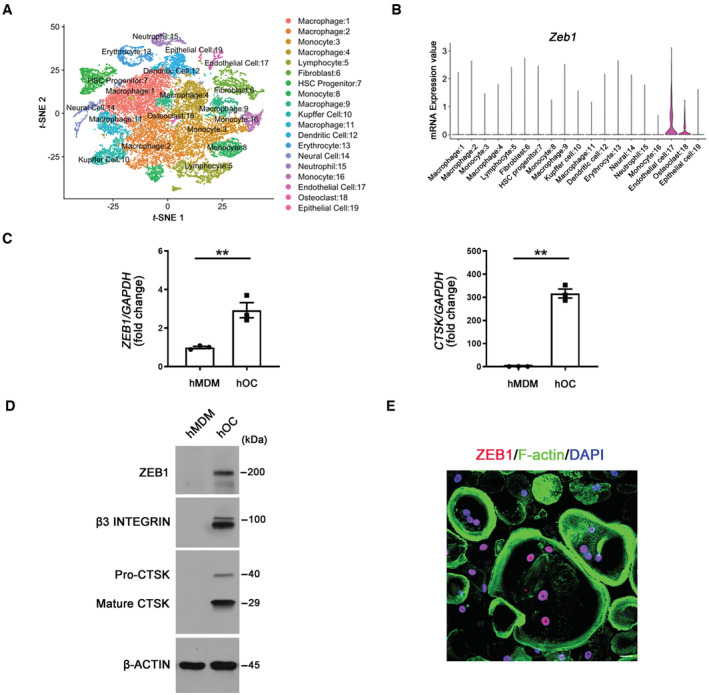
t‐Distributed stochastic neighbor embedding (t‐SNE) plots of cells from E14.5 embryos identified 19 clusters including osteoclasts (Data ref: Yahara et al, 2020b).
Violin plots showing mRNA expression value of Zeb1 in each cell cluster from E14.5 embryos in vivo, with the x axis number representing cluster identity (Data ref: Yahara et al, 2020b).
Relative mRNA expression of ZEB1 and CTSK in human monocyte‐derived macrophages (hMDMs) and mature human osteoclasts (hOC; n = 3).
ZEB1, β3 INTEGRIN, and CTSK protein expression as assessed by Western blot were determined in hMDMs and mature hOCs.
ZEB1 (red) and F‐actin (green) staining of human osteoclasts differentiated from hMDM. Scale bar, 20 μm.
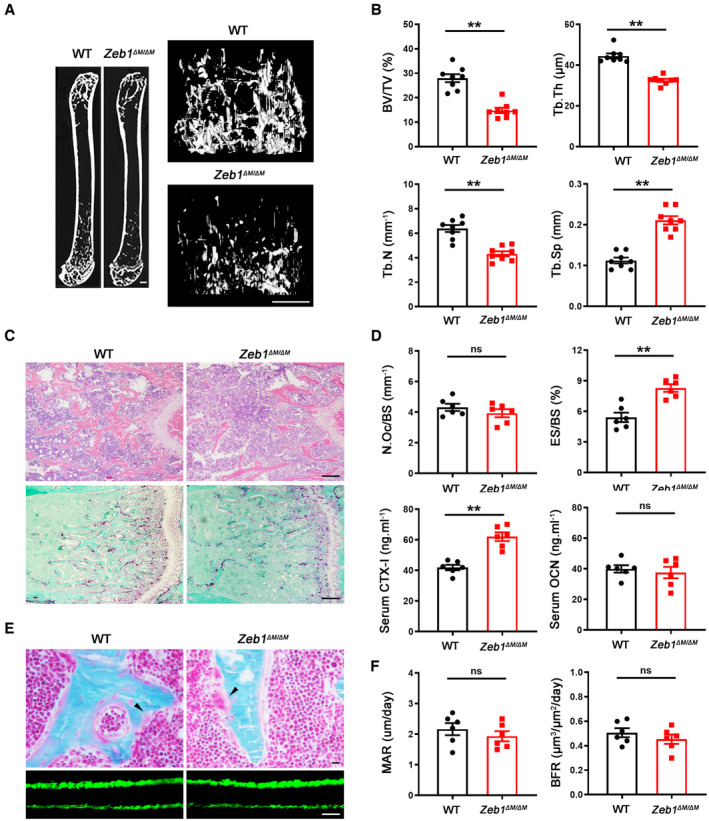
Representative nanoCT of sagittal sections of femurs with 3D reconstruction of the distal femur trabeculae of 3‐month‐old wild‐type and Zeb1 ΔM/ΔM male mice are shown. The genotype of Zeb1 +/+, Zeb1 f/+, Zeb f/f mice is defined as “wild‐type” control. Scale bar, 500 μm.
Quantification of BV/TV, Tb.Th, Tb.N, and Tb.Sp as determined by nanoCT in 3‐month‐old wild‐type and Zeb1 ΔM/ΔM male mice (n = 8).
H&E and TRAP staining of the distal femurs of 3‐month‐old male wild‐type and Zeb1 ΔM/ΔM mice. Scale bar, 200 μm.
Quantification of osteoclast number per bone surface (N.Oc/BS) and eroded surface per bone surface (ES/BS), as well as serum CTX‐I and OCN levels in 3‐month‐old wild‐type and Zeb1 ΔM/ΔM male mice are shown (n = 6).
Golden's trichrome staining illuminating howship's lacunae (arrow) of the distal femurs of 3‐month‐old male wild‐type and Zeb1 ΔM/ΔM mice were performed along with double‐calcein bone labeling and confocal imaging to assess bone formation. Scale bar, 10 μm.
Quantification of MAR and BFR as assessed in 3‐month‐old male wild‐type and Zeb1 ΔM/ΔM mice (n = 6).
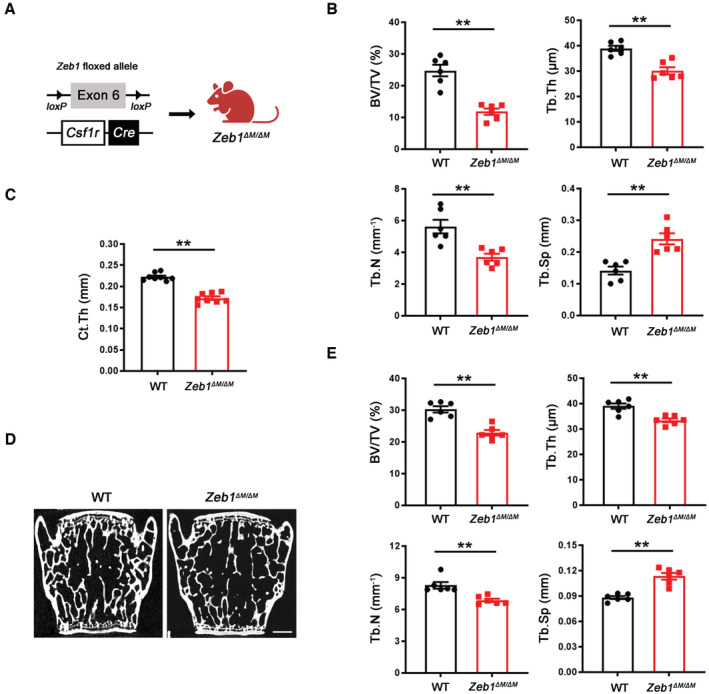
Schematic of breeding strategy to generate myeloid‐selective Zeb1 knockout mice (Csf1r‐ Cre/Zeb1 f/f ; Zeb1 ΔM/Δ ).
Quantification of BV/TV, Tb.Th, Tb.N, and Tb.Sp as determined by nanoCT in 3‐month‐old wild‐type and Zeb1 ΔM/ΔM female mice (n = 6).
Quantification of cortical thickness (Ct.Th) as determined by nanoCT in femurs of 3 month‐old wild‐type and Zeb1 ΔM/ΔM male mice (n = 8).
Representative nanoCT of L3 vertebrae sections of 3‐month‐old wild‐type and Zeb1 ΔM/ΔM male mice are shown. Scale bar, 500 μm.
Quantification of BV/TV, Tb.Th, Tb.N, and Tb.Sp as determined by nanoCT in L3 vertebrae of 3 month‐old wild‐type and Zeb1 ΔM/ΔM male mice (n = 6). **P < 0.01.
- A
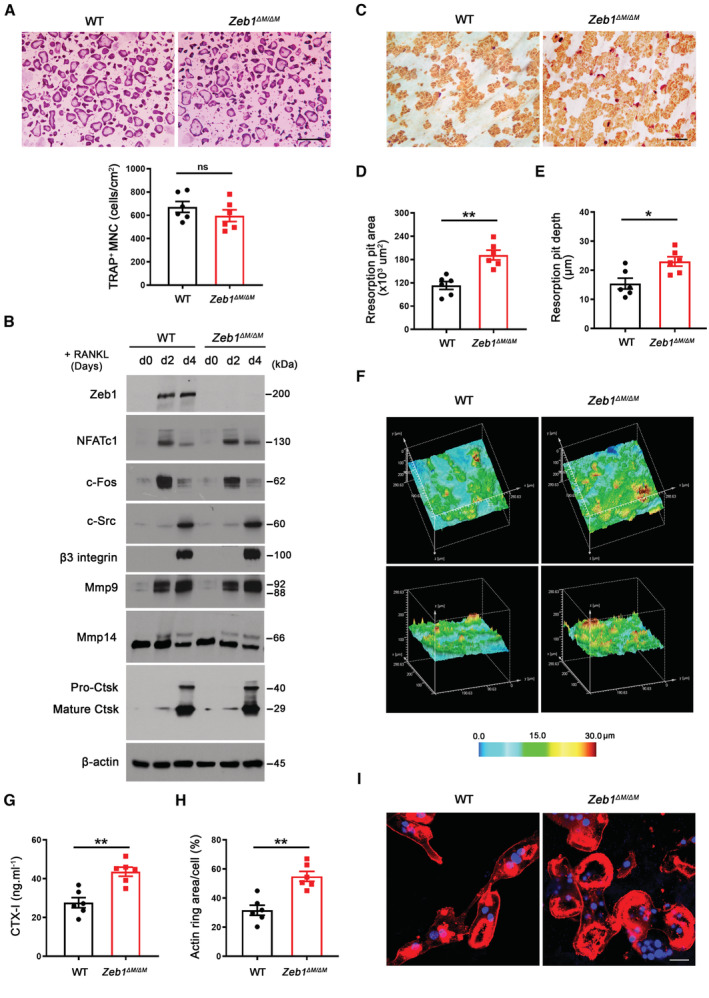
BMDMs were isolated from wild‐type or Zeb1 ΔM/ΔM mice and cultured atop plastic substrata with M‐CSF and RANKL for 5 days, stained with TRAP, and the number of TRAP+ MNCs determined (n = 6). Scale bar, 500 μm.
- B
Zeb1, NFATc1, c‐Fos, c‐Src, β3 integrin, Mmp9, Mmp14, and Ctsk expression as assessed by Western blot in wild‐type and Zeb1 ΔM/ΔM BMDMs during osteoclast differentiation (n = 3).
- C, D
After a 6‐day culture period, wild‐type or Zeb1 ΔM/ΔM osteoclasts were removed from bone slices, resorption pits visualized by WGA‐DAB staining (C), and resorption pit area quantified (D; n = 6). Scale bar, 100 μm.
- E, F
Resorption pits were 3D reconstructed by reflective confocal laser scanning microscope (RCLSM) (F) in tandem with quantification of resorption pit depth (E; n = 6). Color bar, pit depth.
- G
Supernatant CTX‐I determined by ELISA (n = 6).
- H, I
After a 6‐day culture atop bone slice, phalloidin staining (red) was performed in wild‐type versus Zeb1 ΔM/ΔM osteoclasts (I), and actin ring area per cell quantified (H). Scale bar, 20 μm.
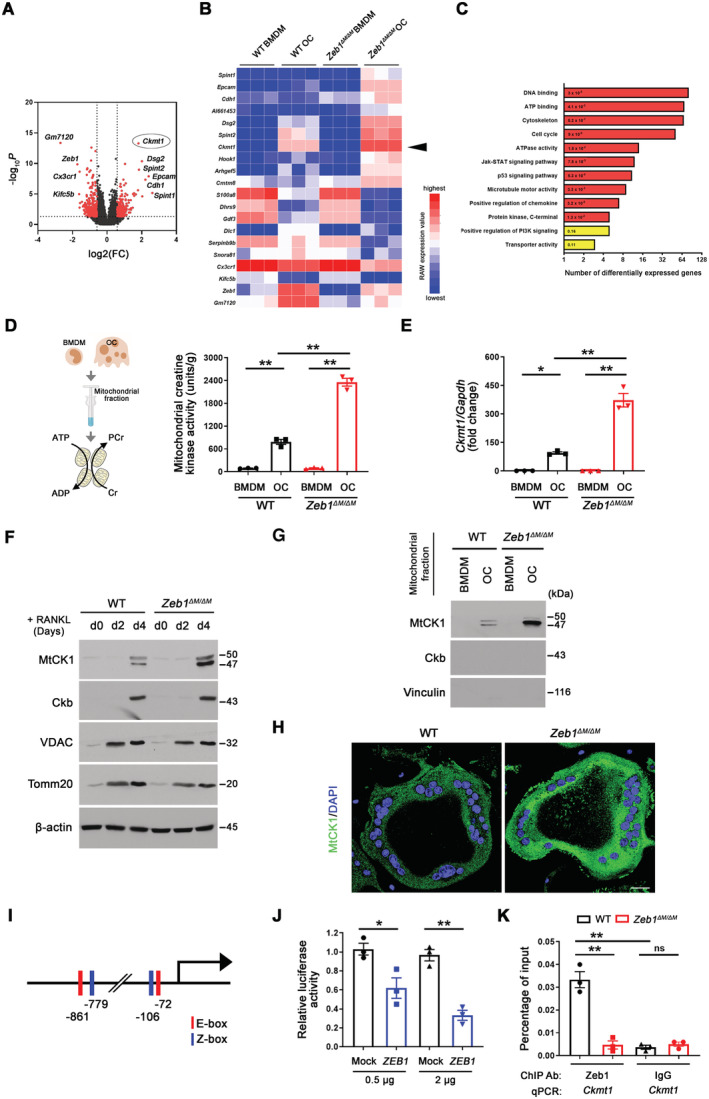
Volcano plot showing significantly enriched and depleted mRNAs in Zeb1 ΔM/ΔM osteoclasts versus wild‐type osteoclasts (n = 3).
The top 10 most highly upregulated and downregulated transcripts in Zeb1 ΔM/ΔM osteoclasts as compared with wild‐type osteoclasts are presented (n = 3; color bar, relative expression value).
DAVID gene ontology (GO) analysis of differentially expressed genes from Zeb1‐deleted versus wild‐type osteoclasts.
Mitochondrial creatine kinase activity of wild‐type and Zeb1 ΔM/ΔM BMDMs and osteoclasts cultured atop plastic substrata (n = 3).
Relative mRNA expression of Ckmt1 in BMDMs and osteoclasts generated from wild‐type or Zeb1 ΔM/ΔM mice.
MtCK1, Ckb, VDAC, and Tomm20 expression as assessed by Western blot in BMDMs and osteoclasts generated from wild‐type or Zeb1 ΔM/ΔM mice (n = 3).
MtCK1 and Ckb expression in the mitochondrial fraction as assessed by Western blot in BMDMs and osteoclasts generated from wild‐type or Zeb1 ΔM/ΔM mice (n = 3).
MtCK1 (green) immunofluorescence of wild‐type and Zeb1 ΔM/ΔM osteoclasts. Scale bar, 20 μm.
Schematic of mouse Ckmt1 promoter region indicating locations of E‐box (red) and Z‐box (blue) sequences that represent putative Zeb1 binding sites.
Luciferase activity was monitored in RAW 264.7 cells co‐transfected with a mock or ZEB1 expression vector in combination with a Ckmt1 promoter reporter construct (n = 3).
qPCR analysis of ChIP using anti‐Zeb1 antibody at the Ckmt1 promoter region in mature osteoclasts generated from wild‐type or Zeb1 ΔM/ΔM mice (n = 3).
- A
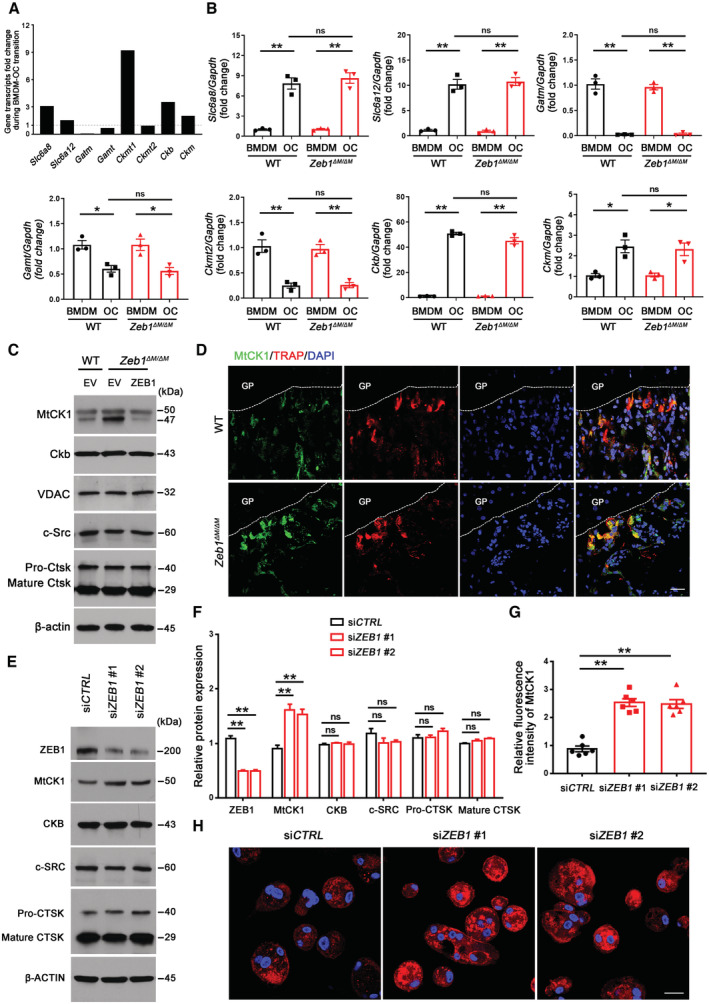
Relative expression of creatine metabolism‐related transcripts during wild‐type BMDM‐osteoclast transition as retrieved from gene profiling data set (Zhu et al, 2020).
- B
Relative mRNA expression of Slc6a8, Slc6a12, Gatm, Gamt, MtCK2, Ckb, and Ckm in BMDMs and osteoclasts generated from wild‐type or Zeb1 ΔM/ΔM mice (n = 3).
- C
An empty control vector (EV)‐transduced wild‐type BMDMs and EV‐ or ZEB1‐transduced Zeb1 ΔM/ΔM BMDMs were differentiated into osteoclasts and cell lysates collected for MtCK1, Ckb, VDAC, c‐Src, and Ctsk immunoblotting (n = 3).
- D
MtCK1 (green) and TRAP (red) immunofluorescence of a femur section from wild‐type and Zeb1 ΔM/ΔM mice. GP, growth plate. Scale bar, 20 μm.
- E, F
hMDMs were transfected with either a nontargeting control siRNA (siCTRL) or siRNA targeting ZEB1, differentiated into osteoclasts, and cell lysates collected for ZEB1, MtCK1, CKB, c‐SRC, and CTSK immunoblotting (E) and quantified (F; n = 3).
- G, H
MtCK1 (red) immunofluorescence of siCTRL‐ or siZEB1‐transfected human osteoclasts (H) and quantified (G; n = 3). Scale bar, 20 μm.
- A
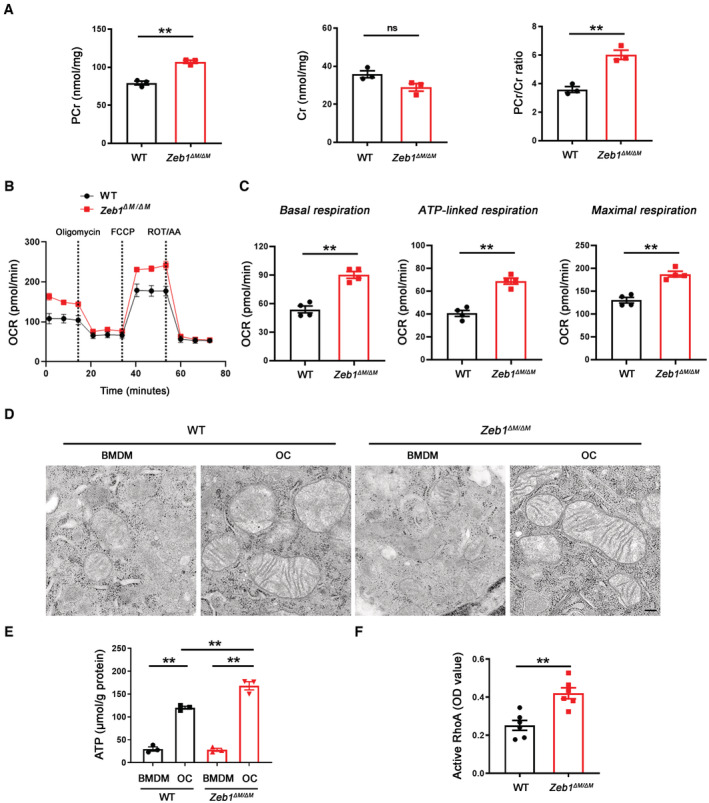
Phosphocreatine (PCr) and creatine (Cr) level, as well as PCr/Cr ratio of wild‐type or Zeb1 ΔM/ΔM osteoclasts cultured atop plastic substrata as determined by LC/MS analysis (n = 3).
- B, C
Oxygen consumption rate (OCR) profile plot (B) and mitochondrial function parameters (C) analyzed by XF Cell Mito Stress Assay in osteoclasts from wild‐type or Zeb1 ΔM/ΔM mice after sequential treatment of compounds modulating mitochondrial function (n = 4).
- D
Ultrastructural appearance of mitochondria in BMDMs and osteoclasts generated from wild‐type or Zeb1 ΔM/ΔM mice. Scale bar, 100 nm.
- E
ATP levels of BMDMs and osteoclasts generated from wild‐type or Zeb1 ΔM/ΔM mice (n = 3).
- F
RhoA activity of wild‐type and Zeb1 ΔM/ΔM osteoclasts cultured on plastic (n = 6).
- A
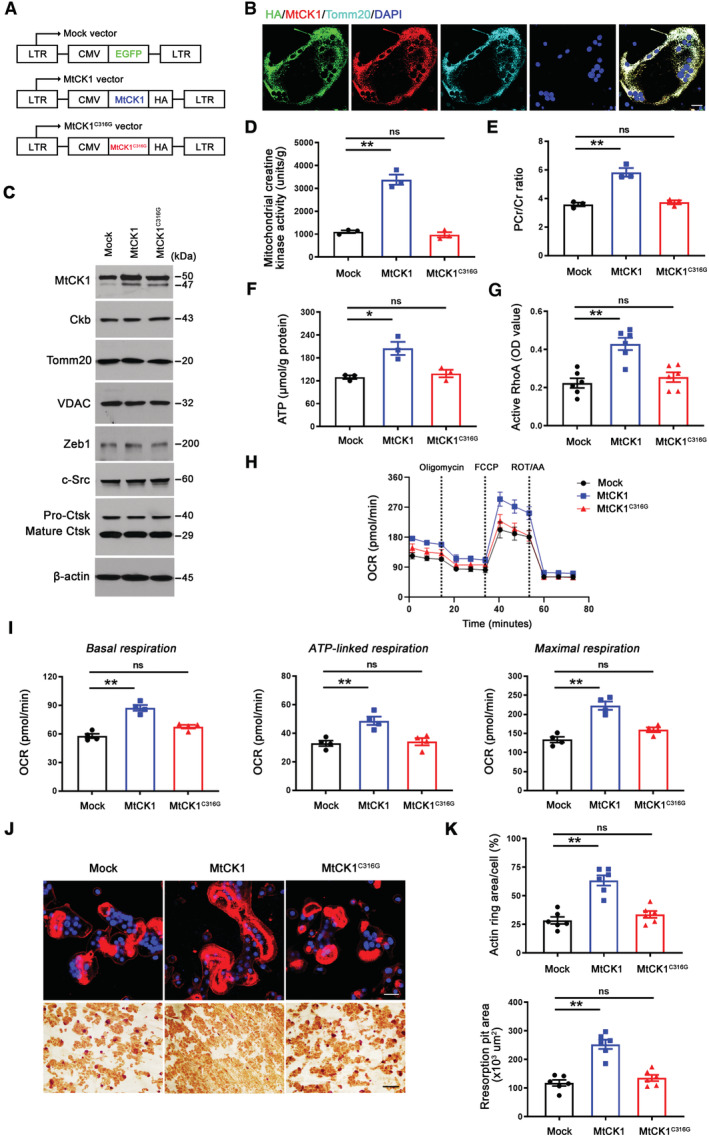
A schematic diagram of the mock vector, wild‐type human MtCK1, and the metabolic inactive MtCK1C316G mutant expression vector.
- B
Wild‐type BMDMs were transduced with wild‐type human MtCK1, differentiated into osteoclasts, and stained with HA (green), MtCK1 (red), and Tomm20 (cyan). Scale bar, 20 μm.
- C
Wild‐type BMDMs were transduced with either a mock vector, wild‐type human MtCK1, or a catalytically‐inactive MtCK1C316G mutant expression vector, differentiated into osteoclasts, and cell lysates collected for MtCK1, Ckb, Tomm20, VDAC, Zeb1, c‐Src, and Ctsk immunoblotting (n = 3).
- D
Mitochondrial creatine kinase activity of mock vector‐, MtCK1‐, or MtCK1C316G‐transduced wild‐type osteoclasts cultured on plastic (n = 3).
- E
PCr/Cr ratio of mock vector‐, MtCK1‐, or MtCK1C316G‐transduced wild‐type osteoclasts cultured on plastic substrata as determined by LC/MS analysis (n = 3).
- F
ATP levels of mock vector‐, MtCK1‐, or MtCK1C316G‐transduced wild‐type osteoclasts (n = 3).
- G
Wild‐type BMDMs were transduced with lentiviral vectors expressing wild‐type MtCK1, a catalytically‐inactive MtCK1C316G mutant, or a mock control and differentiated into osteoclasts, and RhoA activity assessed (n = 6).
- H, I
OCR profile plot (H) and mitochondrial function parameters (I) analyzed by XF Cell Mito Stress Assay in mock vector‐, MtCK1‐, or MtCK1C316G‐transduced wild‐type osteoclasts after sequential treatment of compounds modulating mitochondrial function (n = 4).
- J, K
Mock vector‐, MtCK1‐, or MtCK1C316G‐transduced wild‐type pre‐osteoclasts were cultured atop bone slices for 3 days, stained with phalloidin (red). Osteoclasts were removed and resorption pits visualized by WGA‐DAB staining (J). The actin ring area per cell and resorption pit area were quantified (K; n = 6). Scale bar, upper 20 μm, lower 100 μm.
- A
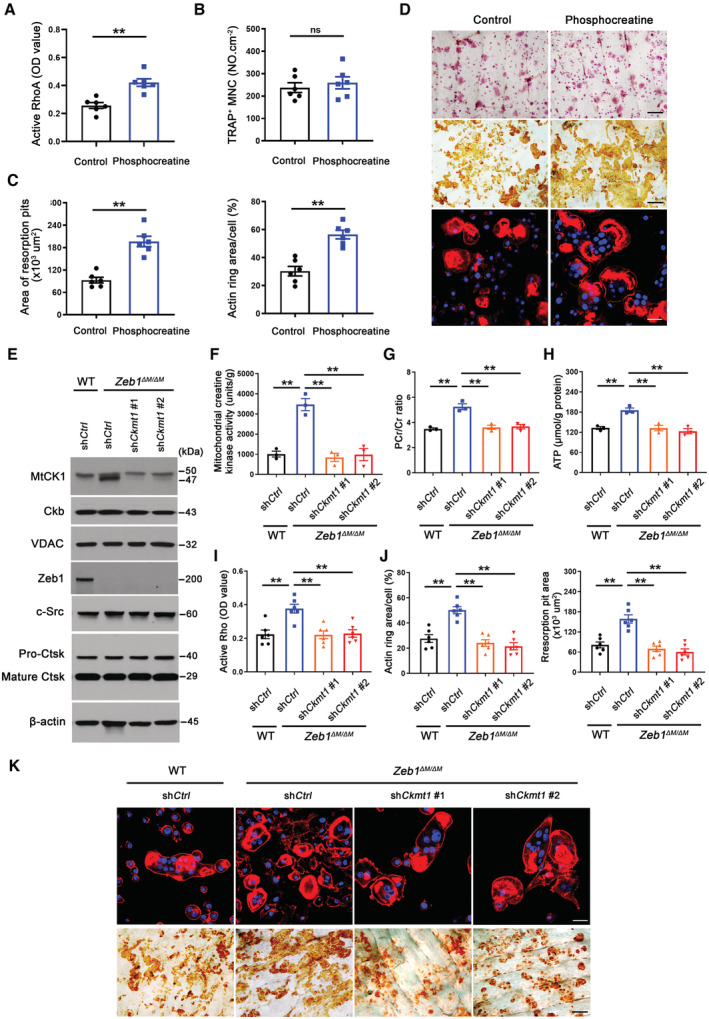
Wild‐type osteoclasts were cultured with exogenous 2 μΜ phosphocreatine and RhoA activity determined (n = 6).
- B–D
TRAP (red), WGA‐DAB and phalloidin staining (red) of wild‐type osteoclasts cultured atop bone slices in the presence of exogenous 2 μΜ phosphocreatine (D). Scale bar, upper and middle 100 μm, lower 20 μm. The number of TRAP+ MNCs, resorption pit area, and actin ring area per cell were quantified (B and C; n = 6).
- E
Scrambled shRNA control vector (shCtrl)‐transduced wild‐type BMDMs, and shCtrl‐ or shCkmt1‐transduced Zeb1 ΔM/ΔM BMDMs, were differentiated into osteoclasts, and cell lysates collected for MtCK1, Ckb, Tomm20, VDAC, Zeb1, c‐Src, and Ctsk immunoblotting (n = 3).
- F
Mitochondrial creatine kinase activity of shCtrl‐transduced wild‐type osteoclasts, and shCtrl‐ or shCkmt1‐transduced Zeb1 ΔM/ΔM osteoclasts cultured on plastic (n = 3).
- G
PCr/Cr ratio of scrambled shCtrl‐transduced wild‐type osteoclasts, and shCtrl‐ or shCkmt1‐transduced Zeb1 ΔM/ΔM osteoclasts cultured on plastic as determined by LC/MS analysis (n = 3).
- H, I
ATP levels (H) and RhoA activity (I) of shCtrl‐transduced wild‐type osteoclasts, and shCtrl‐ or shCkmt1‐transduced Zeb1 ΔM/ΔM osteoclasts (n = 3).
- J, K
shCtrl‐transduced wild‐type preosteoclasts, and shCtrl‐ or shCkmt1‐transduced Zeb1 ΔM/ΔM pre‐osteoclasts were cultured atop bone slices for 3 days, stained with phalloidin (red). Osteoclasts were removed and resorption pits visualized by WGA‐DAB staining (K). Scale bar, upper 20 μm, lower 100 μm. The actin ring area per cell and resorption pit area were quantified (J).
- A, B
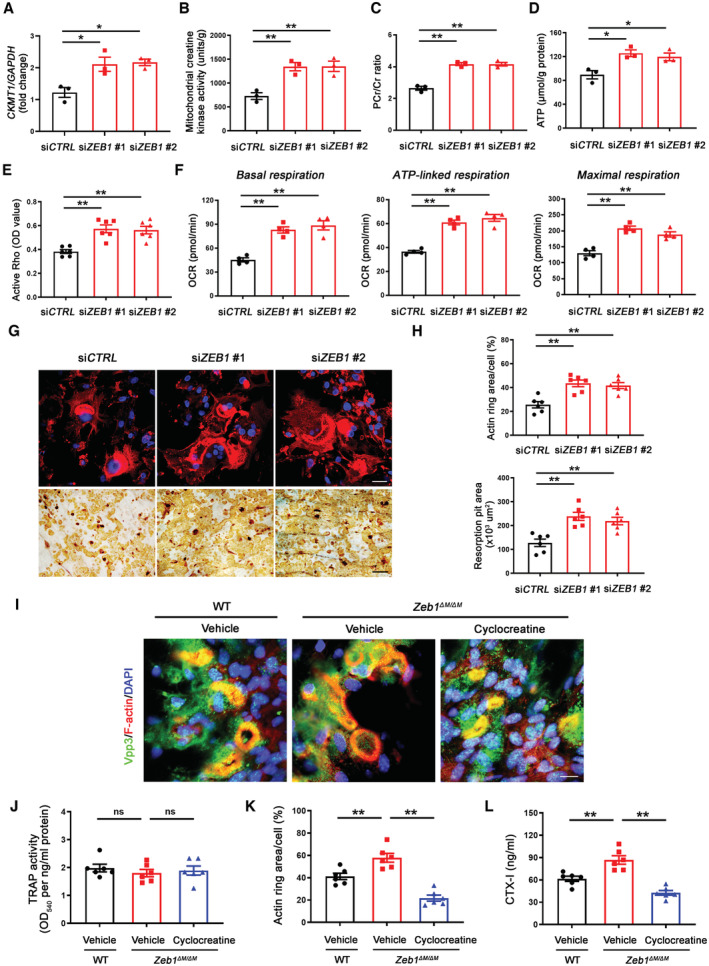
Human monocyte‐derived macrophages (hMDMs) were transfected with either shCTRL or siRNA‐targeting ZEB1, differentiated into osteoclasts, and relative mRNA expression of CKMT1 (A) and mitochondrial creatine kinase activity determined (B; n = 3).
- C
PCr/Cr ratio of osteoclasts differentiated from nontargeting siCTRL‐ or siZEB1‐transfected hMDMs cultured atop plastic substrata as determined by LC/MS analysis (n = 3).
- D, E
ATP levels (D) and RhoA activity (E) of osteoclasts differentiated from non‐targeting siCTRL‐ or siZEB1‐transfected hMDMs.
- F
Mitochondrial function parameters analyzed by XF Cell Mito Stress Assay in nontargeting siCTRL‐ or siZEB1‐transfected osteoclasts after sequential treatment of compounds modulating mitochondrial function (n = 4).
- G, H
siCTRL‐ or siZEB1‐transfected human osteoclasts were cultured atop bone slices for 6 days and stained with phalloidin (red). Osteoclasts were removed and resorption pits visualized by WGA‐DAB staining (G). Scale bar, upper 20 μm, lower 100 μm. The actin ring area per cell, resorption pit area, and the number of TRAP+ MNCs were quantified (H; n = 6).
- I–L
Calvaria isolated from wild‐type and Zeb1 ΔM/ΔM mice were cultured in the presence or absence of 200 μM cyclocreatine, and stained for phalloidin (red) and Vpp3 (green) (I). Scale bar, 10 μm. The TRAP activity of whole cell lysates, actin ring area per cell, and supernatant CTX‐I were quantified (J–L; n = 6).
- A
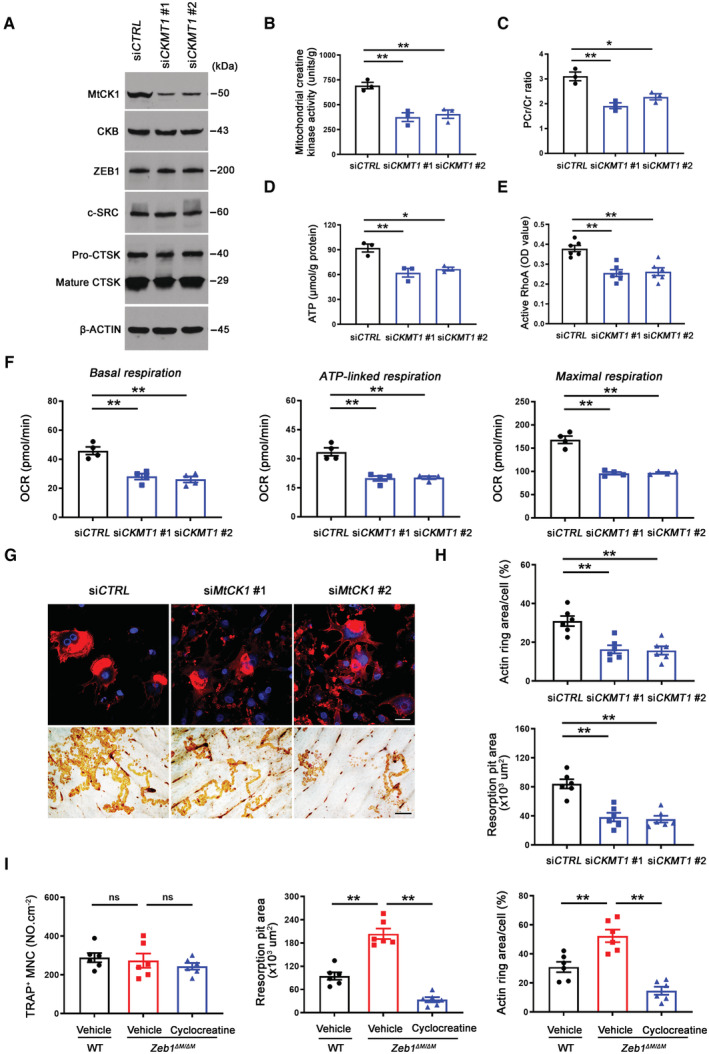
hMDMs were transfected with either nontargeting siCTRL or siRNA targeting CKMT1, differentiated into osteoclasts, and cell lysates collected for MtCK1, CKB, ZEB1, c‐SRC, and CTSK immunoblotting (n = 3).
- B
Mitochondrial creatine kinase activity of siCTRL‐ or siCKMT1‐transfected osteoclasts cultured on plastic (n = 3).
- C
Phosphocreatine/creatine (PCr/Cr) ratio of siCTRL‐ or siCKMT1‐transfected osteoclasts cultured on plastic as determined by LC/MS analysis (n = 3).
- D, E
ATP levels (D) and RhoA activity (E) of siCTRL‐ or siCKMT1‐transfected osteoclasts.
- F
Mitochondrial function parameters analyzed by XF Cell Mito Stress Assay in siCTRL‐ or siCKMT1‐transfected osteoclasts after sequential treatment of compounds modulating mitochondrial function (n = 4).
- G, H
siCTRL‐ or siCKMT1‐transfected human osteoclasts were cultured atop bone slices for 3 days, stained with phalloidin (red). Osteoclasts were removed and resorption pits visualized by WGA‐DAB staining (G). Scale bar, upper 20 μm, middle and lower 100 μm. The actin ring area per cell and resorption pit area were quantified (H; n = 6).
- I
TRAP, resorption pits visualized with WGA‐DAB staining, and phalloidin staining in wild‐type osteoclasts treated with vehicle, and Zeb1 ΔM/ΔM osteoclasts treated with vehicle or 200 μM cyclocreatine cultured on bone slices with the number of TRAP+ MNCs, resorption pit area, and actin ring area per cell quantified (n = 6).
References
-
- Arnett TR, Orriss IR (2018) Metabolic properties of the osteoclast. Bone 115: 25–30 - PubMed
-
- de Barrios O, Sanchez‐Moral L, Cortes M, Ninfali C, Profitos‐Peleja N, Martinez‐Campanario MC, Siles L, Del Campo R, Fernandez‐Acenero MJ, Darling DS et al (2019) ZEB1 promotes inflammation and progression towards inflammation‐driven carcinoma through repression of the DNA repair glycosylase MPG in epithelial cells. Gut 68: 2129–2141 - PubMed
Publication types
MeSH terms
Substances
Associated data
- Actions
Grants and funding
LinkOut - more resources
Full Text Sources
Molecular Biology Databases
