. 2023 Feb 10:14:962519.
doi: 10.3389/fendo.2023.962519. eCollection 2023.

Zinc restores functionality in porcine prepubertal Sertoli cells exposed to subtoxic cadmium concentration via regulating the Nrf2 signaling pathway

Affiliations

Zinc restores functionality in porcine prepubertal Sertoli cells exposed to subtoxic cadmium concentration via regulating the Nrf2 signaling pathway

Francesca Mancuso et al. Front Endocrinol (Lausanne). .

Abstract

Introduction: Among substances released into the environment by anthropogenic activities, the heavy metal cadmium (Cd) is known to induce severe testicular injury causing male subfertility/infertility. Zinc (Zn) is another heavy metal that, unlike Cd, is physiologically present in the testis, being essential for spermatogenesis. We aimed to examine the possibility that 50 µM ZnCl2 could counteract the toxic effects induced by Cd in an in vitro model of porcine prepubertal Sertoli cells (SCs) exposed to both subtoxic (5 μM) and toxic (10 μM) concentrations of CdCl2 for 48 h.

Materials and methods: Apoptosis, cell cycle, and cell functionality were assessed. The gene expression of Nrf2 and its downstream antioxidant enzymes, ERK1/2, and AKT kinase signaling pathways were evaluated.

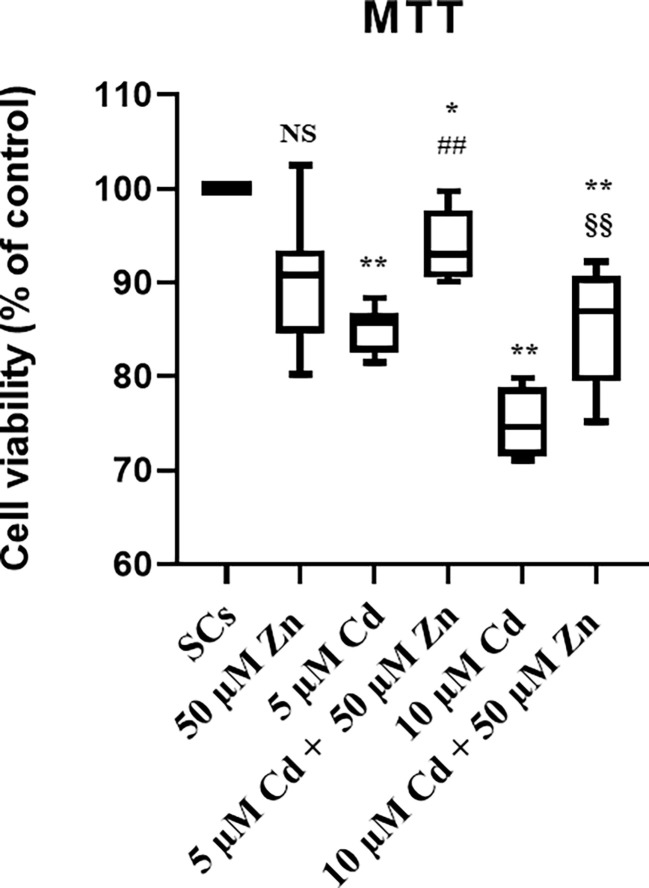
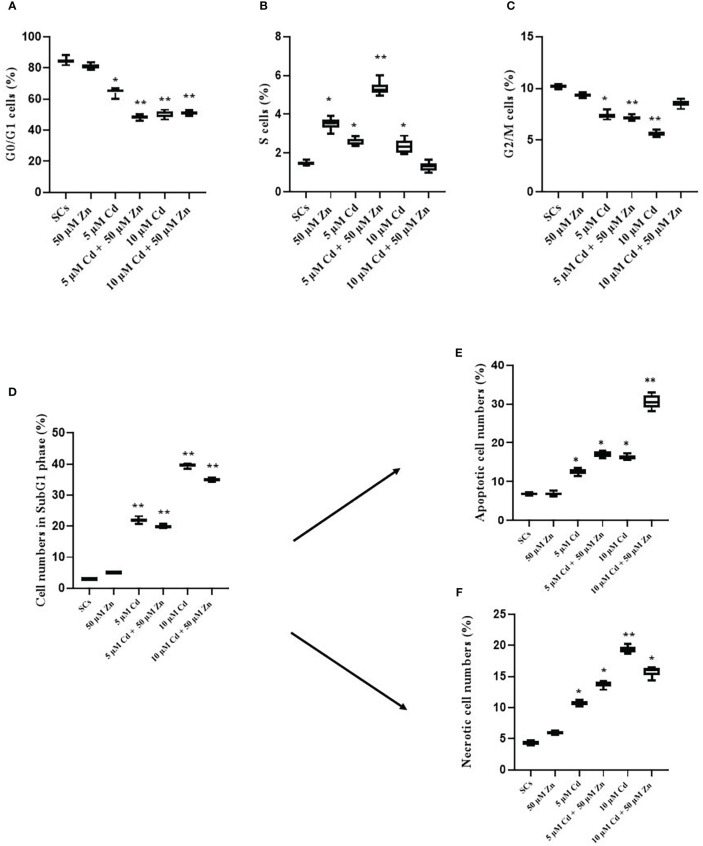
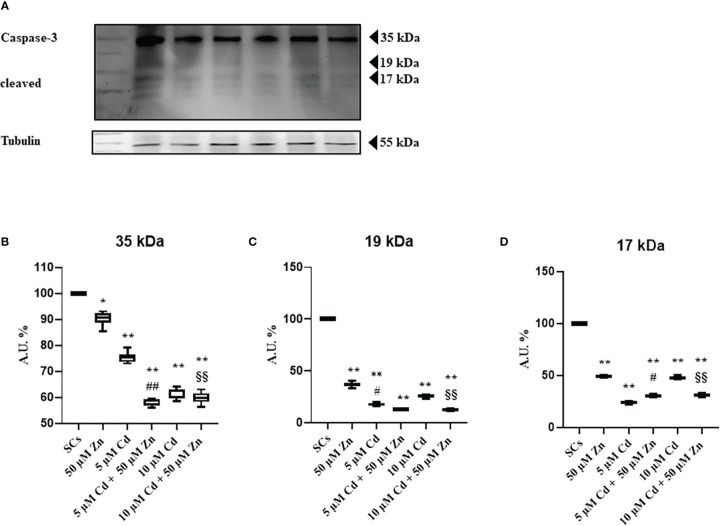
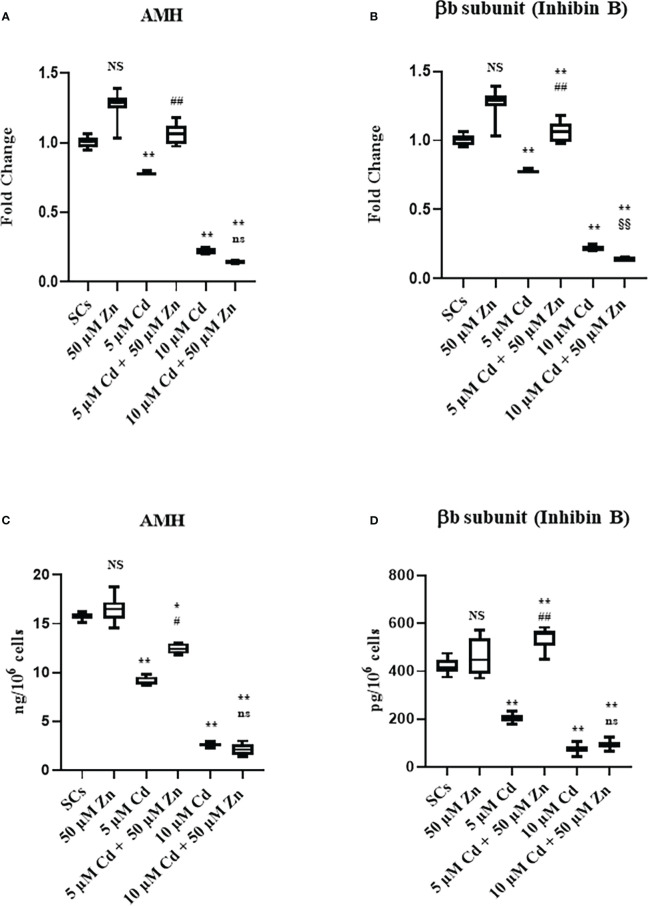
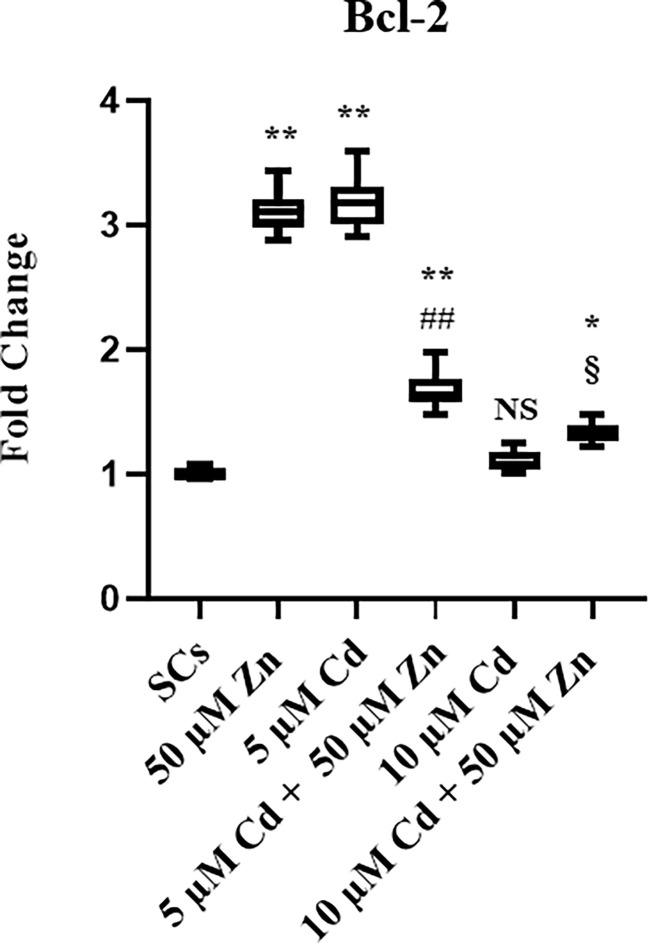
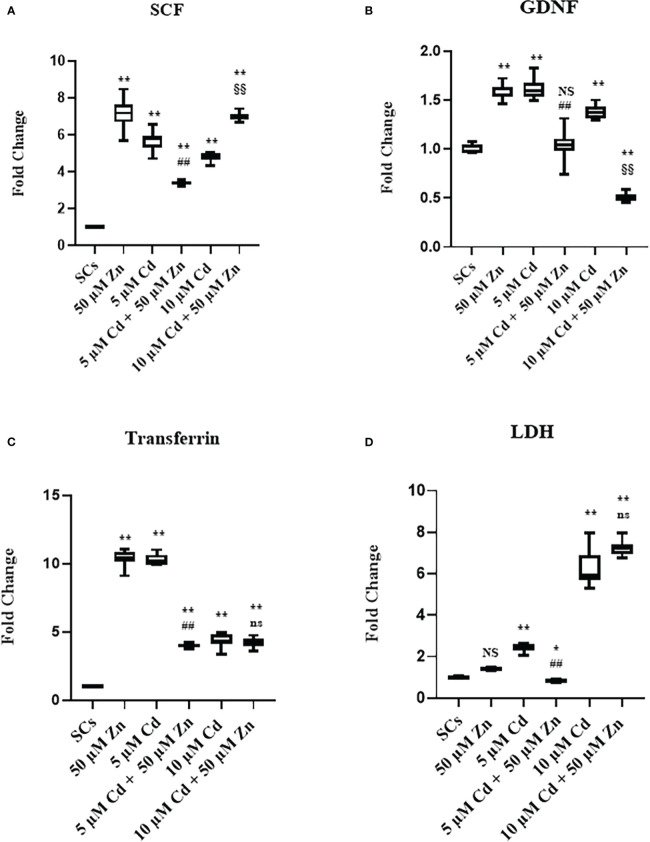
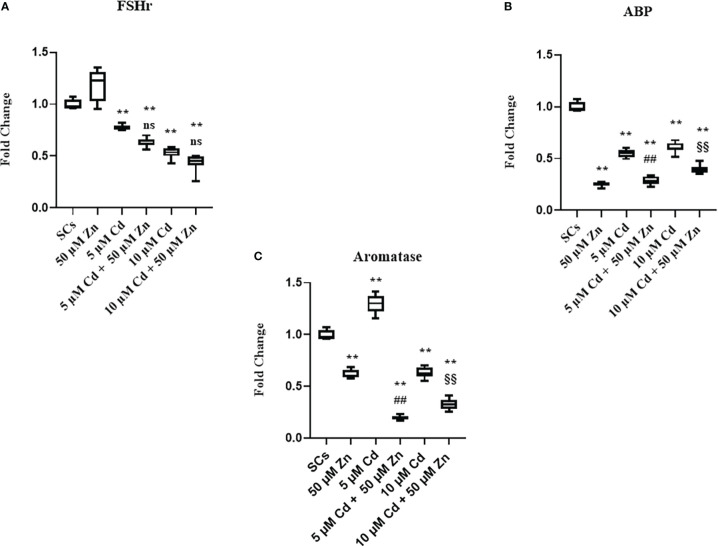
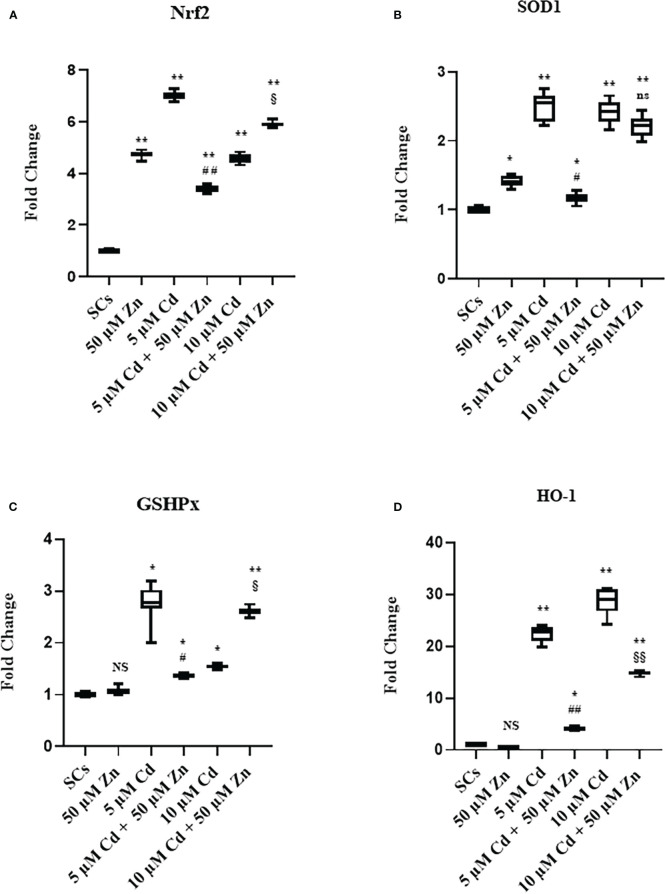
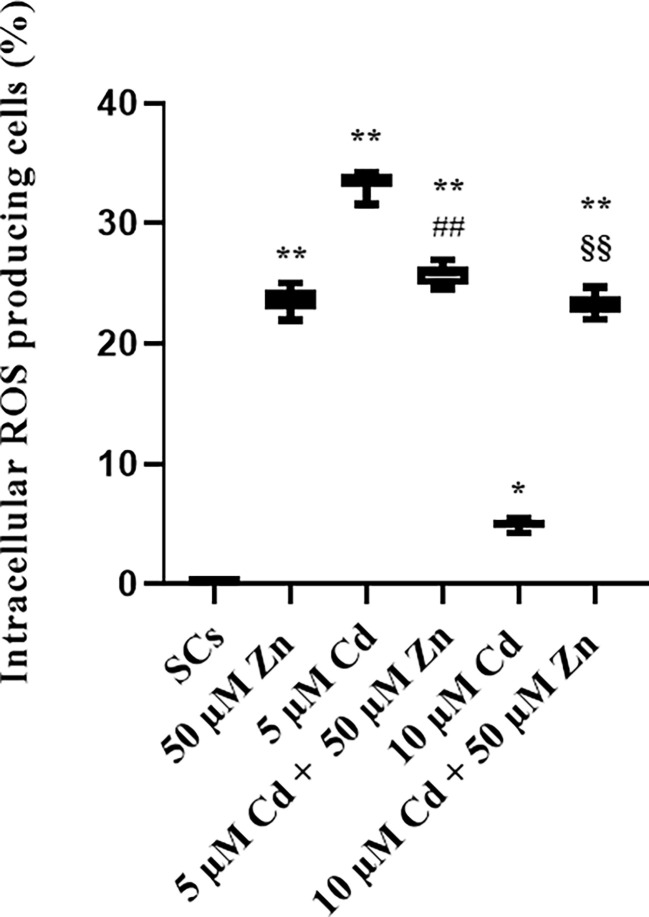
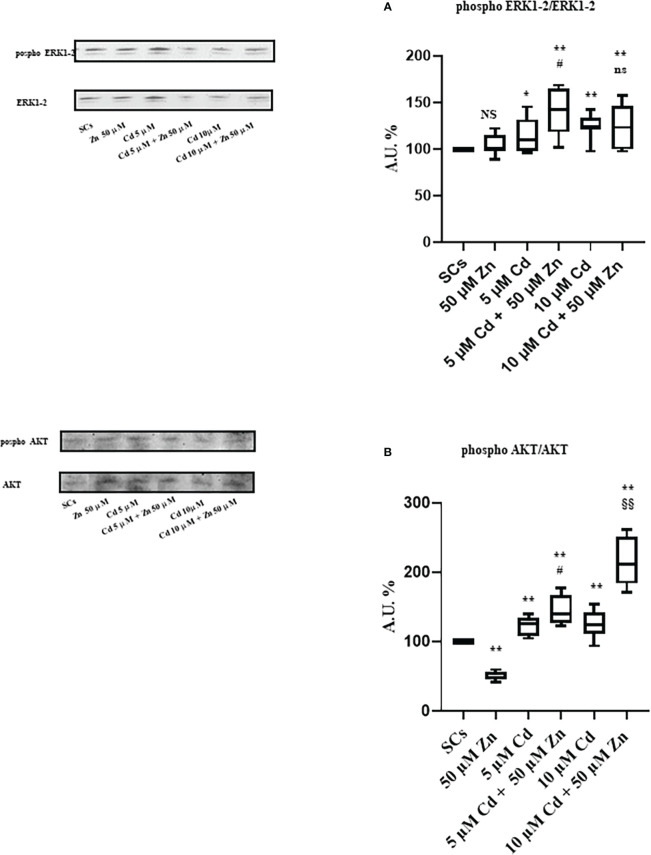
Materials and results: We found that Zn, in co-treatment with subtoxic and toxic Cd concentration, increased the number of metabolically active SCs compared to Cd exposure alone but restored SC functionality only in co-treatment with subtoxic Cd concentration with respect to subtoxic Cd alone. Exposure of Cd disrupted cell cycle in SCs, and Zn co-treatment was not able to counteract this effect. Cd alone induced SC death through apoptosis and necrosis in a dose-dependent manner, and co-treatment with Zn increased the pro-apoptotic effect of Cd. Subtoxic and toxic Cd exposures activated the Nrf2 signaling pathway by increasing gene expression of Nrf2 and its downstream genes (SOD, HO-1, and GSHPx). Zn co-treatment with subtoxic Cd attenuated upregulation on the Nrf2 system, while with toxic Cd, the effect was more erratic. Studying ERK1/2 and AKT pathways as a target, we found that the phosphorylation ratio of p-ERK1/2 and p-AKT was upregulated by both subtoxic and toxic Cd exposure alone and in co-treatment with Zn.

Discussion: Our results suggest that Zn could counteract Cd effects by increasing the number of metabolically active SCs, fully or partially restoring their functionality by modulating Nrf2, ERK1/2, and AKT pathways. Our SC model could be useful to study the effects of early Cd exposure on immature testis, evaluating the possible protective effects of Zn.

Keywords: Nrf2 signaling pathway; Sertoli cells; cadmium; oxidative stress; zinc.


Conflict of interest statement

The authors declare that the research was conducted in the absence of any commercial or financial relationships that could be construed as a potential conflict of interest.

Figures

Figure 1
Figure 1
Cell viability by MTT test. Cytotoxicity, measured using MTT reagent in the absence (unexposed-control group, SCs) or presence of 5 or 10 µM CdCl2 and/or 50 µM ZnCl2 for 48 h. Data presented as the mean ± SEM (NS vs. SCs, *p < 0.05 and **p < 0.001 vs. SCs, ##p < 0.001 vs. 5 µM Cd, §§p < 0.001 vs. 10 µM of three independent experiments, each performed in triplicate).
Figure 2
Figure 2
Cell cycle progression, apoptosis, and necrosis. Percentage of cells in G0/G1 (A), S (B), and G2/M (C) and sub-G1 phase (D) in the absence (unexposed-control group, SCs) or presence of 5 or 10 µM CdCl2 and/or 50 µM ZnCl2 for 48 h. Percentage of apoptotic (E) and necrotic (F) cells in the sub-G1 phase in the absence (unexposed-control group, SCs) or presence of 5 or 10 µM CdCl2 and/or 50 µM ZnCl2 for 48 h. Data presented as the mean ± SEM (*p < 0.05 and **p < 0.001 vs. SCs of three independent experiments, each performed in triplicate).
Figure 3
Figure 3
WB analysis of apoptosis. (A) Immunoblots of caspase-3 p35, p19, and p17 in the absence (unexposed-control group, SCs) or presence of 5 or 10 μM CdCl2 and/or 50 µM ZnCl2 for 48 h. Densitometric analysis of the protein bands of caspase-3 p35 (B), p19 (C), and p17 (D) in the absence (unexposed-control group, SCs) or presence of 5 or 10 µM CdCl2 and/or 50 µM ZnCl2 for 48 h. Data presented as the mean ± SEM (*p < 0.05 and **p < 0.001 vs. SCs, #p < 0.05 and ##p < 0.001 vs. 5 µM Cd, §§p < 0.001 vs. 10 μM of three independent experiments, each performed in triplicate).
Figure 4
Figure 4
Gene expression and protein secretion of AMH (A, C), and βB subunit (Inhibin B) (B, D) in the absence (unexposed-control group, SCs) or presence of 5 or 10 µM CdCl2 and/or 50 µM ZnCl2 for 48 h. Data represent the mean ± S.E.M. (Not significant, NS). NS vs SCs, *p<0.05 and **p<0.001, #p<0.05 and #p<0.05 vs 5 µM Cd, §p<0.05 vs 10 µM, (not significant, ns) ns vs 10 µM of three independent experiments, each performed in triplicate.
Figure 5
Figure 5
Real-Time PCR analysis of Bcl-2. Gene expression of Bcl-2 in the absence (unexposed-control group, SCs) or presence of 5 or 10 µM CdCl2 and/or 50 µM ZnCl2 for 48 h. Data represent the mean ± S.E.M. (Not significant, NS). NS vs SCs, *p < 0.05 and **p < 0.001, ##p < 0.001 vs 5 µM Cd, §p < 0.05 vs 10 µM of three independent experiments, each performed in triplicate.
Figure 6
Figure 6
Real-time PCR analysis of SC functionality. Gene expression of SCF (A) GDNF (B), transferrin (C), and lactate dehydrogenase (LDH) (D) in the absence (unexposed-control group, SCs) or presence of 5 or 10 µM CdCl2 and/or 50 µM ZnCl2 for 48 h. Data presented as the mean ± SEM. (Not significant, NS). NS vs. SCs, *p < 0.05 and **p < 0.001, #p < 0.05 and ##p < 0.001 vs. 5 µM Cd, §p < 0.05 and §§ p < 0.001 vs. 10 μM. (Not significant, ns) ns vs. 10 μM of three independent experiments, each performed in triplicate.
Figure 7
Figure 7
Real-time PCR analysis of SC functionality. Gene expression of FSHr (A), androgen binding protein (ABP) (B), and aromatase (C) in the absence (unexposed-control group, SCs) or presence of 5 or 10 μM CdCl2 and/or 50 µM ZnCl2 for 48 h. Data presented as the mean ± SEM. (Not significant, NS). NS vs. SCs, *p < 0.05 and **p < 0.001, #p < 0.05 and ##p< 0.001 vs. 5 µM Cd, §p<0.05, §§p< 0.001 vs. 10 µM, (not significant, ns) ns vs. 10 µM of three independent experiments, each performed in triplicate.
Figure 8
Figure 8
Real-time PCR analysis of antioxidant enzymes. Gene expression of Nrf2 (A), SOD1 (B), GSHPx (C), and HO-1 (D) in the absence (unexposed-control group, SCs) or presence of 5 or 10 µM CdCl2 and/or 50 µM ZnCl2 for 48 h. Data presented as the mean ± SEM (NS vs. SCs, *p < 0.05 and **p < 0.001, #p < 0.05 and ##p < 0.001 vs. 5 µM Cd, §p < 0.05 and §§p < 0.001, (not significant, ns), ns vs. 10 µM of three independent experiments, each performed in triplicate.
Figure 9
Figure 9
ROS assay. Intracellular ROS-producing cells in the absence (unexposed-control group, SCs) or presence of 5 or 10 µM CdCl2 and/or 50 µM ZnCl2 for 48 h. Data presented as the mean ± SEM. (*p < 0.05 and **p < 0.001, ##p < 0.001 vs. 5 µM Cd, §§p < 0.001 vs. 10 µM of three independent experiments, each performed in triplicate).
Figure 10
Figure 10
WB analysis of ERK1/2 and AKT pathways. (A) Immunoblots (upper left) and densitometric analysis (upper right) of the phosphorylation ratio of ERK1/2 in the absence (unexposed-control group, SCs) or presence of 5 or 10 µM CdCl2 and/or 50 μM ZnCl2 for 48 h. (B) Immunoblots (lower left) and densitometric analysis (lower right) of phosphorylation ratio of AKT in the absence (unexposed-control group, SCs) or presence of 5 or 10 µM CdCl2 and/or 50 µM ZnCl2 for 48 h. Data presented as the mean ± SEM (NS vs. SCs, *p < 0.05 and **p < 0.001 vs. SCs, #p < 0.05 vs. 5 µM Cd, §§p < 0.001 vs. 10 µM, ns vs. 10 μM of three independent experiments, each performed in triplicate) [*p < 0.05 and **p < 0.001, with respect to unexposed SCs (black dotted line) of three independent experiments, each performed in triplicate]. A.U., arbitrary units.

Similar articles

Cited by

References

    1. Bhongade MB, Prasad S, Jiloha RC, Ray PC, Mohapatra S, Koner BC. Effect of psychological stress on fertility hormones and seminal quality in male partners of infertile couples. Andrologia (2015) 47:336–42. doi: 10.1111/and.12268 - DOI - PubMed
    1. Ombelet W. WHO fact sheet on infertility gives hope to millions of infertile couples worldwide. Facts Views Vis Obgyn (2020) 12:249–51. - PMC - PubMed
    1. Jungwirth A, Giwercman A, Tournaye H, Diemer T, Kopa Z, Dohle G, et al. . European Association of urology guidelines on Male infertility: the 2012 update. Eur Urol (2012) 62:324–32. doi: 10.1016/j.eururo.2012.04.048 - DOI - PubMed
    1. Agarwal A, Baskaran S, Parekh N, Cho CL, Henkel R, Vij S, et al. . Male Infertility. Lancet (2021) 397:319–33. doi: 10.1016/S0140-6736(20)32667-2 - DOI - PubMed
    1. Agarwal A, Mulgund A, Hamada A, Chyatte MR. A unique view on male infertility around the globe. Reprod Biol Endocrinol (2015) 13:37. doi: 10.1186/s12958-015-0032-1 - DOI - PMC - PubMed

Publication types