

Characterization of placental endocrine function and fetal brain development in a mouse model of small for gestational age
- PMID: 36843585
- PMCID: PMC9950515
- DOI: 10.3389/fendo.2023.1116770
Characterization of placental endocrine function and fetal brain development in a mouse model of small for gestational age
Abstract
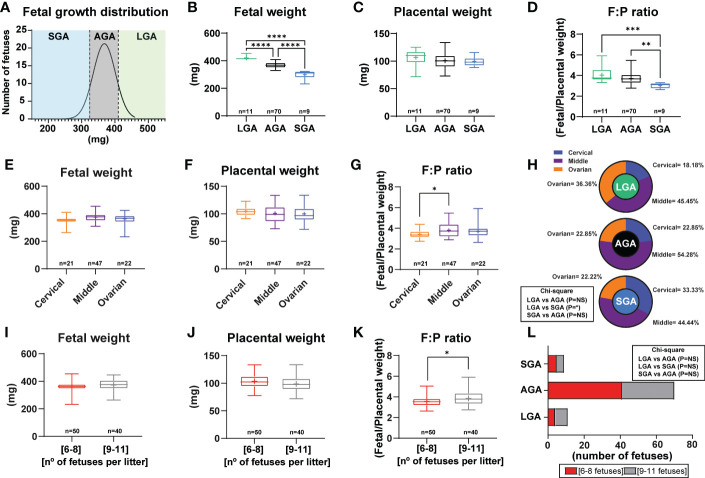
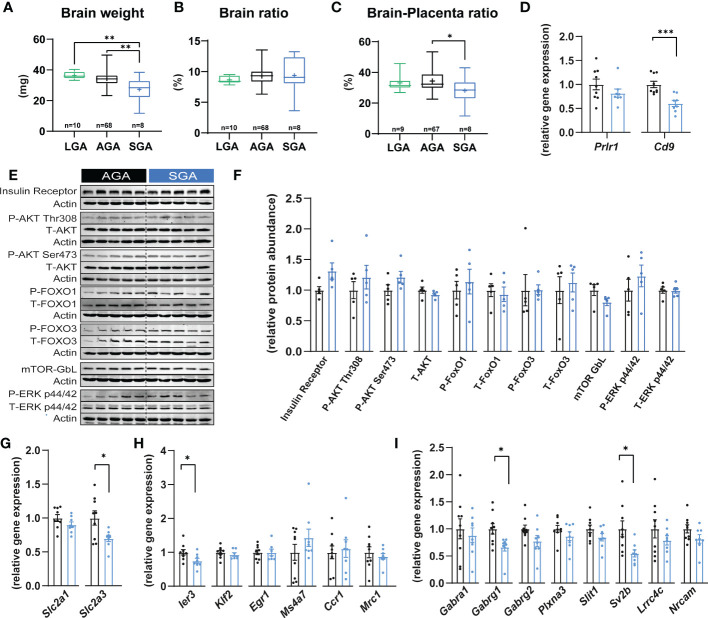
Conditions such as small for gestational age (SGA), which is defined as birthweight less than 10th percentile for gestational age can predispose to neurodevelopmental abnormalities compared to babies with normal birthweight. Fetal growth and birthweight depend on placental function, as this organ transports substrates to the developing fetus and it acts as a source of endocrine factors, including steroids and prolactins that are required for fetal development and pregnancy maintenance. To advance our knowledge on the aetiology of fetal growth disorders, the vast majority of the research has been focused on studying the transport function of the placenta, leaving practically unexplored the contribution of placental hormones in the regulation of fetal growth. Here, using mice and natural variability in fetal growth within the litter, we compared fetuses that fell on or below the 10th percentile (classified as SGA) with those that had adequate weight for their gestational age (AGA). In particular, we compared placental endocrine metabolism and hormone production, as well as fetal brain weight and expression of developmental, growth and metabolic genes between SGA and AGA fetuses. We found that compared to AGA fetuses, SGA fetuses had lower placental efficiency and reduced capacity for placental production of hormones (e.g. steroidogenic gene Cyp17a1, prolactin Prl3a1, and pregnancy-specific glycoproteins Psg21). Brain weight was reduced in SGA fetuses, although this was proportional to the reduction in overall fetal size. The expression of glucose transporter 3 (Slc2a3) was reduced despite the abundance of AKT, FOXO and ERK proteins were similar. Developmental (Sv2b and Gabrg1) and microglia genes (Ier3), as well as the pregnancy-specific glycoprotein receptor (Cd9) were lower in the brain of SGA versus AGA fetuses. In this mouse model of SGA, our results therefore demonstrate that placental endocrine dysfunction is associated with changes in fetal growth and fetal brain development.
Keywords: animal models; endocrinology; fetal growth; mouse; placenta; pregnancy; pregnancy specific glycoprotein; prolactin.
Copyright © 2023 Lopez-Tello and Sferruzzi-Perri.
Conflict of interest statement
The authors declare that the research was conducted in the absence of any commercial or financial relationships that could be construed as a potential conflict of interest.
Figures

Similar articles
-
Placental chemical elements concentration in small fetuses and its relationship with Doppler markers of placental function.Placenta. 2021 Jul;110:1-8. doi: 10.1016/j.placenta.2021.05.001. Epub 2021 May 14. Placenta. 2021. PMID: 34051643
-
Third-trimester growth diversity in small fetuses classified as appropriate-for-gestational age or small-for-gestational age at birth.Ultrasound Obstet Gynecol. 2021 Dec;58(6):882-891. doi: 10.1002/uog.23688. Ultrasound Obstet Gynecol. 2021. PMID: 33998089
-
Maternal stress and fetoplacental cortisol regulation in small-for-gestational-age newborns.Ultrasound Obstet Gynecol. 2025 Jun;65(6):738-748. doi: 10.1002/uog.29238. Epub 2025 May 8. Ultrasound Obstet Gynecol. 2025. PMID: 40344310 Free PMC article.
-
Biochemical tests of placental function versus ultrasound assessment of fetal size for stillbirth and small-for-gestational-age infants.Cochrane Database Syst Rev. 2019 May 14;5(5):CD012245. doi: 10.1002/14651858.CD012245.pub2. Cochrane Database Syst Rev. 2019. PMID: 31087568 Free PMC article.
-
Placental growth and fetal/placental weight (F/P) ratios throughout gestation--their relationship to patterns of fetal growth.Semin Perinatol. 1984 Apr;8(2):94-100. Semin Perinatol. 1984. PMID: 6374904 Review.
Cited by
-
Epigenetic modifications of placenta in women with gestational diabetes mellitus and their offspring.World J Diabetes. 2024 Mar 15;15(3):378-391. doi: 10.4239/wjd.v15.i3.378. World J Diabetes. 2024. PMID: 38591094 Free PMC article. Review.
-
Sex-bias metabolism of fetal organs, and their relationship to the regulation of fetal brain-placental axis.Metabolomics. 2024 Nov 4;20(6):126. doi: 10.1007/s11306-024-02189-w. Metabolomics. 2024. PMID: 39495316
-
Maternal and Intrauterine Influences on Feto-Placental Growth Are Accompanied by Sexually Dimorphic Changes in Placental Mitochondrial Respiration, and Metabolic Signalling Pathways.Cells. 2023 Mar 3;12(5):797. doi: 10.3390/cells12050797. Cells. 2023. PMID: 36899933 Free PMC article.
-
Effects of exercise on vascular remodelling and fetal growth in uncomplicated and abortion-prone mouse pregnancies.Sci Rep. 2024 Dec 30;14(1):31841. doi: 10.1038/s41598-024-83329-z. Sci Rep. 2024. PMID: 39738331 Free PMC article.
-
Maternal gut Bifidobacterium breve modifies fetal brain metabolism in germ-free mice.Mol Metab. 2024 Oct;88:102004. doi: 10.1016/j.molmet.2024.102004. Epub 2024 Aug 8. Mol Metab. 2024. PMID: 39127167 Free PMC article.
References
-
- Padidela RNR, Bhat V. Neurobehavioral assessment of appropriate for gestational and small for gestational age babies. Indian Pediatr (2003) 40:1063–8. - PubMed
Publication types
MeSH terms
Grants and funding
LinkOut - more resources
Full Text Sources
Molecular Biology Databases
Miscellaneous